
Network Scale: 6,581 locations span 51 states and territories nationwide.
Market Leader: Texas leads with 569 Burger King restaurants.
City Concentration: Houston has the highest count with 84 locations.
Competitive Coverage: Burger King trails major chains in nationwide location counts.
Dataset Depth: Records include addresses, phones, coordinates, and update dates.

The U.S. quick-service restaurant market continues to depend heavily on location coverage, customer accessibility, pricing, menu variety, and competitive positioning. With thousands of outlets distributed across major metropolitan areas and smaller communities, Burger King represents a valuable dataset for understanding restaurant-network expansion and market density. Scrape Burger King Restaurant Data in the US 2026 to provide a structured view of restaurant locations, geographic distribution, population coverage, and competitive benchmarks.
Burger King US Market Data Scraping can help transform restaurant-location records into actionable market intelligence covering states, cities, addresses, phone numbers, geographic coordinates, and operating information. Based on the supplied July 14, 2026 dataset, the United States has 6,581 Burger King locations across 51 states and territories and 3,206 cities.
Burger King Restaurant Location Data Extraction further enables businesses to evaluate where Burger King has the strongest presence, identify geographic concentration, compare restaurant density against population, and examine opportunities in markets with relatively limited coverage.
The reported 6,581 Burger King restaurants demonstrate the scale of the brand's physical footprint. The dataset covers individual restaurant records with fields such as restaurant name, street address, city, state or territory, ZIP code, telephone number, latitude, longitude, country, and last updated date.
The geographic distribution is particularly important because restaurant counts alone do not reveal market saturation. Texas, for example, has 569 Burger King restaurants, representing approximately 9% of the reported U.S. network. Florida follows with 486 locations, while California has 471.
Burger King Restaurant Locations Data Scraping USA can organize these records into state-level and city-level datasets, making it easier to measure restaurant concentration and identify the markets contributing most significantly to the overall network.
The population-per-restaurant metric provides another useful perspective. Florida has approximately one Burger King for every 44,193 people, compared with approximately one for every 83,890 people in California. Such differences can reveal variations in restaurant density, population distribution, urbanization, and potential market coverage.
The top ten states and territories account for a substantial portion of the reported Burger King network. Texas leads with 569 locations, followed by Florida with 486 and California with 471. New York records 348 locations, while Ohio has 286.
Pennsylvania has 273 restaurants, followed by Illinois and Georgia with 267 each. Michigan records 240, while North Carolina has 231. Together, these markets demonstrate how Burger King's U.S. footprint is concentrated across large population centers and established restaurant markets.
Extract Burger King Location Data In USA to support geographic segmentation by ZIP code, metropolitan area, city, and state. This makes the dataset useful for territory analysis, site-selection research, franchise benchmarking, and regional restaurant intelligence.
| Rank | State / Territory | Burger King Locations | Share of U.S. Locations | Population | Population per Restaurant | Approx. Location Density |
|---|---|---|---|---|---|---|
| 1 | Texas | 569 | 9% | 29.00M | 50.96K | High |
| 2 | Florida | 486 | 7% | 21.48M | 44.19K | Very High |
| 3 | California | 471 | 7% | 39.51M | 83.89K | Moderate |
| 4 | New York | 348 | 5% | 19.45M | 55.90K | High |
| 5 | Ohio | 286 | 4% | 11.69M | 40.87K | Very High |
| 6 | Pennsylvania | 273 | 4% | 12.80M | 46.89K | Very High |
| 7 | Illinois | 267 | 4% | 12.67M | 47.46K | Very High |
| 8 | Georgia | 267 | 4% | 10.62M | 39.76K | Very High |
| 9 | Michigan | 240 | 4% | 9.99M | 41.61K | Very High |
| 10 | North Carolina | 231 | 4% | 10.49M | 45.40K | Very High |
The data also identifies five listed U.S. territories without Burger King restaurants: Guam, U.S. Virgin Islands, Northern Mariana Islands, Puerto Rico, and American Samoa. This geographic absence is useful when assessing the boundaries of the brand's current reported footprint.
Restaurant distribution becomes even more valuable when analyzed at the city level. Houston leads the supplied ranking with 84 Burger King locations, making it the largest individual city market in the dataset. Chicago follows with 45, while Las Vegas has 39.
Miami records 37 locations, Phoenix has 33, and Brooklyn has 31. San Antonio also has 31, followed by Dallas and Jacksonville with 25 each. Indianapolis completes the top ten with 24 locations.
Burger King Competitive Intelligence can combine these city-level observations with competitor counts, population metrics, restaurant categories, and geographic coordinates. This allows analysts to evaluate whether Burger King's strongest markets are also highly competitive restaurant environments.
| Rank | City | State / Territory | Locations | Share of 6,581 Locations | Approx. Difference vs. #1 | Market Observation |
|---|---|---|---|---|---|---|
| 1 | Houston | Texas | 84 | 1.28% | --- | Largest reported city cluster |
| 2 | Chicago | Illinois | 45 | 0.68% | -39 | Major urban concentration |
| 3 | Las Vegas | Nevada | 39 | 0.59% | -45 | Strong tourism market |
| 4 | Miami | Florida | 37 | 0.56% | -47 | Dense metropolitan market |
| 5 | Phoenix | Arizona | 33 | 0.50% | -51 | Large Sun Belt market |
| 6 | Brooklyn | New York | 31 | 0.47% | -53 | High-density urban market |
| 7 | San Antonio | Texas | 31 | 0.47% | -53 | Major Texas cluster |
| 8 | Dallas | Texas | 25 | 0.38% | -59 | Strong regional coverage |
| 9 | Jacksonville | Florida | 25 | 0.38% | -59 | Large geographic market |
| 10 | Indianapolis | Indiana | 24 | 0.36% | -60 | Significant Midwest presence |
A structured Burger King Store Dataset can provide substantially more value than a simple list of restaurant names. The supplied records demonstrate how each location can be connected to precise geographic and contact information.
For example, individual records include street addresses in Berkeley, Hesperia, Chino, Martinez, Sanger, Los Angeles, Camarillo, Cotati, Coronado, and Livonia. Latitude and longitude coordinates allow these restaurants to be mapped and analyzed geographically.
A standardized dataset can also support deduplication, ZIP-code analysis, state segmentation, city clustering, and historical monitoring. When refreshed periodically, location records can help identify newly added restaurants, relocated outlets, and changes in network coverage.
Burger King's 6,581 reported locations can also be compared against other major restaurant chains. The supplied benchmark shows Subway at 20,122 locations, Starbucks at 16,909, McDonald's at 13,882, Hunt Brothers Pizza at 11,541, and Dunkin Donuts at 10,135.
These comparisons illustrate that Burger King's footprint is smaller than each of the listed competitors in total U.S. locations, although the geographic reach differs between brands. For example, the supplied data shows Burger King across 51 states and territories, while McDonald's is reported across 54.
Such benchmarking is useful because restaurant-network size does not necessarily equal market strength. City concentration, population coverage, average distance between outlets, and regional penetration can provide a more meaningful competitive picture.
Location data becomes even more valuable when combined with digital restaurant information. Burger king Food Delivery Scraping API applications can support structured collection and integration of delivery-related restaurant information, where available, for broader analysis of digital food-service markets.
Food Data Scraping in the USA can extend the research beyond physical outlets by connecting restaurant locations with menu items, prices, categories, descriptions, ratings, promotions, and delivery information.
Food Delivery Dashboard solutions can then transform these datasets into visual market intelligence, allowing analysts to monitor restaurant coverage, menu pricing, availability, delivery presence, and geographic patterns through a centralized interface.
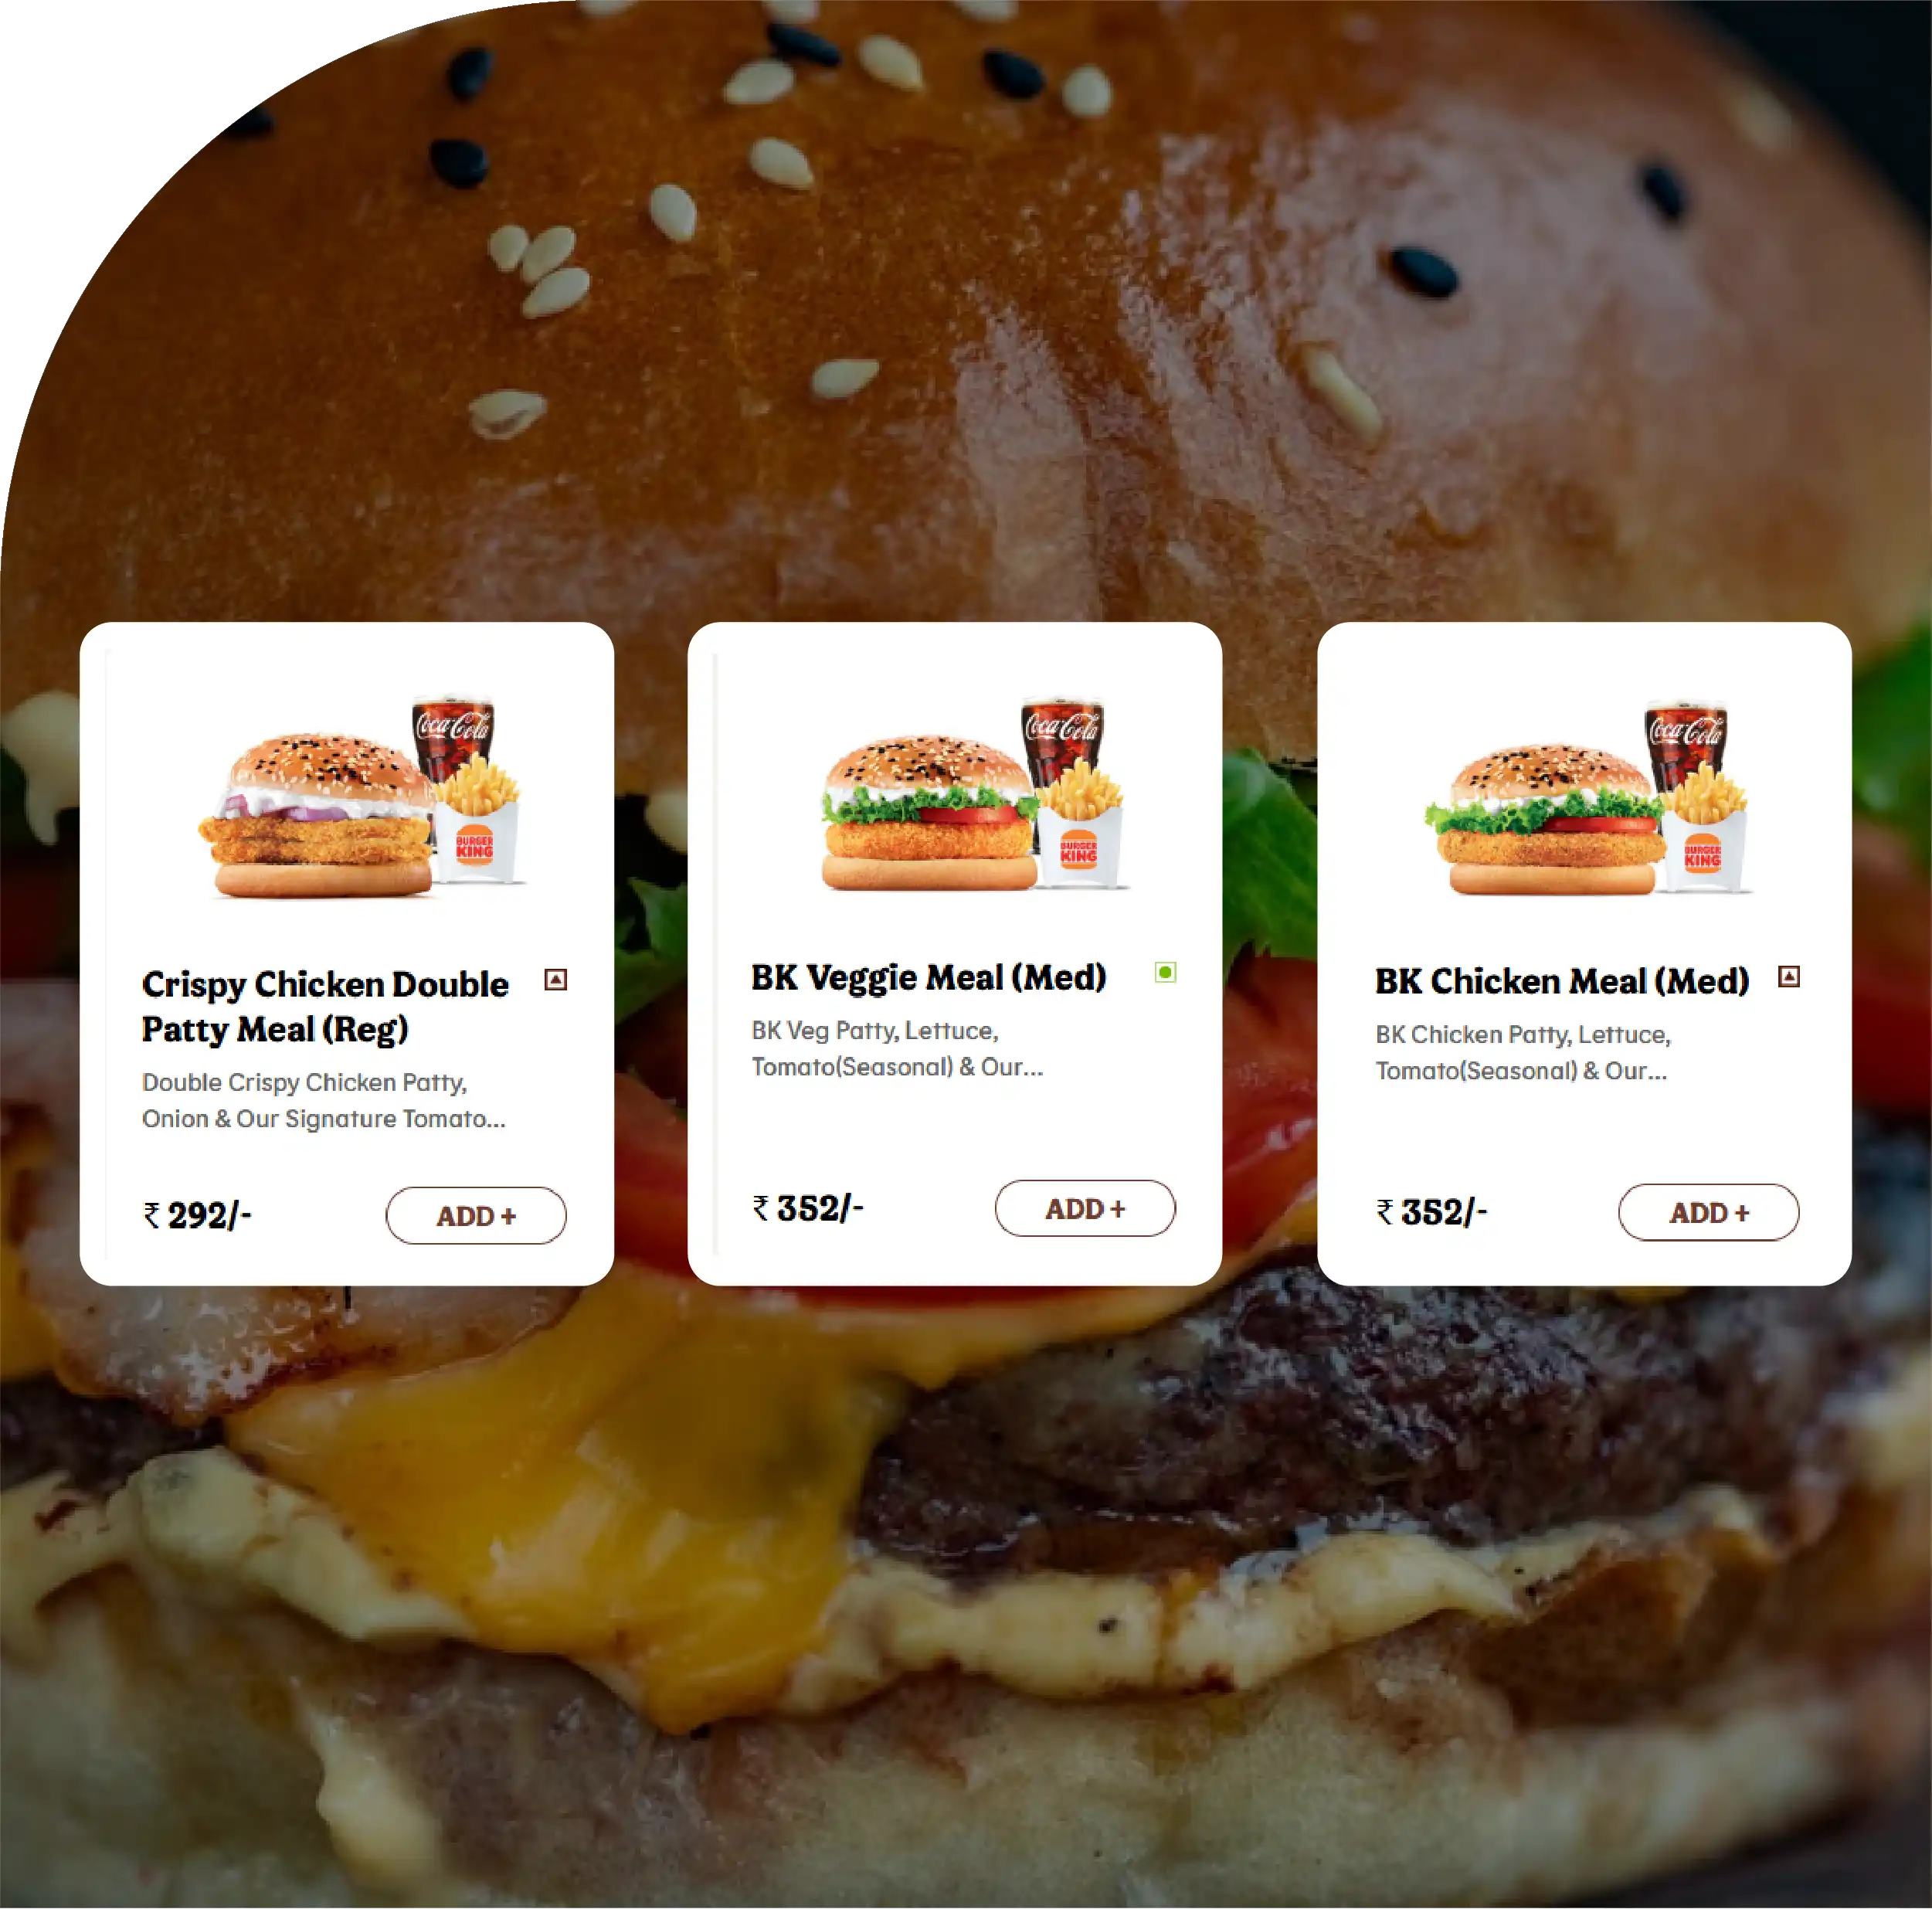
Physical location intelligence provides the geographic foundation, while menu information adds a commercial layer to the analysis. Restaurant Menu Data Scraping can structure information around burgers, chicken products, sides, beverages, desserts, meal combinations, prices, descriptions, and promotional offers.
When location and menu datasets are connected, analysts can study whether pricing varies across regions, identify differences in menu availability, compare product positioning, and monitor changes over time. This creates a broader restaurant intelligence framework rather than treating every location as an isolated record.
For franchise researchers, food delivery businesses, market analysts, and competitive intelligence teams, combining location, menu, and pricing datasets can provide a more complete picture of Burger King's position within the U.S. quick-service restaurant ecosystem.
The 2026 Burger King dataset can support multiple analytical applications. Retail and restaurant analysts can use location records to study geographic expansion. Franchise researchers can evaluate markets with high or low restaurant concentration. Delivery platforms can examine restaurant coverage by ZIP code and metropolitan area.
Real estate and location intelligence teams can combine coordinates with demographic and commercial datasets to identify areas where restaurant density differs from population concentration. Competitor analysts can compare Burger King's city presence against other QSR networks.
Periodic collection also enables historical comparisons. Instead of viewing the 6,581-location figure as a static number, organizations can maintain successive datasets to track changes in restaurant openings, closures, relocations, and geographic expansion.
The supplied July 14, 2026 data presents Burger King's U.S. restaurant network as a substantial geographic dataset containing 6,581 reported locations across 3,206 cities. Texas leads with 569 restaurants, followed by Florida with 486 and California with 471, while Houston represents the largest reported city cluster with 84 locations.
By combining geographic records with population metrics, city-level coverage, competitive benchmarks, menu information, pricing, and delivery intelligence, restaurant datasets can move beyond simple location directories toward strategic market analysis. AI Restaurant Intelligence can further enhance this approach by helping businesses identify geographic patterns, detect pricing shifts, evaluate competitive gaps, and convert large restaurant datasets into faster, more actionable market insights.
If you are seeking for a reliable data scraping services, Food Data Scrape is at your service. We hold prominence in Food Data Aggregator and Mobile Restaurant App Scraping with impeccable data analysis for strategic decision-making.