
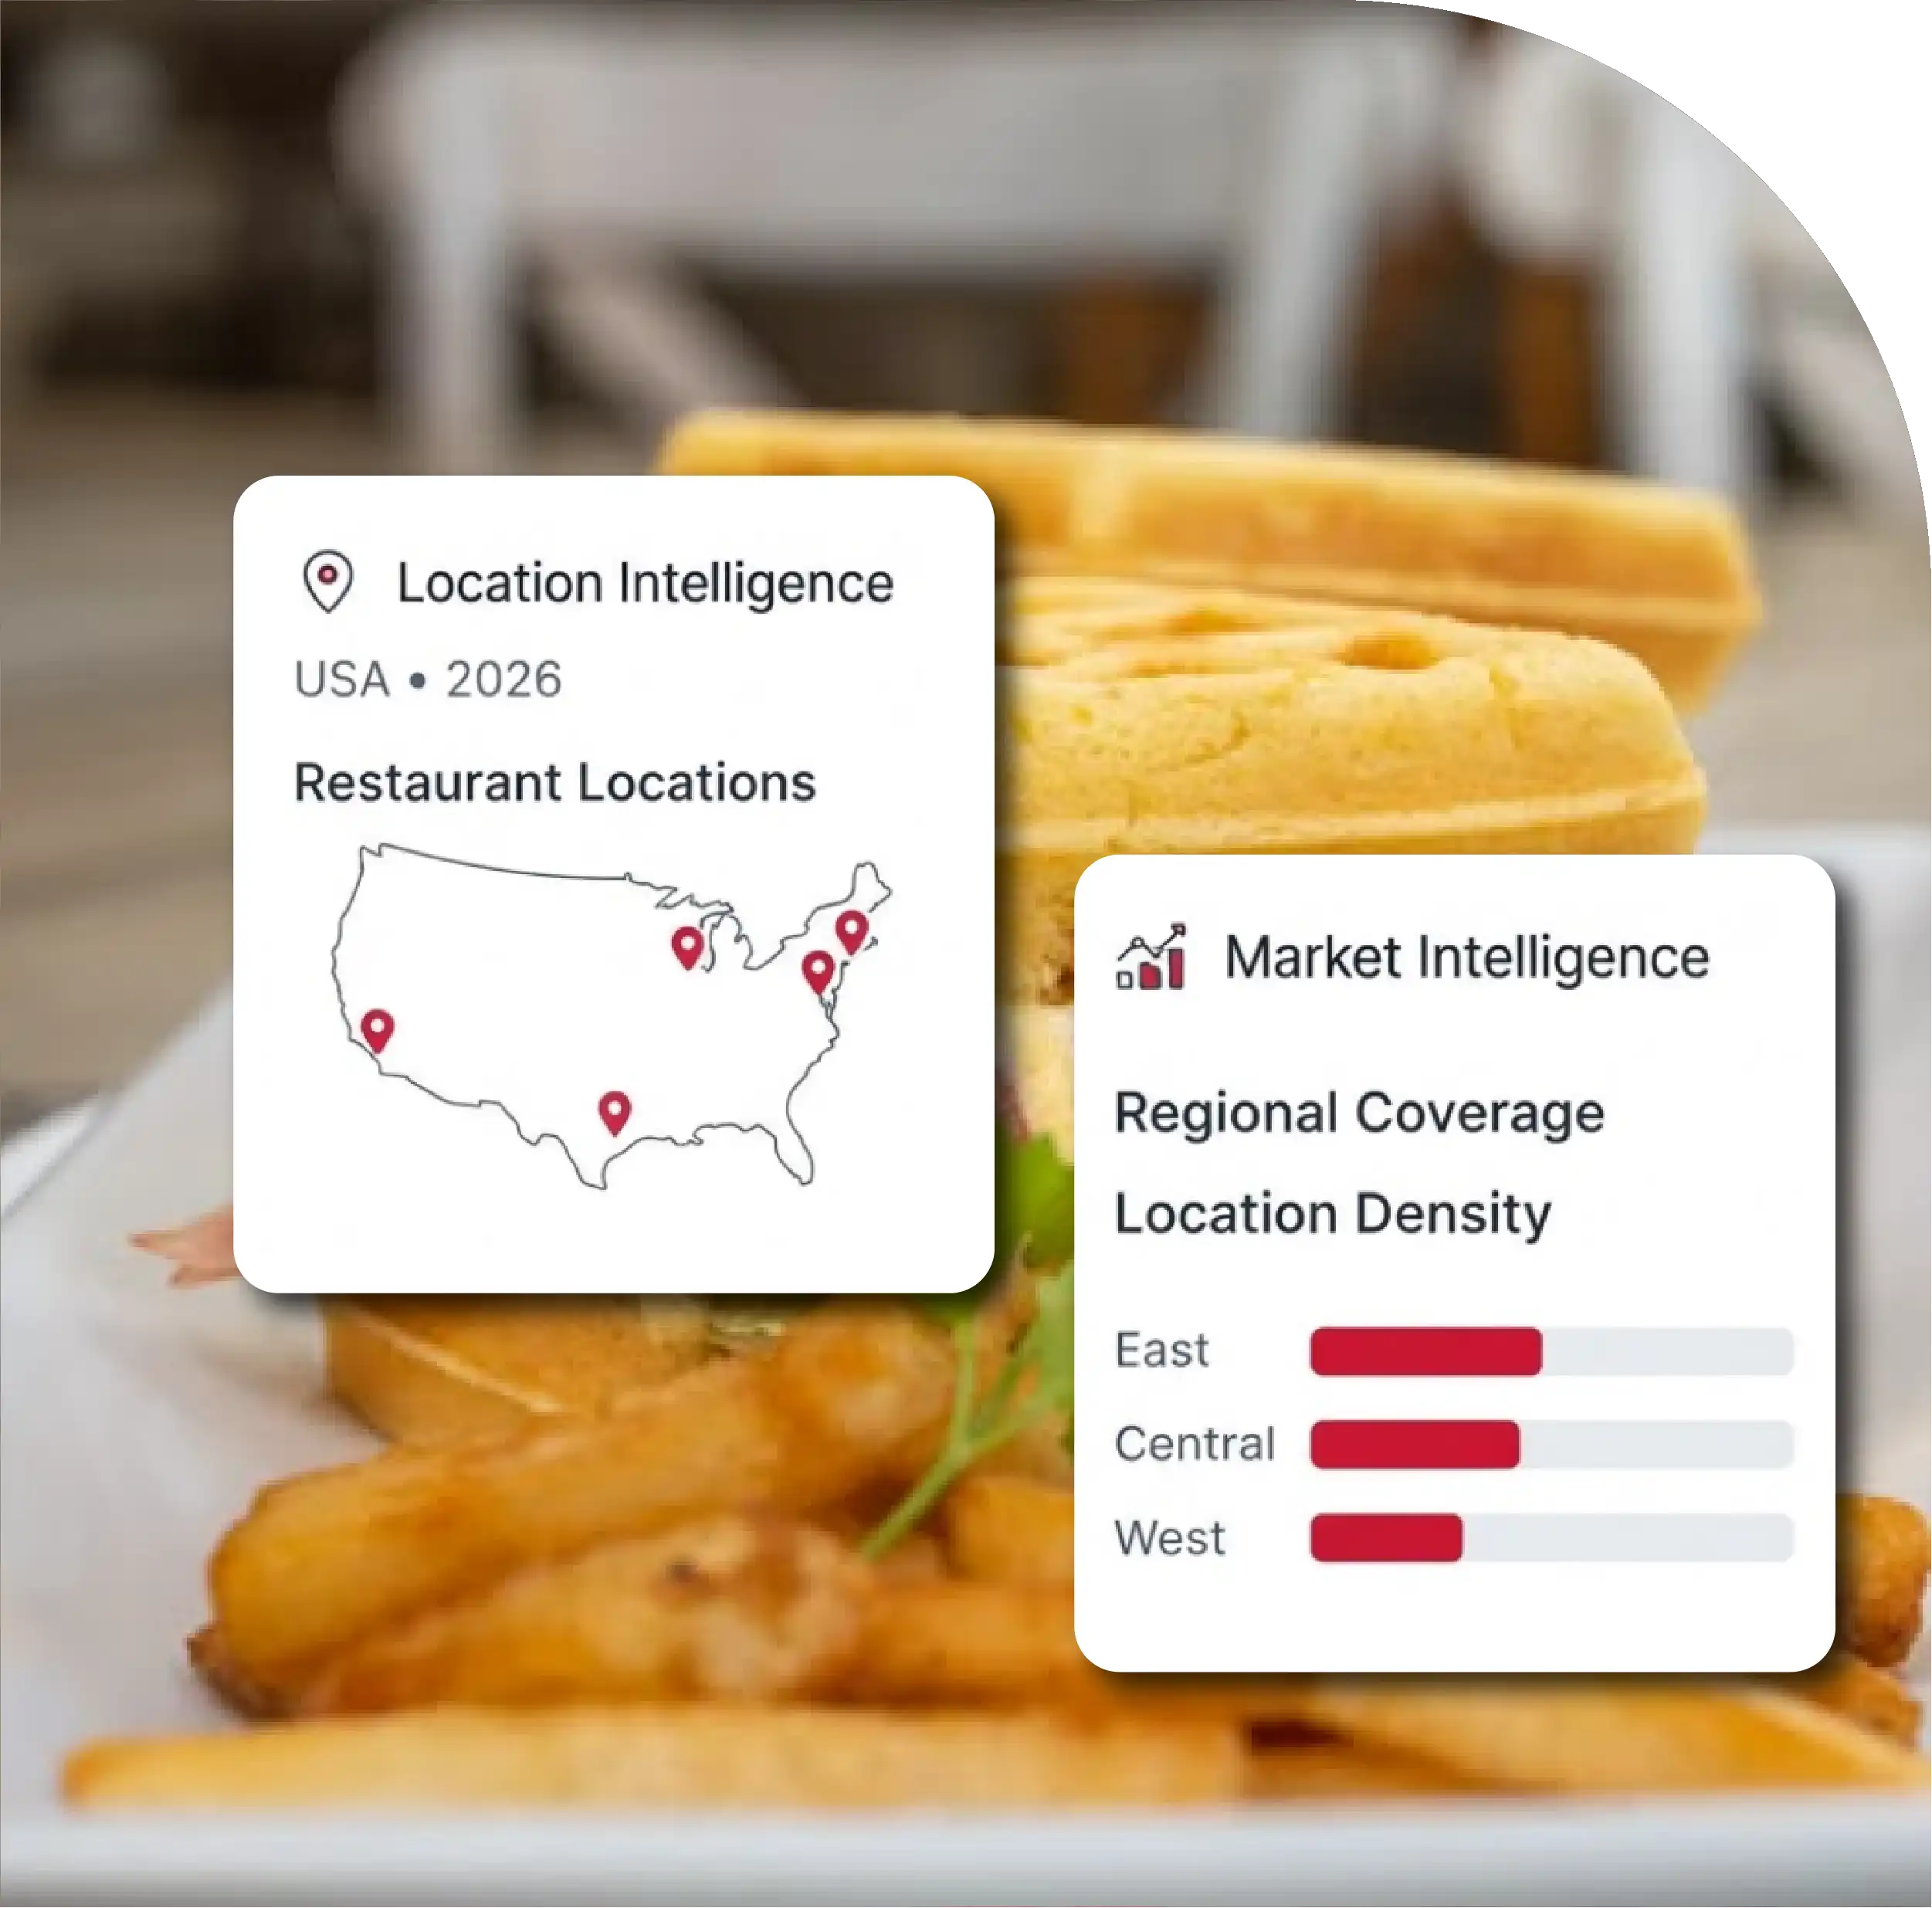
3,449 Chick-fil-A restaurants tracked across the United States.
Texas leads with 524 restaurants and 15% national share.
Houston ranks first with 54 Chick-fil-A restaurant locations.
4.38 average rating across more than 4.45 million reviews.
1,614 cities covered across 52 states and territories.

The U.S. quick-service restaurant market continues to expand through changing consumer preferences, geographic expansion, delivery adoption, and increasingly data-driven location planning. The latest dataset shows 3,449 Chick-fil-A restaurants across the United States as of August 19, 2026, covering 52 states and territories and 1,614 cities. The average location rating stands at 4.38 based on more than 4.45 million customer reviews, highlighting the brand's strong customer engagement and broad national footprint.
For businesses studying restaurant expansion, competitive positioning, consumer demand, and geographic coverage, Scrape Chick-fil-A US Restaurant Data 2026 to provide a structured view of thousands of restaurant locations, addresses, telephone numbers, geographic coordinates, ratings, and market distribution.
The dataset also demonstrates how Chick-Fil-A Restaurant Locations Data Scraping In USA can support restaurant mapping, market analysis, competitor benchmarking, territory planning, and location intelligence. With Texas accounting for 524 restaurants, approximately 15% of the national total, regional concentration becomes particularly valuable for understanding restaurant density and expansion opportunities.
Another important application is Chick-Fil-A US Restaurant Data Scraping, which can organize location-level information into databases suitable for geographic analysis, business intelligence dashboards, market research, and competitive benchmarking.
The 2026 dataset identifies 3,449 Chick-fil-A restaurants distributed across 1,614 cities. This creates an extensive location network that can be analyzed by state, city, population, geographic coordinates, and restaurant density.
Texas leads the United States with 524 restaurants, followed by Florida with 288 and Georgia with 276. California has 223 restaurants, while North Carolina has 203. These five markets alone represent a substantial portion of the company's national footprint.
| Rank | State | Restaurants | Share | Population | Population per Restaurant |
|---|---|---|---|---|---|
| 1 | Texas | 524 | 15% | 31.71M | 60.52K |
| 2 | Florida | 288 | 8% | 23.46M | 81.47K |
| 3 | Georgia | 276 | 8% | 11.30M | 40.95K |
| 4 | California | 223 | 6% | 39.35M | 176.48K |
| 5 | North Carolina | 203 | 6% | 11.20M | 55.16K |
| 6 | Virginia | 150 | 4% | 8.88M | 59.20K |
| 7 | Pennsylvania | 111 | 3% | 13.06M | 117.65K |
| 8 | Tennessee | 109 | 3% | 7.32M | 67.11K |
| 9 | South Carolina | 106 | 3% | 5.57M | 52.55K |
| 10 | Alabama | 103 | 3% | 5.19M | 50.42K |
The population-per-restaurant metric reveals important differences between markets. Georgia has approximately one restaurant for every 40,953 residents, while California has approximately one for every 176,480 residents. Such differences can help analysts identify markets with relatively high or low restaurant penetration.
Chick-fil-A Restaurant Market Intelligence can transform raw location records into meaningful insights about geographic concentration, competitive density, consumer accessibility, and expansion patterns.
Houston is the leading city with 54 locations, followed by San Antonio with 35 and Atlanta with 34. Charlotte has 26 locations, Dallas has 25, and Orlando has 24. This concentration demonstrates how major metropolitan areas contribute significantly to the restaurant network.
| City | State | Locations | Market Observation |
|---|---|---|---|
| Houston | Texas | 54 | Highest city concentration |
| San Antonio | Texas | 35 | Strong Texas presence |
| Atlanta | Georgia | 34 | Major Southeast market |
| Charlotte | North Carolina | 26 | High regional density |
| Dallas | Texas | 25 | Major metropolitan coverage |
| Orlando | Florida | 24 | Strong tourism-market presence |
| Fort Worth | Texas | 19 | Expanding urban footprint |
| Jacksonville | Florida | 18 | Significant Florida coverage |
| New York | New York | 17 | Large metropolitan market |
| Chicago | Illinois | 16 | Major Midwest presence |
Location datasets can therefore be used to compare urban clusters, identify underserved areas, evaluate market saturation, and monitor changes in restaurant footprints over time.
Customer reviews provide another dimension to restaurant research. The supplied dataset records an average rating of 4.38 from more than 4.45 million reviews. Approximately 87.87% of customer feedback is categorized as high satisfaction, while 7.07% is classified as poor feedback.
The highest-rated locations include a Joplin, Missouri restaurant with a 4.8 rating from 3,694 reviews. Several restaurants in Tampa, Indianapolis, Orlando, and Toledo record ratings of 4.7.
At the other end of the dataset, locations in Riverview, Tampa, Atlanta, Washington, and Marietta show comparatively lower ratings. These differences demonstrate how location-level review data can reveal operational variation even within the same restaurant brand.
For analysts, combining restaurant locations with review metrics enables location benchmarking based on ratings, review volume, satisfaction levels, and geographic distribution.
Modern restaurant research increasingly extends beyond physical locations. Delivery platforms contain valuable information about menu availability, pricing, item descriptions, promotions, delivery fees, and customer-facing restaurant information.
Chick fil A Food Delivery App Data Scraping can help researchers structure information from digital ordering environments and compare how restaurant offerings appear across delivery channels.
Menu datasets can capture item names, categories, prices, descriptions, nutritional information, modifiers, promotional offers, and availability. This information can then be used for pricing research, assortment comparisons, menu optimization, and consumer trend analysis.
Extract Chick-fil-A Restaurant Count Data to support periodic monitoring of the restaurant network. By comparing historical datasets, analysts can measure new openings, location changes, geographic expansion, and market concentration.
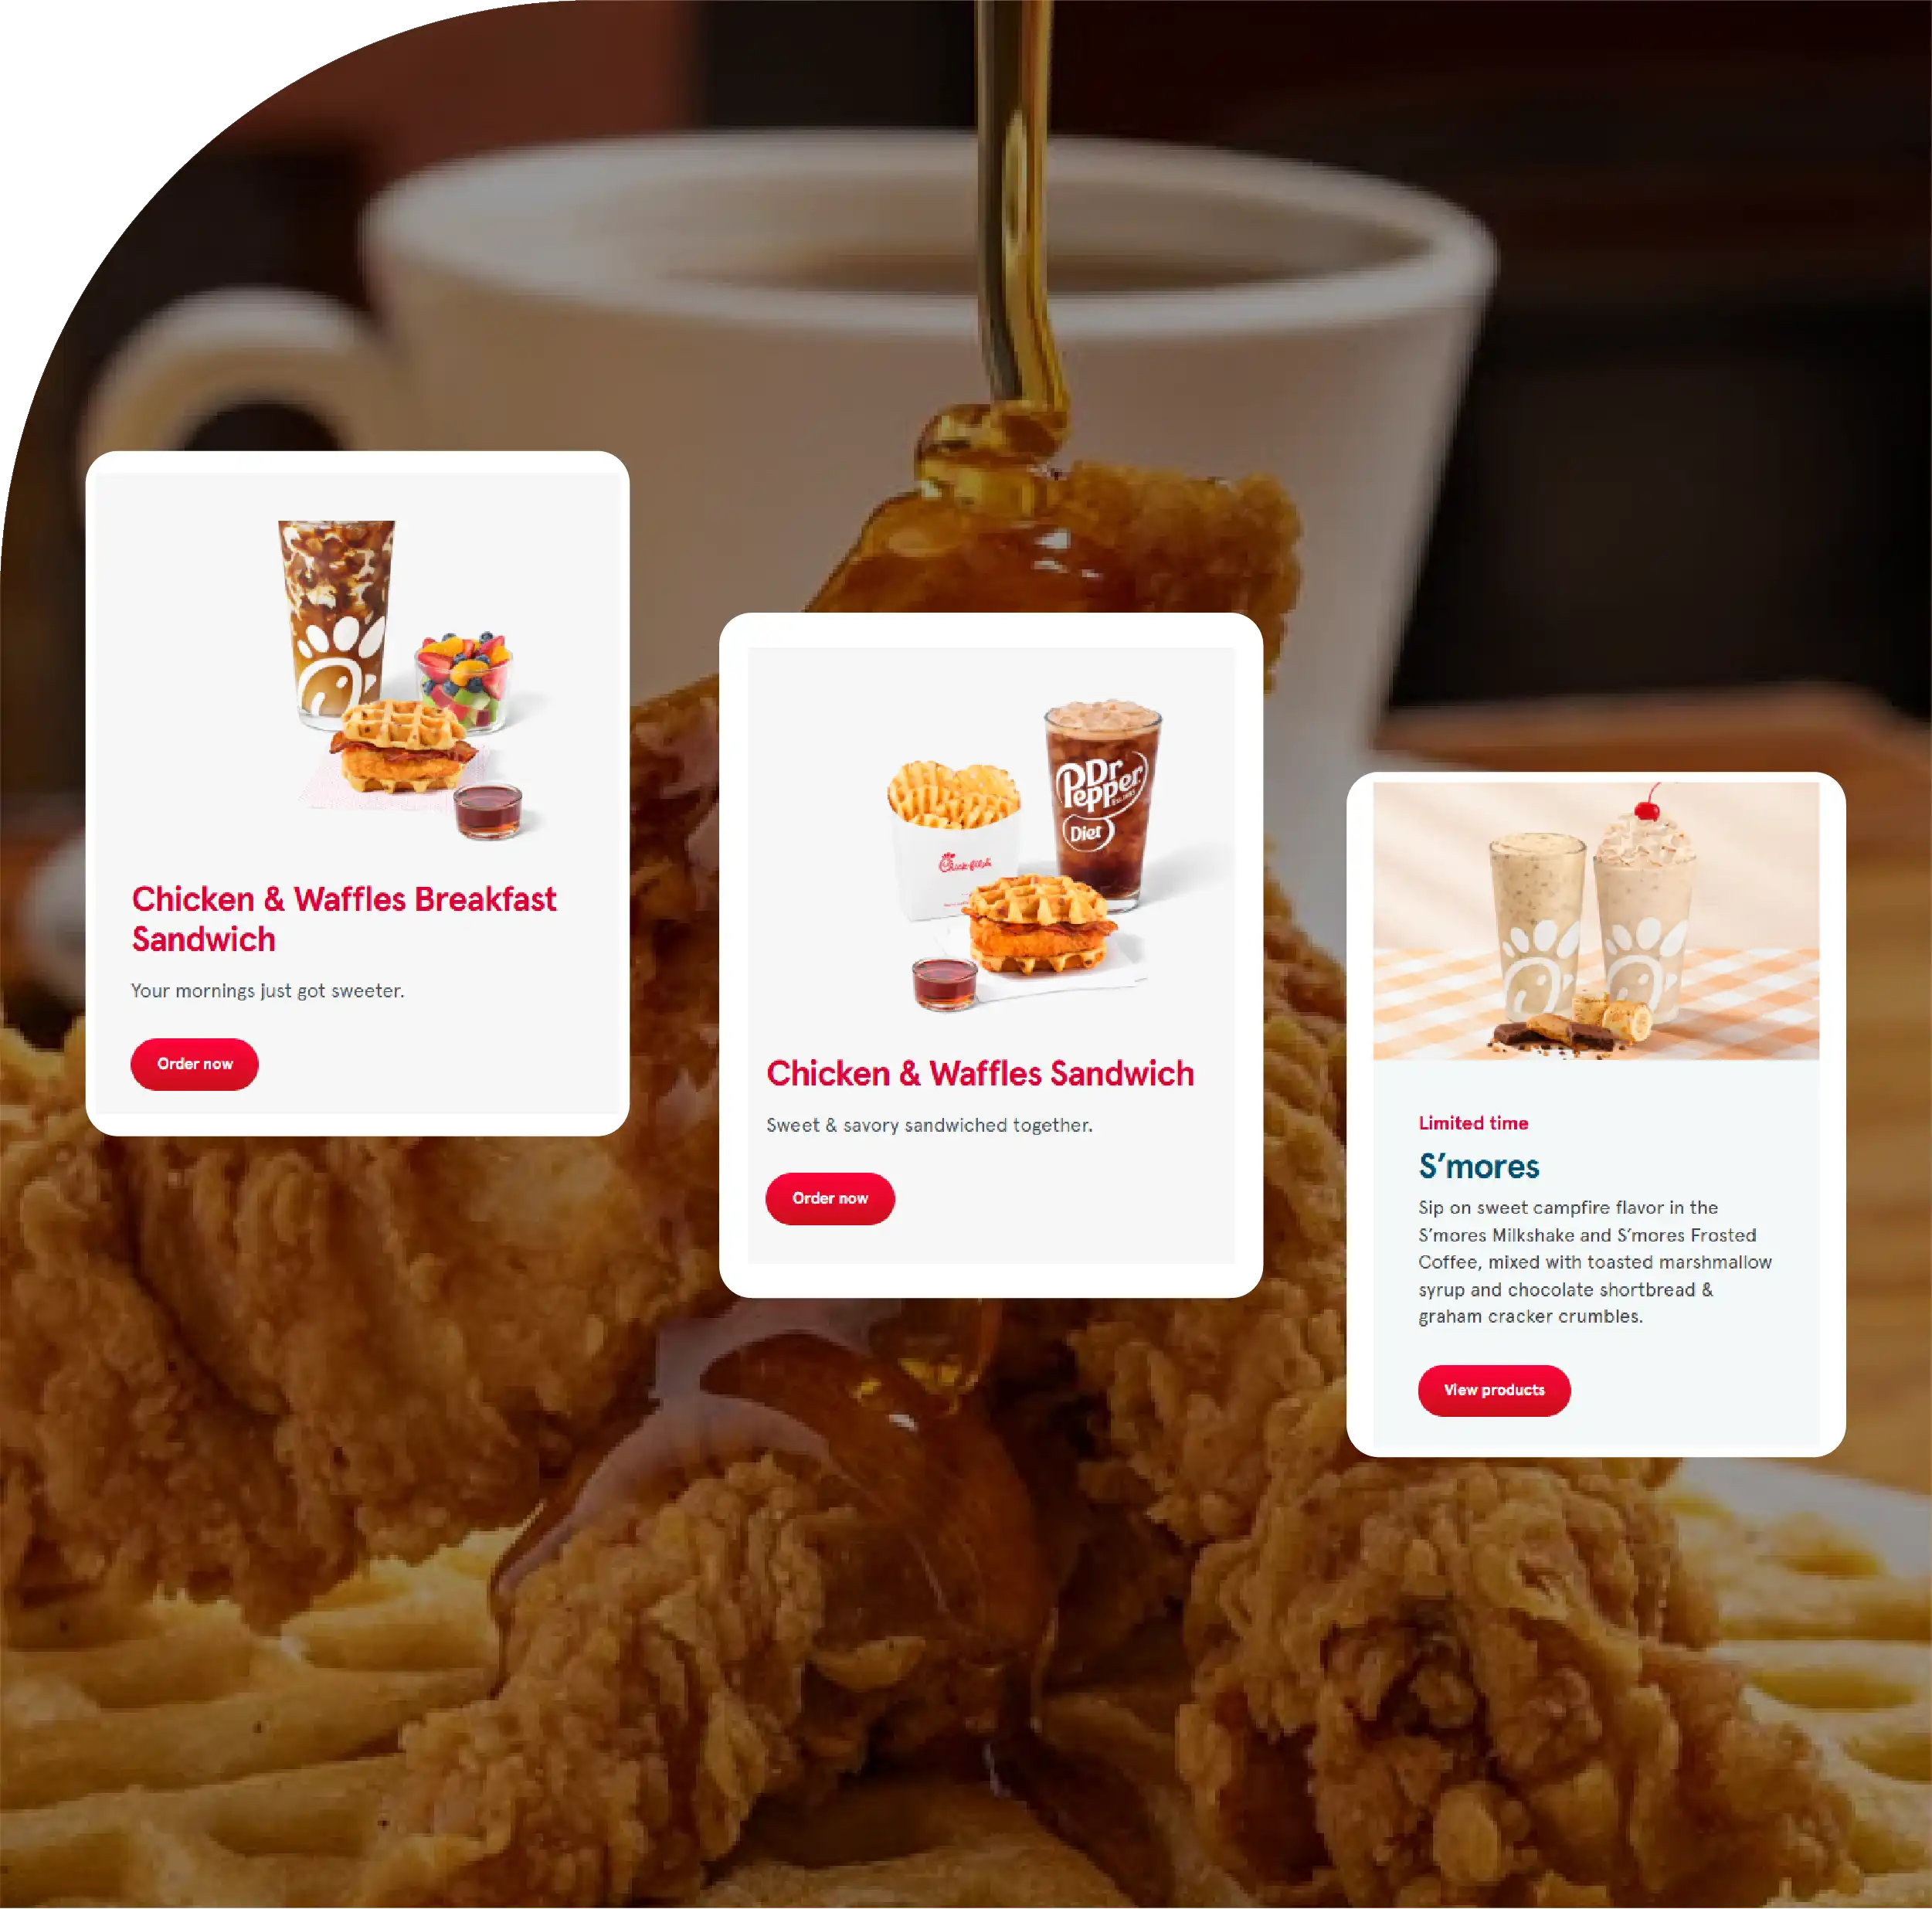
Restaurant menus provide a deeper understanding of the products driving customer demand. Chick fil A Restaurant Menu Data Collection can organize menu information into structured datasets covering categories such as sandwiches, breakfast products, beverages, sides, desserts, sauces, and other offerings.
When collected consistently, menu records can help researchers track price movements, product additions, discontinued products, promotional items, and differences between markets.
Digital ordering has made menu information particularly valuable because customers increasingly interact with restaurant brands through mobile applications and delivery platforms rather than only through physical storefronts.
Chick fil A Food Delivery Scraping API can support automated access to structured restaurant and menu information for applications requiring regularly refreshed datasets, dashboards, and analytical systems.
Restaurant pricing intelligence has become increasingly important as food costs, labor expenses, delivery fees, and consumer price sensitivity evolve. Restaurant Menu Data Scraping can help businesses monitor menu prices and product availability across locations and digital ordering channels.
For example, analysts can compare the prices of similar menu categories across cities, examine regional price differences, identify promotional patterns, and evaluate changes over time.
Location and menu datasets become significantly more useful when combined. A restaurant record can contain geographic information, while a menu record can contain product-level information. Together, these datasets create a comprehensive restaurant intelligence layer.
Despite the broad national footprint, six states and territories in the supplied dataset have no Chick-fil-A restaurants: U.S. Virgin Islands, Northern Mariana Islands, Alaska, Vermont, American Samoa, and Guam.
This geographic gap is particularly useful for market researchers because absence can be as informative as presence. Analysts can investigate population characteristics, logistics, market conditions, regional demand, and expansion constraints when evaluating uncovered territories.
The remaining 52 states and territories demonstrate the brand's extensive U.S. reach, with significant concentrations across the South, Southeast, Southwest, Midwest, and selected metropolitan markets.
A comprehensive restaurant dataset can contain considerably more information than a simple list of names. The supplied sample demonstrates fields including restaurant name, street address, city, state, ZIP code, telephone number, latitude, longitude, complete address, country, and last updated date.
These fields support geographic visualization, proximity analysis, territory mapping, demographic comparisons, and location monitoring.
A structured database can also be exported into Excel or other analytical formats, enabling researchers and businesses to filter locations by state, city, ZIP code, coordinates, or update date.
The inclusion of latitude and longitude is particularly valuable for mapping applications. Businesses can calculate distances between locations, identify geographic clusters, examine market coverage, and connect restaurant records with demographic or commercial datasets.
Restaurant data is moving toward integrated intelligence rather than isolated datasets. Physical locations, menu information, customer reviews, delivery availability, pricing, promotions, and geographic characteristics can be combined into unified analytical environments.
This approach enables businesses to study where restaurants operate, what they sell, how products are priced, how customers respond, and how market coverage changes over time.
For researchers and data-driven businesses, the 2026 Chick-fil-A dataset provides a strong foundation for studying one of the largest restaurant networks in the United States. With 3,449 locations, 1,614 cities, 52 states and territories represented, and millions of customer reviews, the dataset offers multiple dimensions for location and market analysis.
The 2026 Chick-fil-A restaurant landscape demonstrates the value of structured location, menu, review, and delivery intelligence. Texas remains the dominant state with 524 restaurants, while Houston leads individual cities with 54 locations. At the same time, customer ratings provide another layer for comparing operational performance across individual restaurants.
AI Restaurant Intelligence can take these datasets further by combining location patterns, pricing information, menu changes, customer sentiment, and market trends into predictive analytical models.
Businesses looking to develop recurring restaurant datasets can use Food Data Scraping Services to build structured information covering locations, menus, prices, reviews, delivery platforms, and competitive restaurant markets.
As restaurant competition becomes increasingly data-driven, Food Data Scraping in the USA can support market intelligence programs that monitor restaurant expansion, menu pricing, digital ordering activity, customer feedback, and regional opportunities. The Chick-fil-A 2026 dataset illustrates how detailed restaurant information can become a valuable foundation for research, benchmarking, business intelligence, and long-term market monitoring.
If you are seeking for a reliable data scraping services, Food Data Scrape is at your service. We hold prominence in Food Data Aggregator and Mobile Restaurant App Scraping with impeccable data analysis for strategic decision-making.