
The Client
Our client is a leading retail analytics and consumer insights company serving grocery brands, supermarkets, and market research firms. They required a scalable solution to monitor product size reductions, packaging changes, and pricing variations across multiple retail chains while maintaining historical accuracy. Their objective was to strengthen Grocery SKU-Level Shrinkflation Data Monitoring by identifying hidden quantity changes that could impact pricing strategies and consumer trust.
Through comprehensive Shrinkflation Data Intelligence, the client gained access to structured datasets covering product dimensions, weights, promotional activity, and unit pricing. These insights enabled faster detection of shrinkflation trends and improved competitive benchmarking.
By leveraging advanced Grocery Market Intelligence, the client enhanced category analysis, supported strategic pricing decisions, tracked competitor movements, and delivered reliable market reports. The solution reduced manual effort, improved data consistency, and empowered stakeholders with timely insights for smarter retail planning and business growth.
Key Challenges
-
Inconsistent Product Size Monitoring
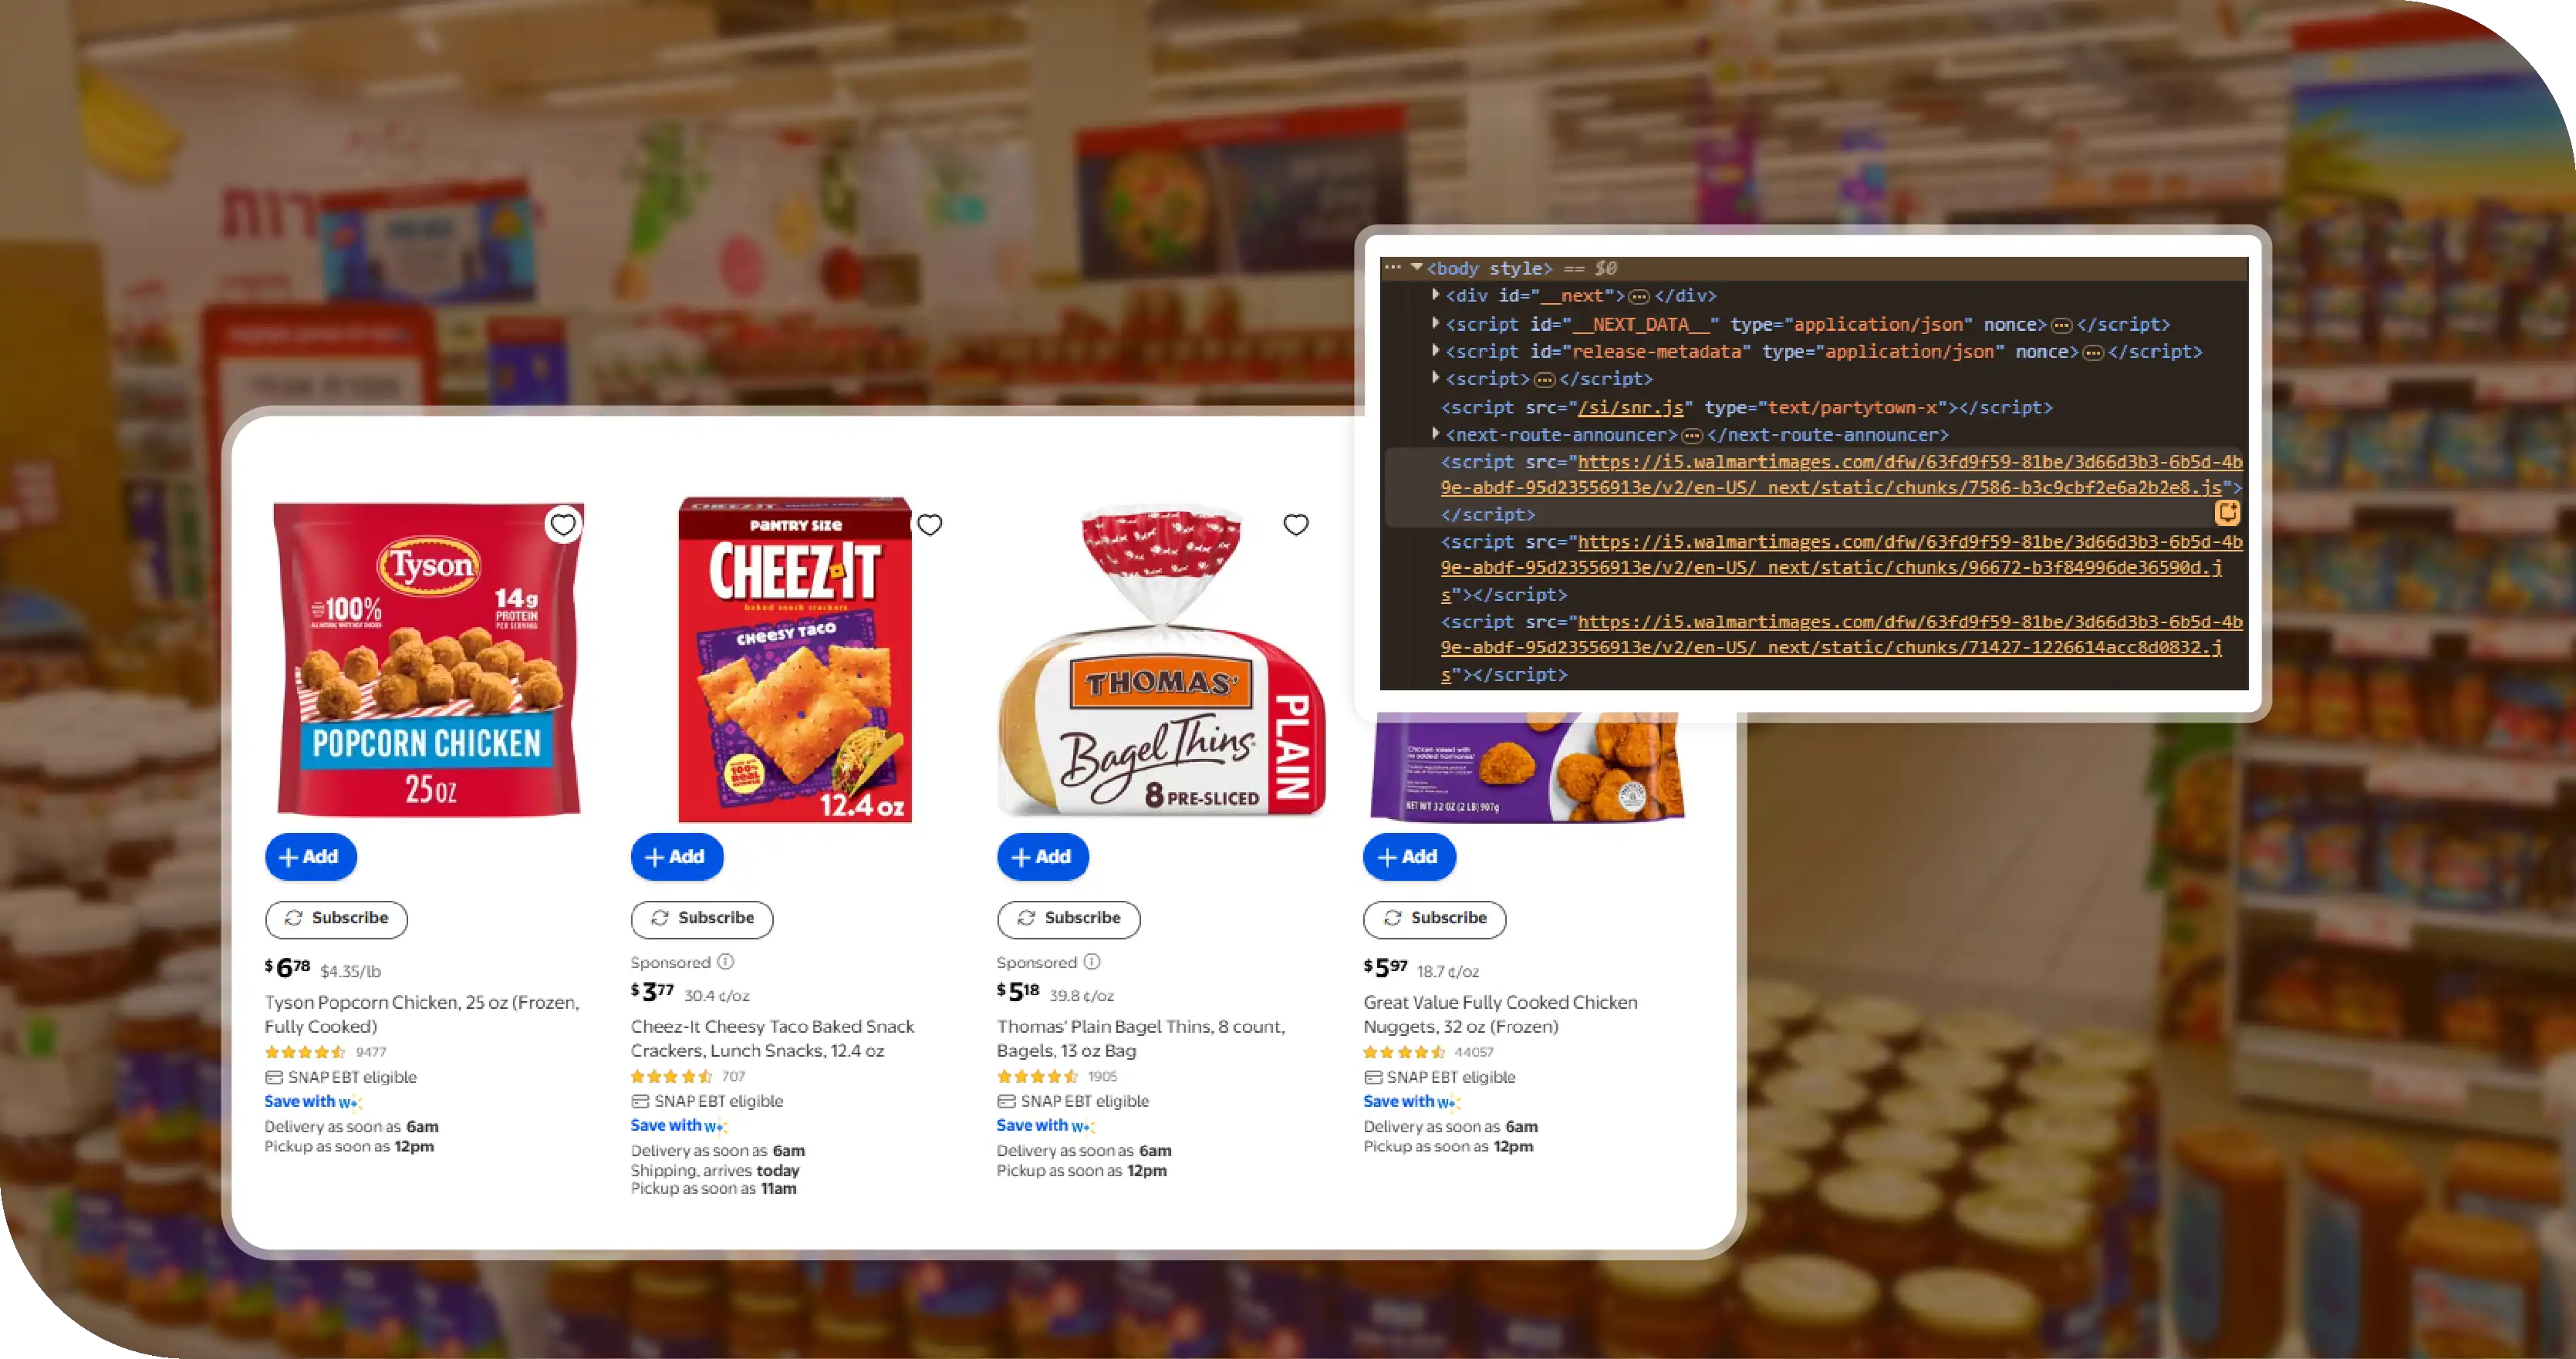
The client struggled to identify subtle packaging and quantity reductions across multiple grocery retailers because product information changed frequently. Without reliable Retail Shrinkflation Analytics, comparing historical SKU data and detecting hidden shrinkflation trends became highly time-consuming and inaccurate. -
Limited Historical Change Tracking
Maintaining accurate records of product weight, volume, and pricing over time proved difficult. Manual Shrinkflation Data Tracking failed to capture continuous updates, resulting in incomplete datasets that limited competitive analysis, trend forecasting, and reliable reporting for stakeholders. -
Complex Multi-Retail Data Collection
Gathering standardized product information from numerous grocery chains was challenging due to varying website structures, frequent updates, and inconsistent formats. Efficient Web Scraping Grocery Data was essential to automate collection, normalize records, reduce manual effort, and ensure comprehensive market visibility.
Key Solutions
-
Automated Multi-Retail Data Collection
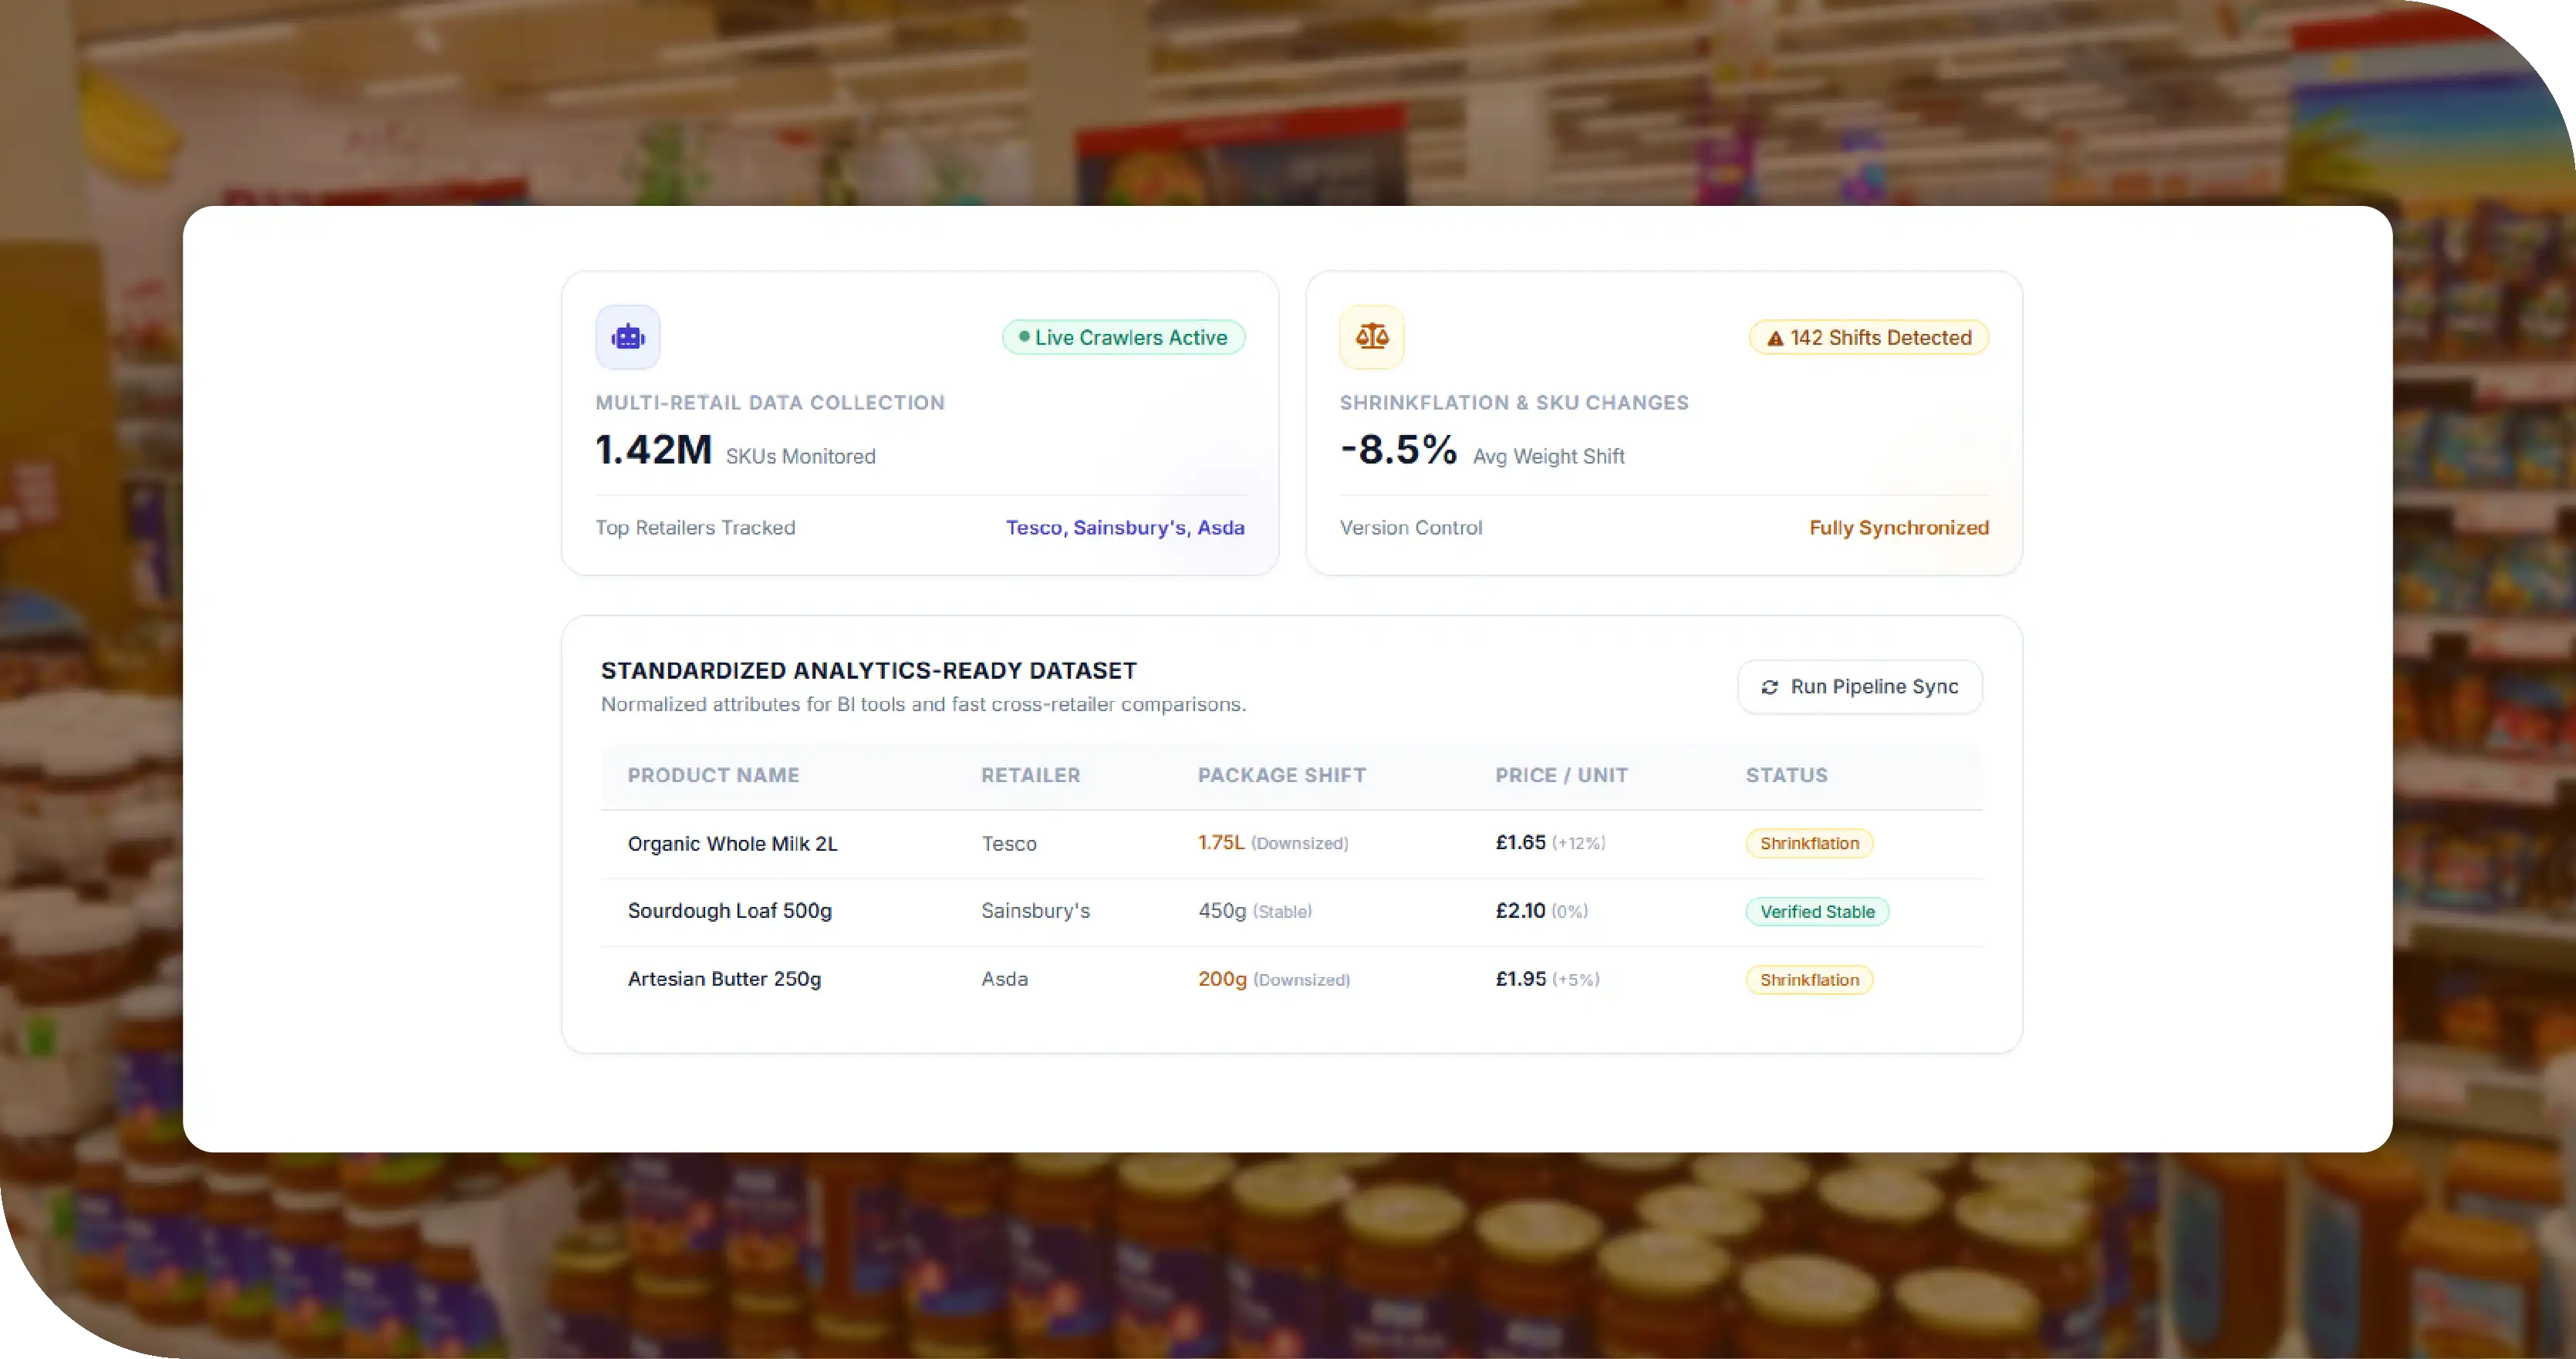
We deployed automated crawlers to collect product names, package sizes, weights, prices, promotions, and historical updates from leading grocery retailers. The data powered a centralized Grocery Price Dashboard, enabling continuous monitoring of shrinkflation trends and competitor pricing without manual intervention. -
Historical SKU Change Detection
Our solution maintained version-controlled product records, allowing the client to compare previous and current package sizes, quantities, and unit prices. Enhanced Grocery Data Intelligence revealed hidden shrinkflation events, pricing shifts, and product modifications through accurate historical analysis across retail chains. -
Standardized Analytics-Ready Dataset
We transformed raw retailer information into structured Grocery Datasets with normalized attributes for seamless integration into BI tools and analytics platforms. This improved reporting accuracy, simplified cross-retailer comparisons, and enabled faster business decisions through clean, reliable, and continuously updated product data.
Sample Scraped Grocery Shrinkflation Data
| Retail Chain | Brand | Product | Previous Size | Current Size | Previous Price | Current Price | Unit Price | Shrinkflation Status |
|---|---|---|---|---|---|---|---|---|
| Walmart | Kellogg's | Corn Flakes | 750g | 680g | $5.29 | $5.49 | $0.81/100g | Detected |
| Kroger | Lay's | Classic Potato Chips | 200g | 180g | $3.79 | $3.99 | $2.22/100g | Detected |
| Target | Tide | Liquid Laundry Detergent | 2L | 1.8L | $8.79 | $8.99 | $5.00/L | Detected |
| Costco | Folgers | Ground Coffee | 500g | 450g | $8.99 | $9.49 | $2.11/100g | Detected |
| Safeway | Barilla | Spaghetti Pasta | 1kg | 900g | $2.89 | $2.99 | $0.33/100g | Detected |
| Albertsons | Skippy | Peanut Butter | 500g | 450g | $4.29 | $4.49 | $1.00/100g | Detected |
| Publix | Heinz | Tomato Ketchup | 1L | 900ml | $3.99 | $4.19 | $0.47/100ml | Detected |
| Whole Foods Market | Quaker | Oats | 1kg | 900g | $5.99 | $6.29 | $0.70/100g | Detected |
| Tesco | Cadbury | Dairy Milk Chocolate | 200g | 180g | £2.75 | £2.95 | £1.64/100g | Detected |
| Carrefour | Nutella | Hazelnut Spread | 750g | 700g | €5.49 | €5.69 | €0.81/100g | Detected |
| Aldi | Nature Valley | Granola Bars | 300g | 270g | $3.49 | $3.69 | $1.37/100g | Detected |
| Lidl | Coca-Cola | Soft Drink Multipack | 12 x 330ml | 10 x 330ml | £5.99 | £5.99 | £0.18/100ml | Detected |
Methodologies Used
-
Cross-Retail SKU Matching
We built intelligent matching logic to identify identical products sold across different grocery chains despite variations in naming conventions, descriptions, or packaging. This ensured accurate comparisons and prevented duplicate records from affecting analytical outcomes and reporting accuracy. -
Packaging Change Detection
Our system continuously monitored packaging dimensions, net weight, volume, serving size, and count. Even minor modifications were automatically identified, allowing the client to recognize concealed quantity reductions without relying on manual product inspections or customer feedback. -
Continuous Monitoring Pipeline
Rather than periodic data collection, we implemented an always-on monitoring process that tracked product updates throughout the day. This enabled rapid identification of pricing, packaging, and assortment changes as soon as retailers published new information. -
Change Event Classification
Every detected modification was categorized based on its nature, including quantity reduction, package redesign, price increase, promotional adjustment, or product replacement. This structured classification simplified reporting and helped analysts focus on meaningful retail changes. -
Enterprise Data Integration
The processed information was seamlessly integrated into existing reporting systems, analytics platforms, and cloud storage environments. Automated exports, scheduled synchronization, and standardized schemas ensured business teams could immediately utilize the data for operational and strategic analysis.
Advantages of Collecting Data Using Food Data Scrape
-
Comprehensive Market Visibility
Our solution captures product information across multiple retailers simultaneously, providing a unified view of market activity. Businesses gain broader competitive coverage, faster access to critical updates, and deeper insights without investing significant time in manual research. -
Reliable Historical Archives
Every product update is securely stored, creating a complete historical timeline of pricing, packaging, promotions, and assortment changes. This archive enables long-term trend analysis, supports forecasting, and provides valuable evidence for strategic planning and business decisions. -
Highly Customizable Data Delivery
We tailor data formats, update frequencies, and output structures to match your operational needs. Whether integrating with dashboards, cloud platforms, APIs, or internal databases, our flexible delivery ensures seamless adoption into existing business workflows. -
Rapid Scalability Across Markets
Our infrastructure efficiently scales from a handful of retailers to thousands of product categories across multiple countries. This allows organizations to expand monitoring capabilities without compromising data quality, collection speed, or operational performance. -
Actionable Business Insights
Beyond collecting information, we transform raw data into structured intelligence that highlights meaningful market changes. Businesses can quickly identify opportunities, respond to competitor actions, optimize strategies, and make faster, data-driven decisions with confidence.
Client's Testimonial
"Working with this team has significantly improved our ability to monitor product changes across multiple grocery retailers. Their automated data collection solution delivers highly accurate, well-structured datasets that save us countless hours of manual effort. The historical tracking capabilities and timely updates have strengthened our competitive analysis and reporting processes. We now identify packaging, pricing, and assortment changes much faster, enabling informed business decisions with confidence. Their technical expertise, responsive support, and commitment to data quality have made them a trusted technology partner. We highly recommend their services to organizations seeking dependable retail data intelligence solutions."
—Head of Retail Market Intelligence
Final Outcome
The successful implementation of our grocery data collection solution provided the client with complete visibility into product size, pricing, packaging, and assortment changes across multiple retail chains. Automated monitoring replaced time-consuming manual research, delivering accurate, structured, and continuously updated datasets. Historical records enabled reliable identification of quantity reductions and long-term market trends, while standardized data improved cross-retailer comparisons and reporting consistency. The client accelerated competitive analysis, strengthened pricing strategies, and enhanced market intelligence with timely insights. Integration with business intelligence platforms streamlined decision-making and reduced operational overhead. As a result, the organization improved reporting accuracy, identified shrinkflation events more efficiently, responded quickly to evolving retail strategies, and gained a scalable data infrastructure that supports ongoing market monitoring and informed strategic planning.



