

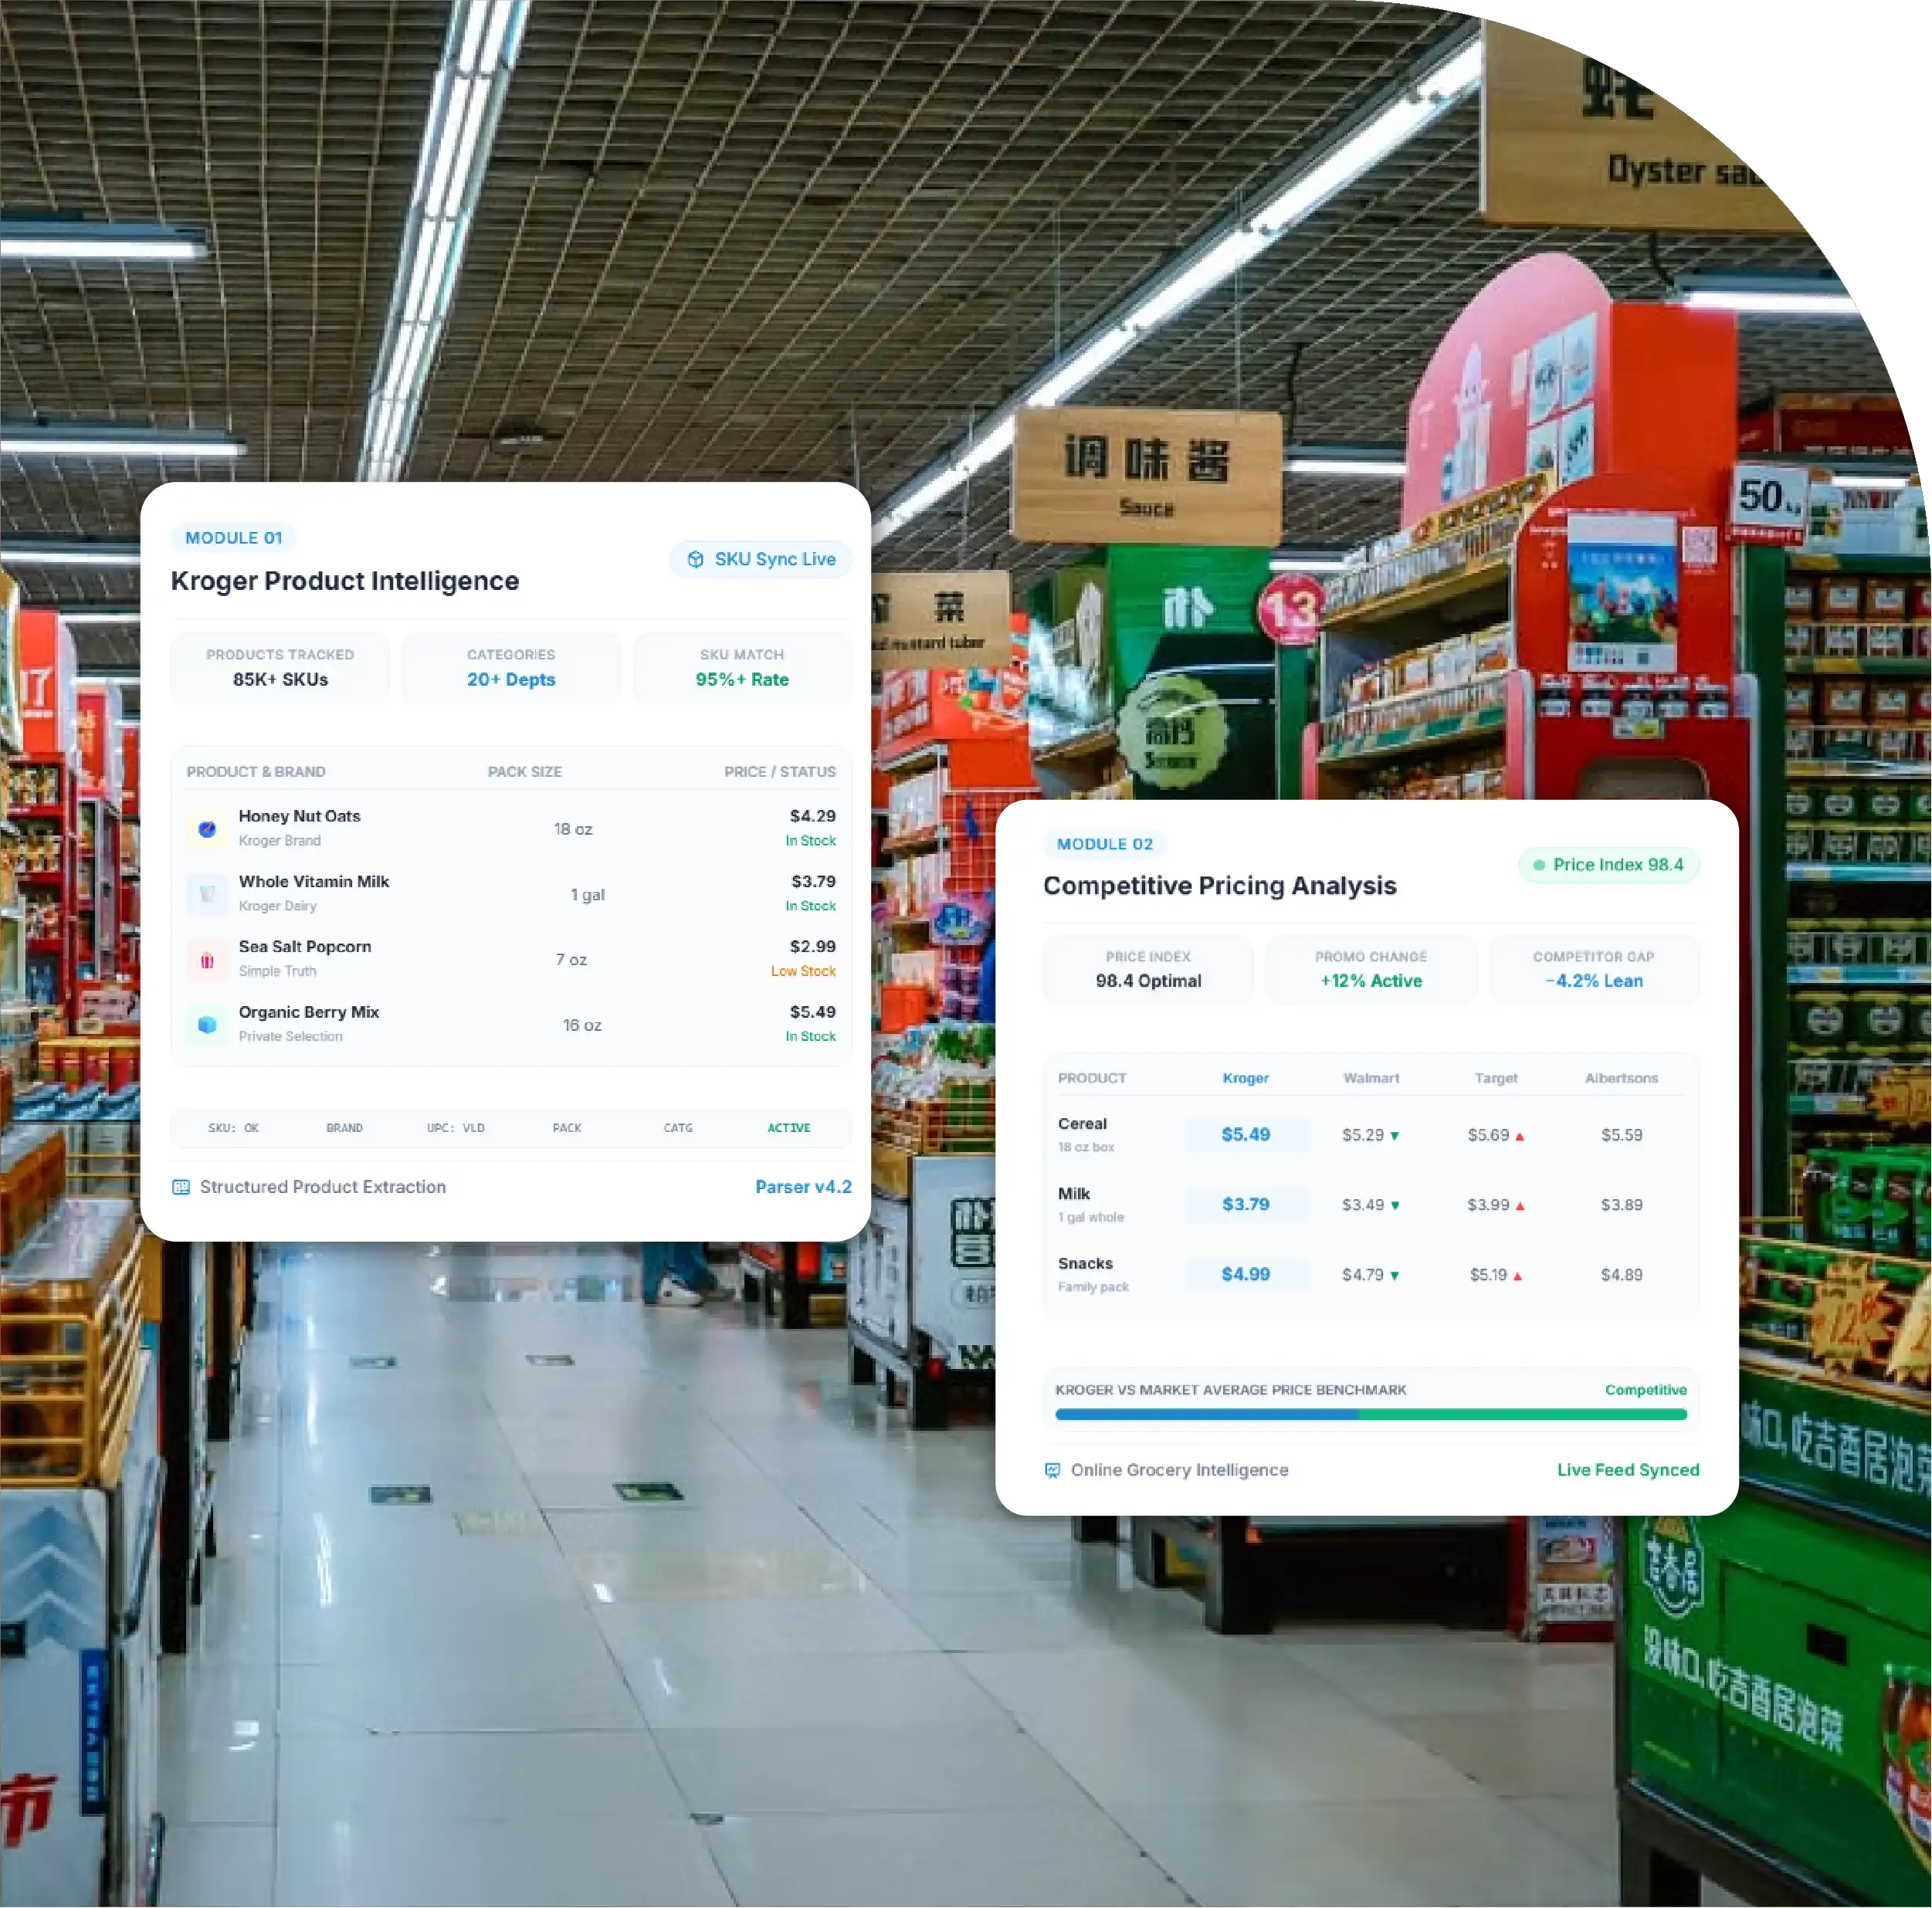
Comprehensive Product Intelligence
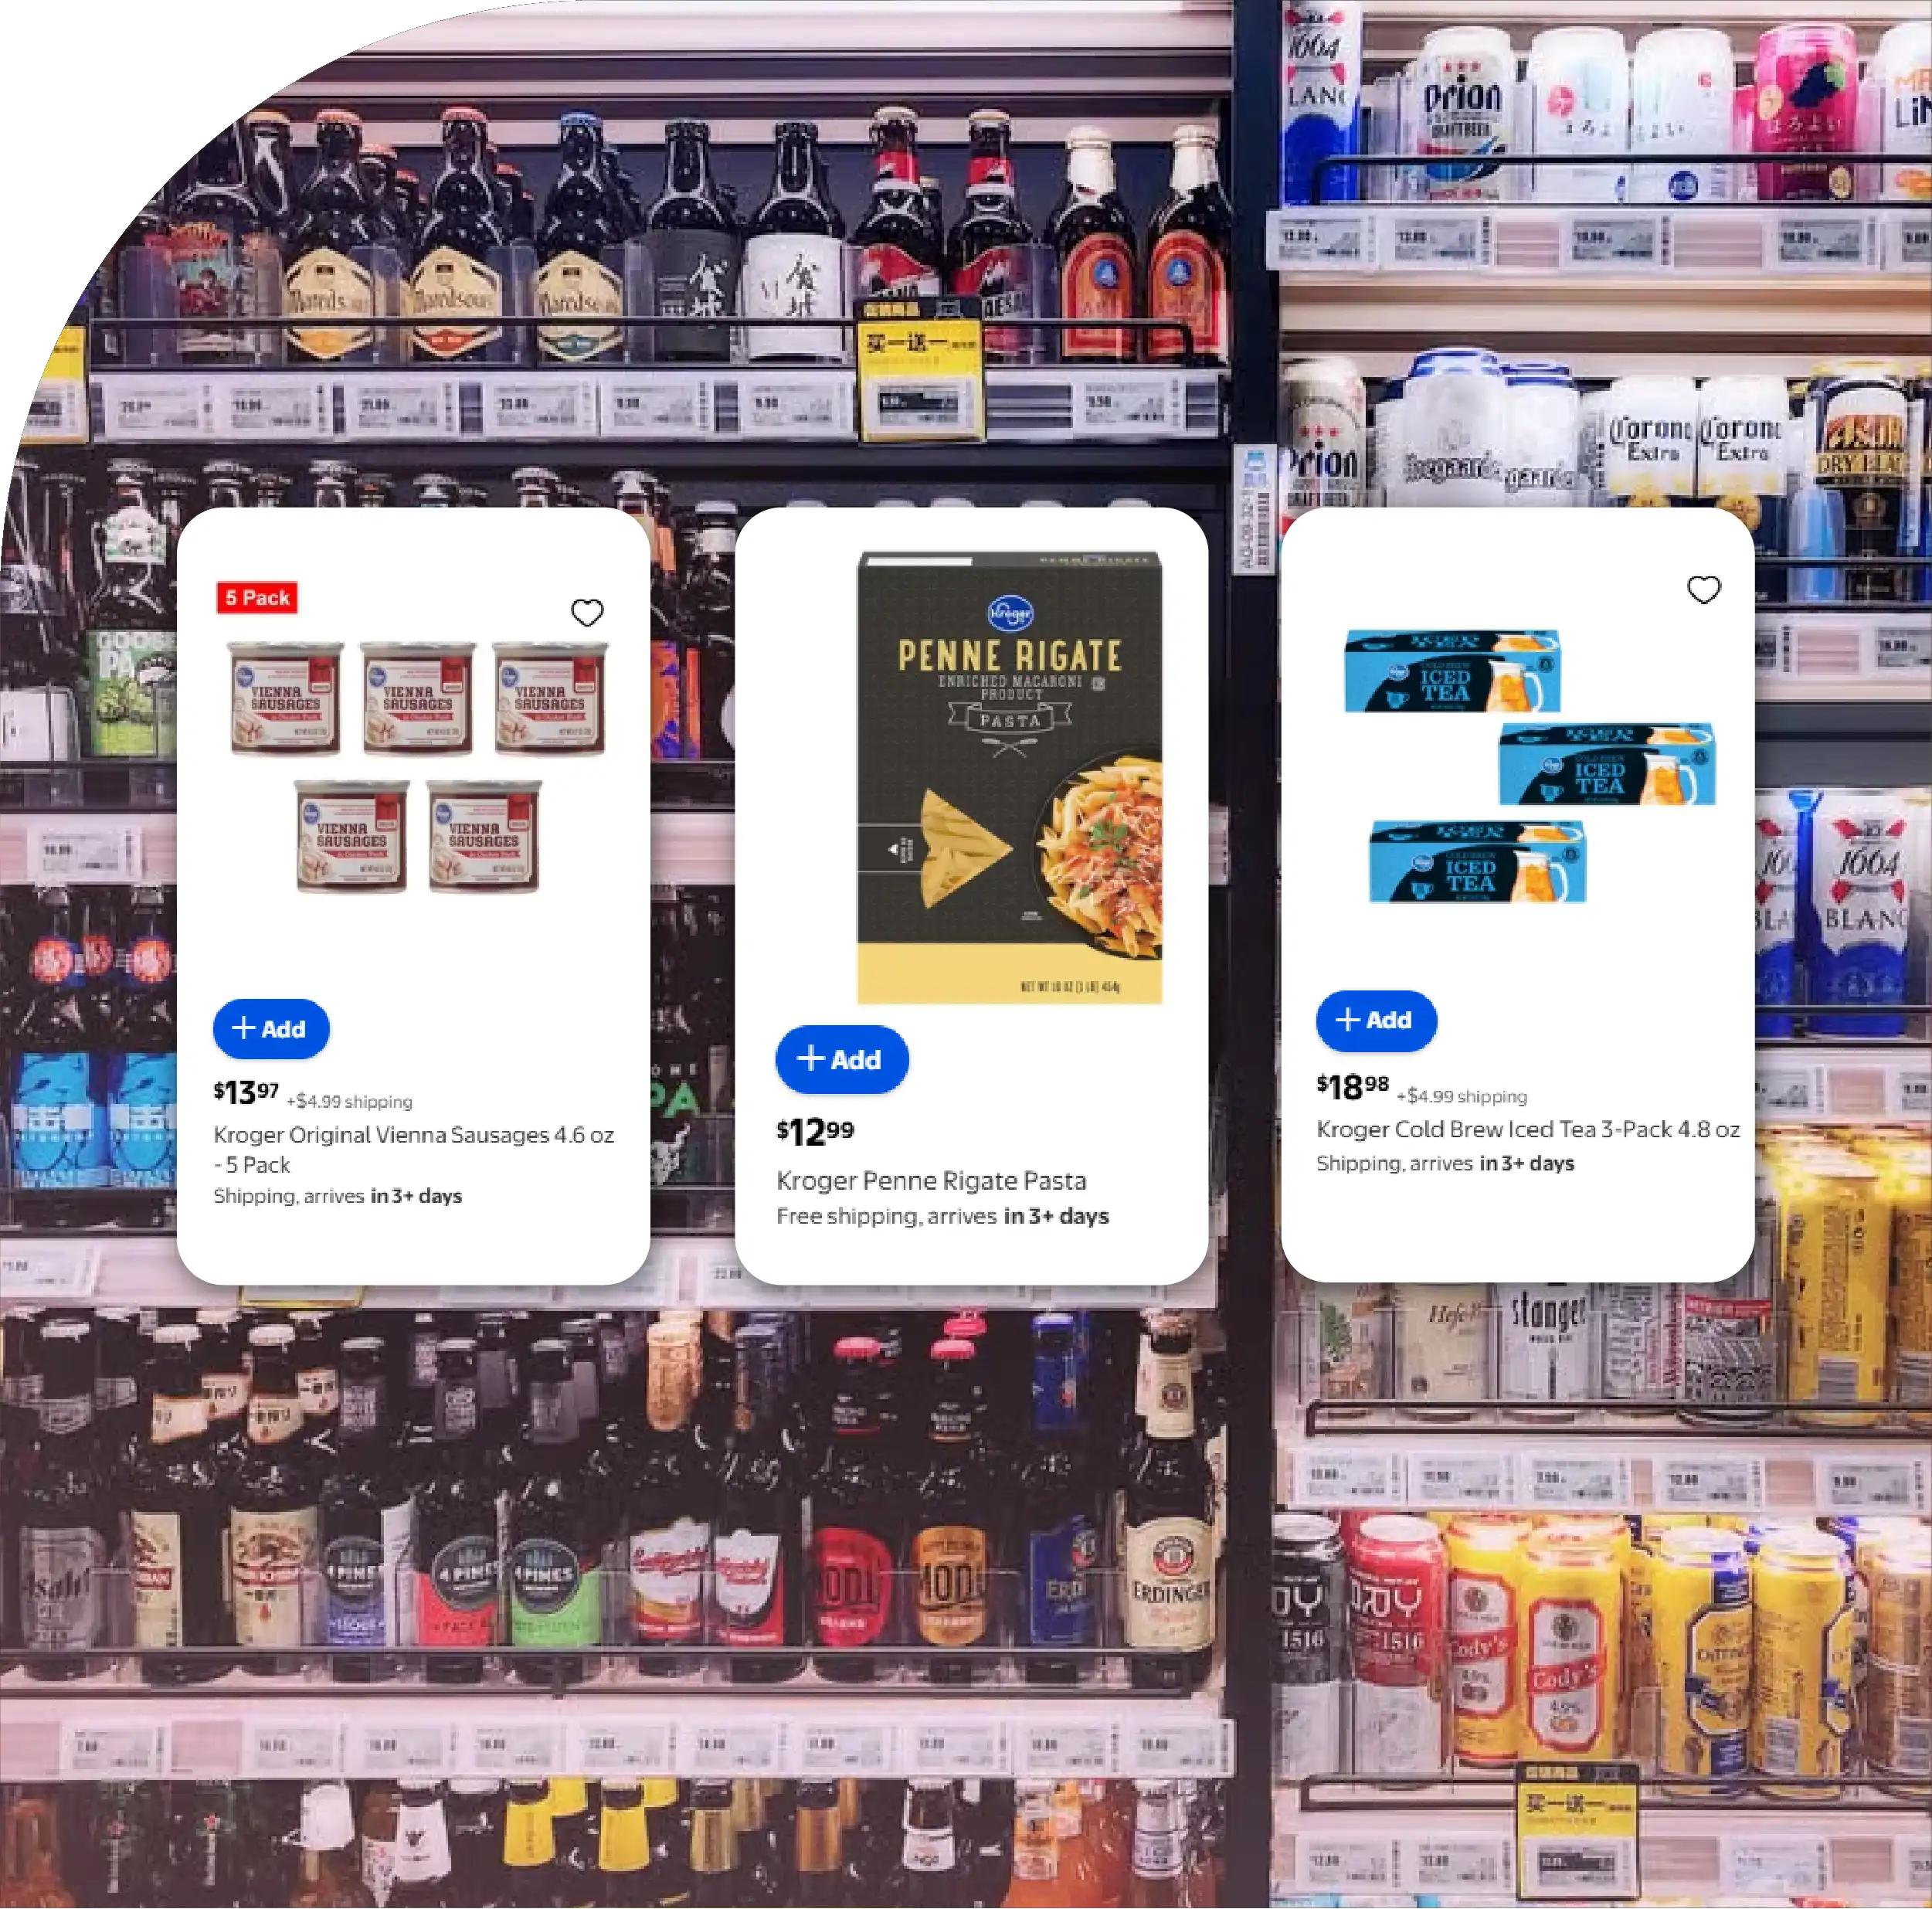
Track product names, brands, categories, pack sizes, prices, promotions, unit prices, availability, ratings, store locations, and timestamps.
Historical Price Monitoring
Recurring data collection identifies price increases, decreases, promotional cycles, discount depth, volatility, and longer-term pricing trends.
Competitive Price Gap Analysis
Normalize unit prices to compare Kroger against market benchmarks and identify persistent gaps across high-frequency grocery categories.
Assortment & Market Density Insights
Analyze SKU counts, brand variety, private-label penetration, promotional density, and geographic assortment differences to uncover market opportunities.
AI-Powered Grocery Intelligence
Combine structured grocery datasets with AI to detect anomalies, forecast trends, identify assortment gaps, prioritize competitive threats, and support faster business decisions.

The US grocery market in 2026 is becoming increasingly dependent on granular, continuously updated retail intelligence. Product assortment, price fluctuations, promotions, availability, pack sizes, and geographic differences are no longer isolated variables. Together, they reveal how supermarkets compete for increasingly value-conscious shoppers.
The method to scrape US Kroger Product & Pricing Data Report 2026 examines a structured approach to collecting and analyzing Kroger's online grocery catalog, with particular emphasis on three dimensions that can provide deeper competitive intelligence. Kroger remains one of the largest US supermarket operators, with 2,697 supermarkets across 35 states and Washington, D.C., as of January 31, 2026. The scale of this footprint creates substantial opportunities for market-level comparisons.
Rather than treating online grocery data as a one-time snapshot, this research framework considers recurring collection of product names, brands, categories, pack sizes, regular prices, promotional prices, unit prices, availability, ratings, and timestamps. This transforms individual observations into a historical dataset capable of showing how prices and assortments evolve.
The objective of US Kroger product and pricing data scraping is to convert Kroger's online catalog into structured records that can be analyzed consistently across products, categories, locations, and collection dates.
A typical record can contain product title, brand, category, subcategory, SKU or product identifier, package quantity, regular price, promotional price, unit price, discount percentage, availability, promotion type, store or ZIP-code context, product URL, and timestamp.
The timestamp is particularly important. Without it, analysts can identify what a product costs but cannot determine whether that price is rising, falling, temporarily discounted, or returning to a previous level.
The research also supports Kroger US competitive pricing analysis by comparing normalized prices across equivalent products and categories. For example, a 12-ounce coffee package should not simply be compared with a 24-ounce package based on shelf price. Unit-price normalization makes cross-product comparisons more meaningful.
This methodology creates the foundation for Kroger grocery competitive intelligence, where product-level observations can be converted into category trends, pricing benchmarks, promotion patterns, assortment gaps, and geographic opportunities.
The breadth of a grocery catalog makes automated collection particularly valuable. Thousands of products can change price, availability, or promotional status without creating an obvious market signal when viewed individually.
An illustrative research dataset covering 7,640 products demonstrates how multiple dimensions can be combined.
| Category | Products Tracked | Avg Regular Price ($) | Avg Promo Price ($) | Avg Discount % | Weekly Price Change % | Availability % | Promo Share % | Unit-Price Variance % | Assortment Density |
|---|---|---|---|---|---|---|---|---|---|
| Fresh Produce | 850 | 3.82 | 3.29 | 13.9 | 8.4 | 94.2 | 22.7 | 18.6 | 31 |
| Dairy & Eggs | 620 | 4.96 | 4.37 | 11.9 | 6.8 | 96.1 | 19.4 | 14.8 | 23 |
| Meat & Seafood | 740 | 11.84 | 9.96 | 15.9 | 12.7 | 91.5 | 27.8 | 24.1 | 27 |
| Bakery | 410 | 4.73 | 4.11 | 13.1 | 7.5 | 95.4 | 21.2 | 16.3 | 15 |
| Frozen Foods | 690 | 6.42 | 5.51 | 14.2 | 9.6 | 93.7 | 25.3 | 17.9 | 25 |
| Snacks | 930 | 5.18 | 4.36 | 15.8 | 11.1 | 94.8 | 32.4 | 19.7 | 34 |
| Beverages | 760 | 5.63 | 4.72 | 16.2 | 10.4 | 95.2 | 29.6 | 21.4 | 28 |
| Pantry | 1,180 | 4.87 | 4.19 | 14.0 | 7.9 | 97.0 | 24.8 | 15.9 | 43 |
| Household | 820 | 9.26 | 7.91 | 14.6 | 8.8 | 96.3 | 26.1 | 18.2 | 30 |
| Personal Care | 640 | 8.74 | 7.22 | 17.4 | 12.3 | 92.8 | 34.7 | 22.6 | 24 |
| Total / Average | 7,640 | 6.41 | 5.43 | 14.8 | 9.7 | 95.0 | 26.9 | 19.0 | 280 |
Illustrative analytical dataset created for research modeling; these SKU-level figures are not Kroger-reported statistics.
The table illustrates why a multidimensional approach matters. Personal care and snacks, for example, show comparatively high promotional shares, while pantry products demonstrate greater assortment density. Meat and seafood show greater weekly price movement, suggesting that some categories require more frequent monitoring than others.
The most important difference between basic product scraping and research-grade retail intelligence is the ability to measure change over time.
A single price observation cannot reveal whether a product has experienced inflation, temporary discounting, promotional cycling, or price stabilization. Daily or weekly snapshots solve this problem by creating a historical price series.
For example, if a cereal product moves from $5.39 to $5.69, then $5.99, and later returns to $5.49, an analyst can distinguish a temporary price cycle from a permanent increase.
This becomes especially important when analyzing consumer behavior. Kroger stated in June 2026 that inflationary pressures were affecting consumers and that shoppers were making more promotional and fewer full-basket trips.
Consequently, US Kroger grocery price monitoring should not focus exclusively on current prices. It should measure the frequency and magnitude of price changes, promotion duration, discount depth, and the percentage of products changing price within defined periods.
Price intelligence becomes more actionable when it identifies where gaps exist.
Kroger grocery price gap analysis can compare Kroger's normalized unit prices against a competitive benchmark. The objective is not simply to identify products that are more expensive, but to determine whether those differences persist and whether they occur across strategically important categories.
A 1% price difference on an occasional specialty product may have limited commercial significance. A persistent 4% difference across high-frequency staples could represent a much larger competitive issue.
The following illustrative dataset demonstrates how historical movement and competitive gaps can be combined.
| Category | Jan Price ($) | Apr Price ($) | Jul Price ($) | Aug Price ($) | Jan-Aug Change % | Benchmark ($) | Kroger Gap % | Promo Frequency % | Stockout % | Market-Gap Score |
|---|---|---|---|---|---|---|---|---|---|---|
| Milk | 4.18 | 4.31 | 4.42 | 4.39 | 5.0 | 4.29 | 2.3 | 18.2 | 3.7 | 62 |
| Eggs | 4.76 | 4.51 | 4.38 | 4.44 | -6.7 | 4.35 | 2.1 | 24.6 | 4.1 | 58 |
| Bread | 3.62 | 3.71 | 3.79 | 3.76 | 3.9 | 3.69 | 1.9 | 21.4 | 3.2 | 55 |
| Chicken | 9.84 | 10.16 | 10.42 | 10.21 | 3.8 | 9.97 | 2.4 | 29.8 | 6.8 | 71 |
| Coffee | 8.92 | 9.21 | 9.46 | 9.31 | 4.4 | 9.12 | 2.1 | 34.2 | 4.6 | 67 |
| Cereal | 5.38 | 5.61 | 5.82 | 5.69 | 5.8 | 5.48 | 3.8 | 39.1 | 3.9 | 76 |
| Frozen Pizza | 6.24 | 6.42 | 6.57 | 6.49 | 4.0 | 6.35 | 2.2 | 36.7 | 4.3 | 69 |
| Detergent | 10.42 | 10.71 | 10.88 | 10.76 | 3.3 | 10.61 | 1.4 | 31.8 | 2.8 | 61 |
| Shampoo | 8.61 | 8.93 | 9.18 | 9.07 | 5.3 | 8.79 | 3.2 | 42.5 | 5.1 | 78 |
| Snacks | 4.96 | 5.14 | 5.31 | 5.22 | 5.2 | 5.04 | 3.6 | 44.8 | 3.4 | 80 |
| Weighted Average | 6.69 | 6.87 | 7.02 | 6.93 | 3.6 | 6.72 | 2.5 | 32.3 | 4.2 | 68 |
Illustrative competitive-intelligence model rather than a report of Kroger's actual internal pricing.
The Market-Gap Score can combine price disparity, promotional behavior, availability, and price volatility into one prioritization measure. High-scoring categories become candidates for deeper investigation.
Density introduces another important dimension that is often missing from conventional supermarket pricing research.
Instead of simply counting products, analysts can calculate the number of active SKUs per category, brands per category, private-label penetration, products per store, promotional SKUs per 100 products, or available products within a geographic market.
For example, a market with 900 active snack products has a substantially different competitive structure from one with 450 products, even if average prices are similar.
Density analysis can identify underserved categories, excessive assortment concentration, regional differences, and potential opportunities for new brands.
Because Kroger operates across thousands of supermarkets, location-level analysis can reveal whether assortment and pricing strategies are consistent nationally or adapted to local markets.
A scalable data pipeline can expose collected information through a structured Kroger grocery data API in US environments, allowing downstream applications to consume current and historical product records.
An API layer can provide fields such as product ID, category, brand, price, sale price, unit price, availability, promotion status, store context, and timestamp.
This architecture is particularly useful for pricing dashboards and automated alert systems because consumers of the dataset do not need to repeatedly process raw collection output.
A Kroger Grocery Delivery Scraping API can further organize delivery-oriented observations, including online availability, fulfillment eligibility, delivery-related assortment, and digital pricing where legally and technically appropriate.
Online grocery shopping has made product availability and digital assortment as important as shelf pricing.
Kroger has reported significant growth in its digital business, including 19% adjusted eCommerce sales growth in the first quarter of 2026.
This growth makes digital shelf monitoring increasingly valuable. A product may be physically available while temporarily unavailable for pickup or delivery. A product may also appear online with a different promotional state from another location.
A Kroger Groceries And Essentials Dataset can capture these differences by maintaining records for everyday categories such as dairy, meat, produce, beverages, household products, personal care, frozen foods, and pantry staples.
The resulting dataset can support multiple business functions.
Pricing teams can identify persistent competitive gaps. Category managers can analyze assortment density. Procurement teams can monitor price volatility. Brand managers can track promotional positioning. Retail analysts can compare markets. Digital teams can detect online availability changes.
Historical observations also make forecasting possible. A category with repeated price increases before a seasonal period may require different monitoring rules from a category characterized by frequent short-term promotions.
The combination of price, availability, promotion, and density is therefore more valuable than any individual field.
The real value of Kroger Grocery Product Data Scraping is not simply obtaining a list of products and their current prices. Its greater value comes from creating a historical, structured intelligence layer that reveals how products, prices, promotions, and assortment evolve.
Supermarket Grocery Data Scraping can extend the same methodology across competing retailers, enabling normalized comparisons of unit prices, promotional intensity, availability, assortment density, and geographic market gaps.
The next stage is AI Grocery Intelligence, where machine-learning systems can classify promotions, detect abnormal price movements, forecast category trends, identify assortment gaps, and automatically prioritize competitive threats.
In 2026, the strongest grocery intelligence strategy is therefore multidimensional. Change over time reveals direction, market gaps reveal opportunity, and density reveals competitive structure. Together, these dimensions turn online grocery data from a static catalog into a continuously evolving research asset for pricing, assortment, competitive intelligence, and strategic decision-making.
Need reliable and high-quality scraping services to transform complex grocery data into actionable business insights? Food Data Scrape provides advanced data collection and analysis solutions designed to help businesses make faster, smarter decisions. Our expertise combines accurate data collection with AI Grocery Intelligence and Hyperlocal Intelligence, enabling companies to understand market movements, customer preferences, pricing patterns, and local demand more effectively. Choose Food Data Scrape to unlock valuable insights from grocery data and turn information into measurable business opportunities. Contact us today to explore a solution tailored to your requirements.
Are you in need of high-class scraping services? Food Data Scrape should be your first point of call. We are undoubtedly the best in Food Data Aggregator and Mobile Grocery App Scraping service and we render impeccable data insights and analytics for strategic decision-making. With a legacy of excellence as our backbone, we help companies become data-driven, fueling their development. Please take advantage of our tailored solutions that will add value to your business. Contact us today to unlock the value of your data.



