

UK Pricing Intelligence: Compare average and median menu prices across cities, cuisines, restaurant types, and competitive segments.
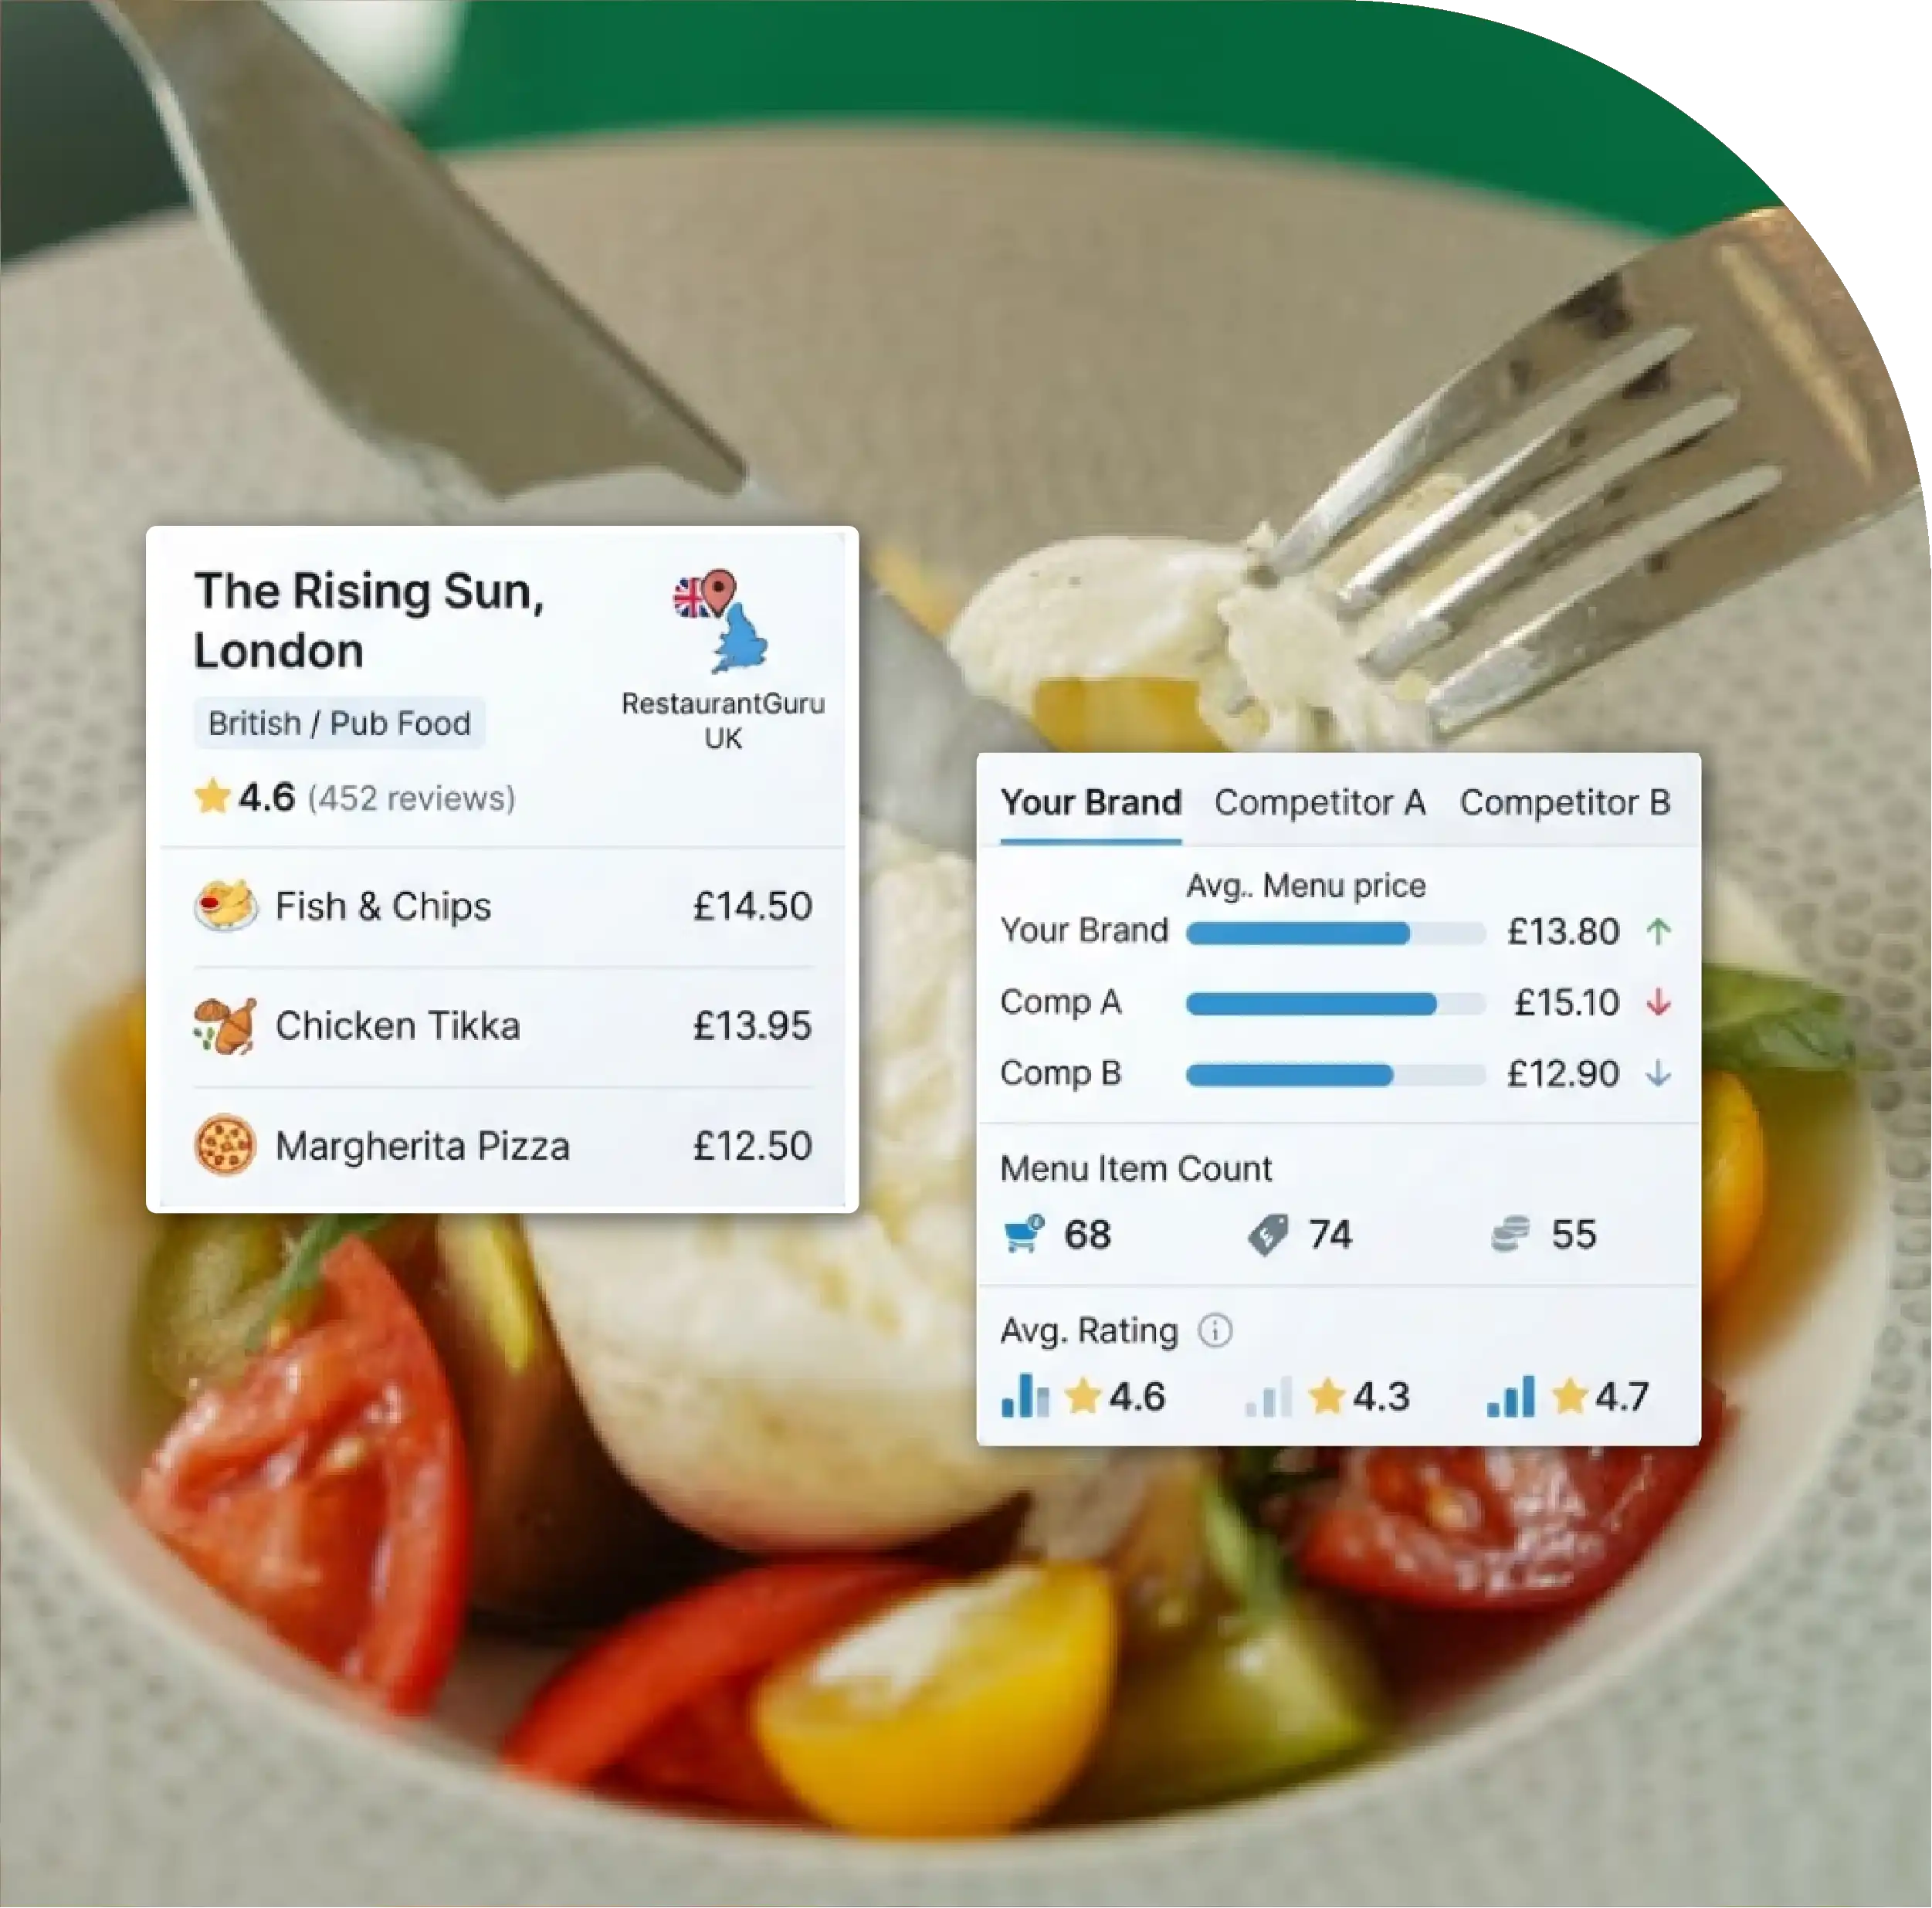
Competitor Benchmarking: Track dish prices, menu breadth, ratings, reviews, premium offerings, and positioning against comparable restaurants.
Market Gap Detection: Identify underserved cuisines and locations by combining restaurant density, pricing, ratings, reviews, and growth signals.
Historical Menu Tracking: Monitor price changes, new dishes, discontinued products, menu expansion, contraction, and premiumisation over time.
Expansion Opportunities: Use geographic restaurant density and competitive intensity to evaluate potential UK markets and neighbourhood-level opportunities.

The UK restaurant sector is becoming increasingly data-driven as operators respond to changing customer preferences, rising costs, competitive pricing, and the rapid evolution of dining formats. In this environment, menu intelligence provides a valuable way to understand how restaurants position themselves across cities, cuisines, and price segments.
This method to scrape RestaurantGuru UK Menu Data Report 2026 examines menu prices, dish categories, cuisines, ratings, review volumes, restaurant locations, menu breadth, competitive intensity, and historical pricing movements. Rather than treating restaurant information as a static snapshot, the research adds three important dimensions: change over time, market gaps, and restaurant density.
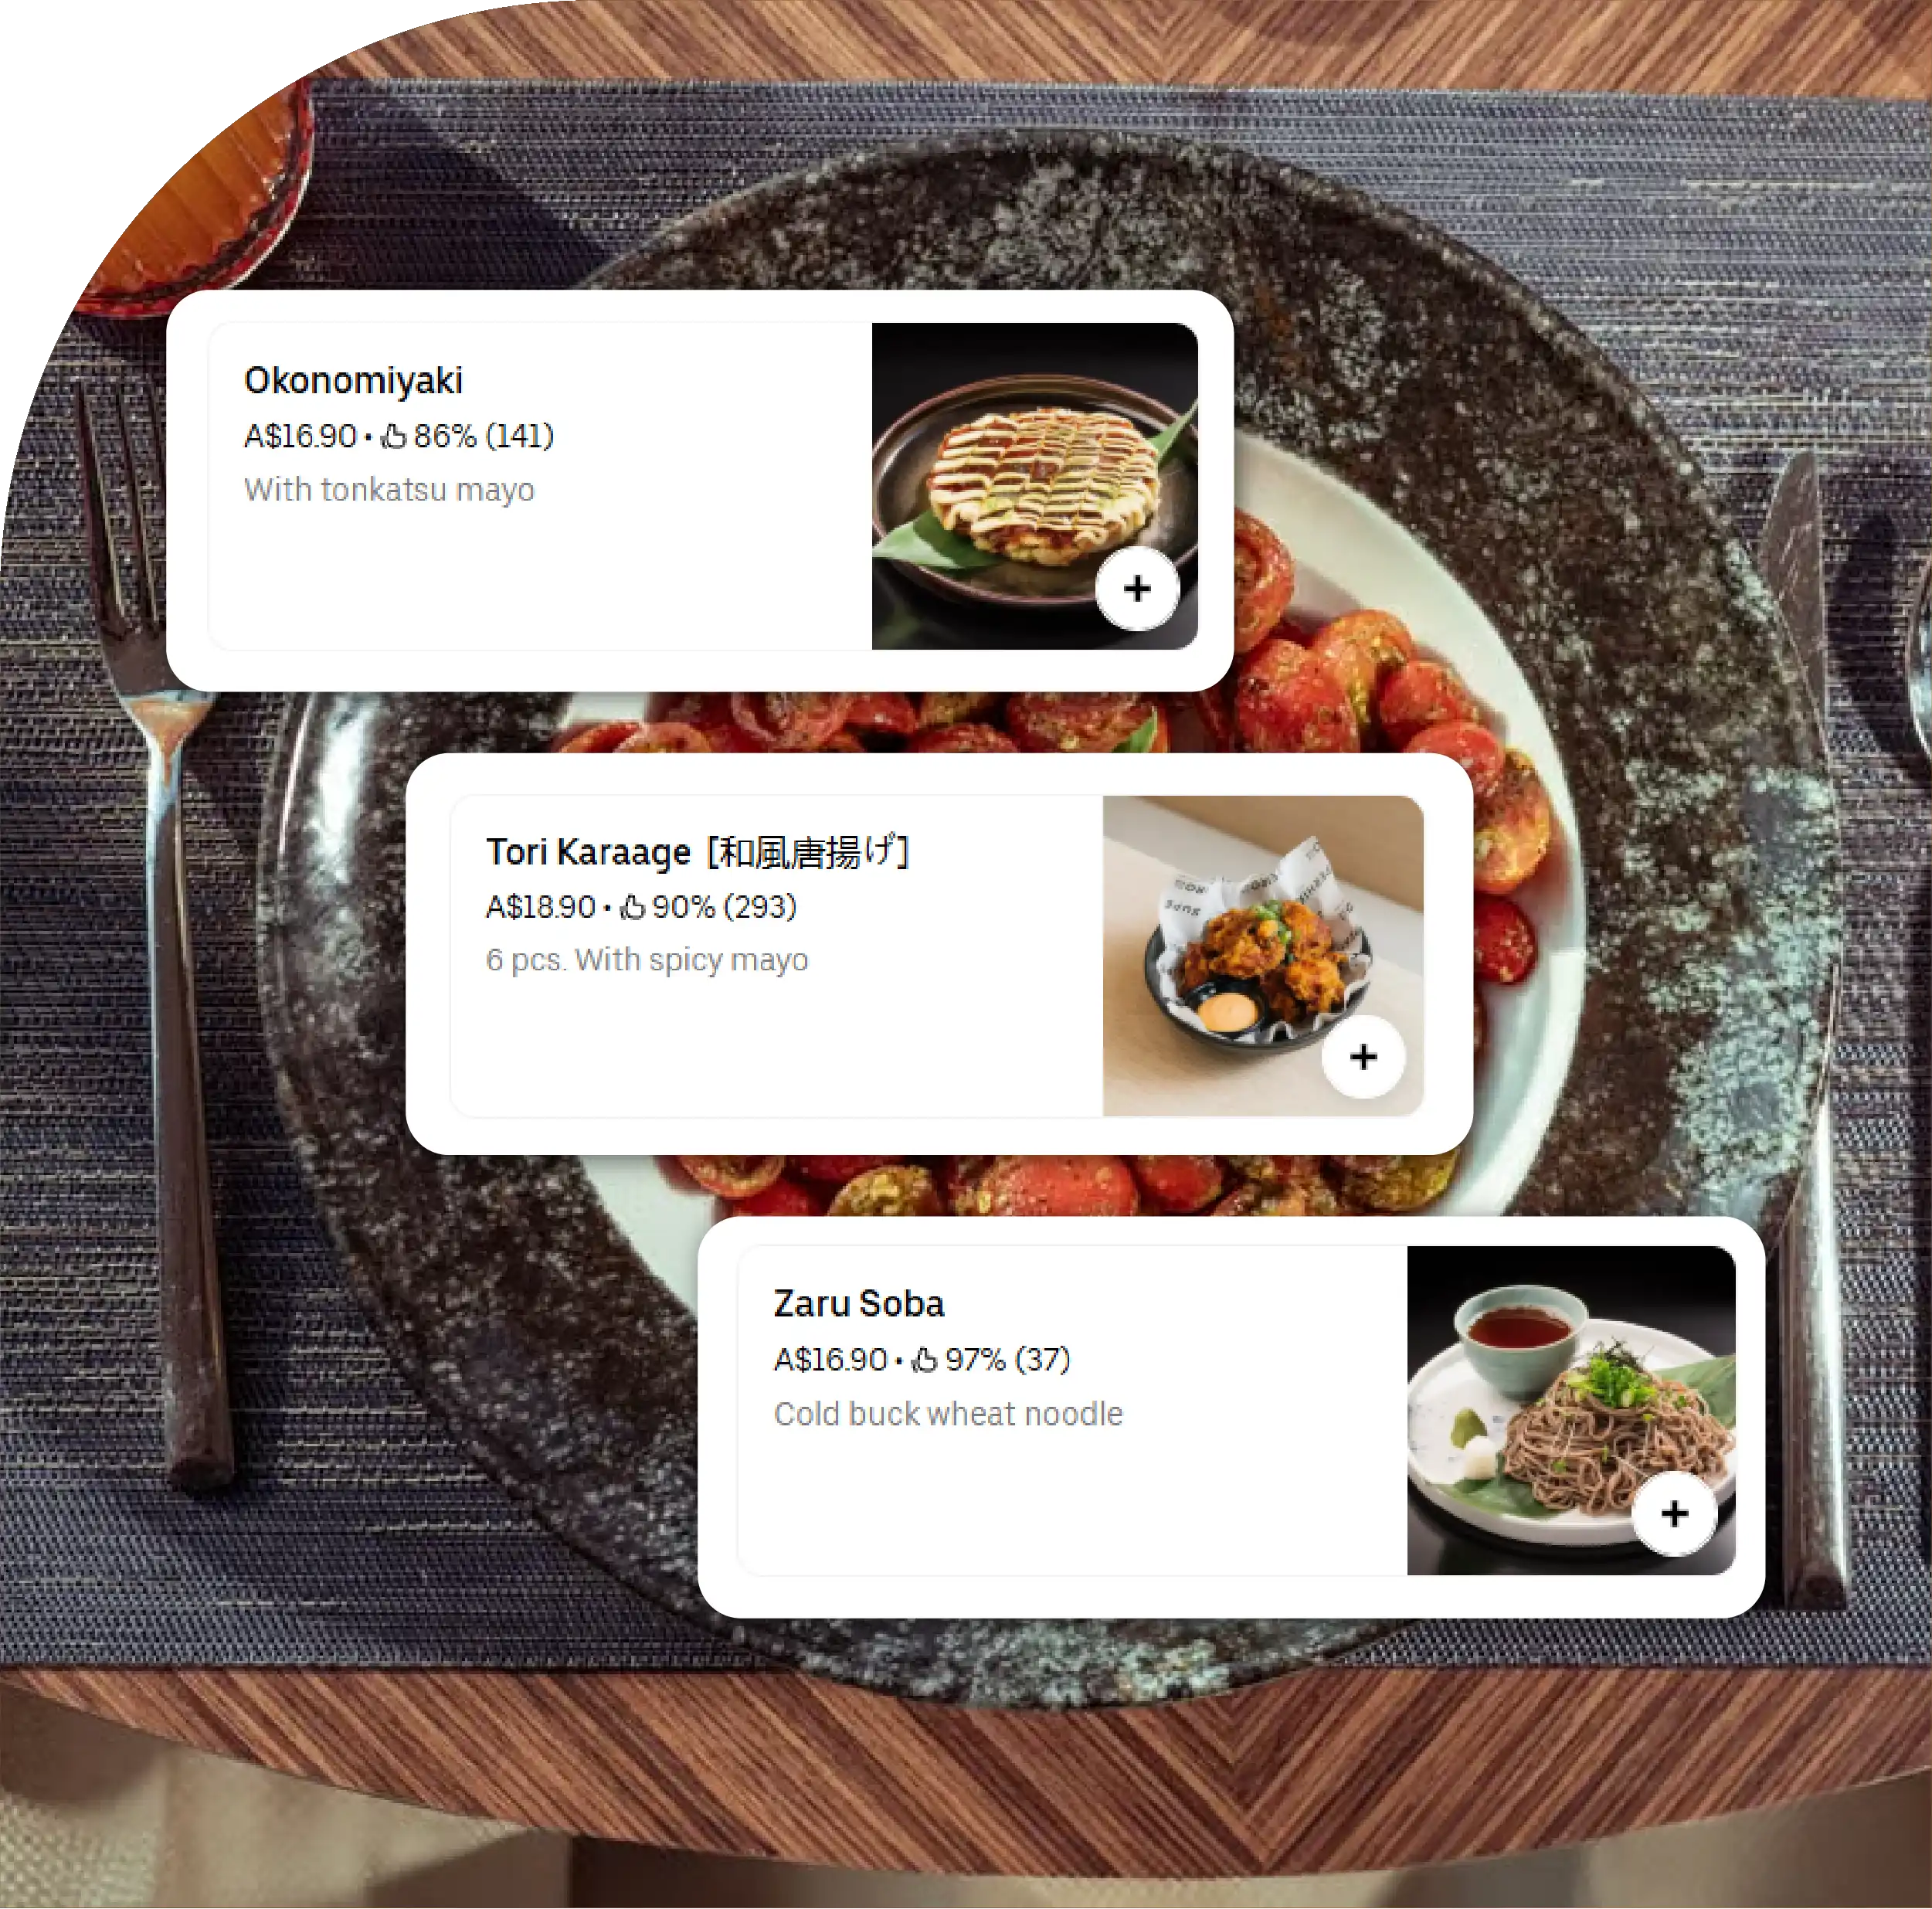
For businesses building a restaurantguru pricing intelligence platform UK, menu-level data can provide a structured foundation for comparing prices and identifying pricing patterns across competing restaurants. Meanwhile, restaurantguru menu benchmarking can help operators compare popular dishes, menu categories, average prices, premium offerings, and value-oriented products against relevant competitors.
The objective is to demonstrate how restaurant data can be transformed into actionable market intelligence for restaurant chains, food-delivery businesses, investors, hospitality consultants, and market researchers.
Restaurant Guru provides restaurant discovery information covering restaurant profiles, cuisines, menus, ratings, reviews, locations, photographs, opening information, and related attributes. These fields can be structured into restaurant-level and menu-item-level records for analytical purposes.
A comprehensive collection can include restaurant name, cuisine, location, postcode, coordinates, rating, review count, price category, menu section, dish name, description, listed price, and collection timestamp.
The timestamp is particularly important because restaurant menus are dynamic. A dish available in January may be removed by June, while prices can change several times during the year.
A historical dataset therefore provides considerably more analytical value than a one-time extraction.
Restaurant pricing is one of the most important indicators of market positioning. Operators can use comparable menu data to identify whether their prices are below, close to, or above the local market average.
However, comparing overall restaurant prices can create misleading conclusions. A premium Italian restaurant should be compared with similar Italian restaurants, while a quick-service burger restaurant should be benchmarked against restaurants with comparable positioning.
| UK Market | Restaurants Sampled | Avg Menu Items | Avg Dish Price (£) | Median Price (£) | Premium Items (%) | Avg Rating | Avg Reviews | Density/km² | 12-Month Price Change (%) | Competitive Index |
|---|---|---|---|---|---|---|---|---|---|---|
| London | 8,500 | 46 | 18.70 | 16.50 | 21 | 4.25 | 1,420 | 42.5 | 6.8 | 94 |
| Manchester | 2,200 | 43 | 15.40 | 13.90 | 17 | 4.19 | 1,010 | 18.7 | 5.9 | 82 |
| Birmingham | 2,000 | 41 | 14.80 | 13.25 | 15 | 4.16 | 930 | 16.9 | 5.5 | 79 |
| Liverpool | 1,500 | 39 | 14.20 | 12.90 | 14 | 4.14 | 870 | 15.3 | 5.2 | 75 |
| Leeds | 1,350 | 42 | 14.90 | 13.40 | 16 | 4.18 | 910 | 14.6 | 5.7 | 78 |
| Bristol | 1,100 | 40 | 15.60 | 14.10 | 18 | 4.21 | 950 | 13.2 | 6.1 | 80 |
| Edinburgh | 1,250 | 44 | 16.20 | 14.70 | 19 | 4.20 | 1,020 | 17.1 | 6.3 | 83 |
| Cardiff | 900 | 38 | 13.80 | 12.50 | 13 | 4.12 | 760 | 12.4 | 5.0 | 71 |
Illustrative analytical figures created for demonstrating the methodology; they are not official Restaurant Guru statistics.
The illustrative figures show substantial differences between UK markets. London combines higher menu prices with greater restaurant density, while Cardiff and Liverpool display lower average prices in this analytical model.
This demonstrates why restaurant pricing should be analysed geographically rather than through a single UK-wide average.
A major advantage of recurring restaurant data collection is the ability to measure change over time.
A single observation might show that a dish costs £15 today. Historical observations can show whether it previously cost £13, whether the restaurant temporarily discounted it, or whether the dish was replaced by a new product.
Tracking prices monthly or quarterly allows researchers to calculate:
For example, if a restaurant's average dish price increases from £14.50 to £15.40 over twelve months, analysts can investigate whether the change resulted from individual price increases or a broader shift toward premium menu items.
Historical comparison also reveals whether a restaurant is changing faster or slower than its competitors.
A structured restaurantguru competitor monitoring programme can provide continuous visibility into nearby restaurant activity.
Competitors can be identified by location, cuisine, price category, or restaurant type. Once grouped, their menu prices and structures can be compared using standardised categories.
A pizza restaurant, for example, could compare margherita, pepperoni, vegetarian, premium pizzas, pasta, starters, desserts, and beverages against similar restaurants in the same geographic market.
Monitoring these categories over time can reveal competitive moves that may otherwise go unnoticed.
If several restaurants increase prices while one maintains its existing pricing, the lower-priced operator could temporarily strengthen its value proposition. Conversely, if competitors consistently add premium dishes, a restaurant with a static menu may gradually lose premium-market positioning.
Cuisine-level research provides another perspective on the UK restaurant market. UK restaurantguru competitive analysis can compare the number of restaurants within each cuisine category with average prices, menu breadth, ratings, review activity, and geographic concentration.
Established categories such as Indian, Italian, Chinese, and burgers can experience high competitive density in major cities. Emerging categories such as Korean, vegan, Turkish, Japanese, healthy bowls, and specialist seafood may show lower density in selected locations.
However, low density should not automatically be interpreted as market opportunity. It may indicate insufficient demand.
A stronger model evaluates density alongside customer engagement, pricing, ratings, menu availability, and historical growth.
Restaurant density measures how concentrated restaurants are within a particular geographic area.
City-wide density can provide a broad market comparison, but neighbourhood-level analysis can produce more actionable results. Researchers can calculate the number of restaurants within a postcode sector, neighbourhood, or defined radius.
High-density areas can indicate strong demand and established dining cultures, but they can also create intense competitive pressure.
Low-density areas may present potential whitespace, particularly when combined with strong ratings, high review activity, suitable pricing, and growing cuisine demand.
For restaurant chains considering expansion, this information can help identify locations where competitive saturation is high and locations where supply appears relatively limited.
Market-gap analysis examines where restaurant supply appears insufficient compared with other market indicators.
For example, an area may have a large concentration of premium restaurants but very few affordable family-oriented restaurants. Another location may have numerous traditional restaurants but limited availability of healthy, vegan, Korean, or specialist seafood concepts.
A market-gap score can combine restaurant density, average menu price, cuisine representation, menu breadth, ratings, review volumes, and historical growth.
| Cuisine | Restaurants | Avg Price 2025 (£) | Avg Price 2026 (£) | Price Change (%) | Avg Menu Items | Avg Rating | Density | Price Gap (%) | Avg Reviews | Gap Score | Growth Signal |
|---|---|---|---|---|---|---|---|---|---|---|---|
| Indian | 3,100 | 13.20 | 14.05 | 6.4 | 52 | 4.18 | High | -4.5 | 1,120 | 78 | Moderate |
| Italian | 2,850 | 15.10 | 16.05 | 6.3 | 45 | 4.20 | High | 8.7 | 1,180 | 61 | Moderate |
| Chinese | 2,250 | 13.90 | 14.65 | 5.4 | 49 | 4.12 | Medium | -1.2 | 980 | 72 | Moderate |
| Burgers | 1,950 | 12.80 | 13.55 | 5.9 | 34 | 4.09 | Very High | -6.8 | 1,050 | 55 | Low |
| Japanese | 1,400 | 17.20 | 18.35 | 6.7 | 41 | 4.25 | Medium | 19.3 | 1,090 | 68 | High |
| Turkish | 1,150 | 13.40 | 14.10 | 5.2 | 43 | 4.16 | Medium | -5.0 | 920 | 81 | High |
| Vegan | 720 | 14.60 | 15.10 | 3.4 | 37 | 4.22 | Low | 2.1 | 860 | 89 | High |
| Seafood | 680 | 19.10 | 20.40 | 6.8 | 39 | 4.24 | Low | 28.5 | 810 | 84 | High |
| Korean | 590 | 16.10 | 17.25 | 7.1 | 40 | 4.23 | Low | 8.2 | 790 | 92 | Very High |
| Healthy Bowls | 430 | 12.90 | 13.20 | 2.3 | 29 | 4.15 | Low | -9.4 | 720 | 95 | Very High |
Illustrative analytical figures created to demonstrate the market-gap methodology and not official Restaurant Guru statistics.
The illustrative model shows how opportunity can emerge from the interaction between supply, price, density, and customer engagement.
Korean restaurants, for example, show low illustrative density combined with strong ratings and growth signals. Healthy bowls demonstrate another potential gap through limited supply and comparatively accessible prices.
Such findings should be validated with additional demand, demographic, and location data before commercial decisions are made.
A restaurantguru menu data API uk workflow can provide a structured approach to recurring data processing where an authorised API or compliant data-access mechanism is available.
An automated pipeline can collect permitted restaurant information, parse menu fields, normalise prices, classify cuisines, identify duplicates, validate records, and store historical snapshots.
The system should preserve the collection timestamp for every record. This makes it possible to reconstruct menu and pricing conditions at different points in time.
Automated workflows can also feed competitive dashboards, market-gap reports, price alerts, restaurant expansion models, and historical trend analysis.
A useful RestaurantGuru menu dataset should combine restaurant-level information with individual menu-item records.
Restaurant-level fields can include restaurant name, city, postcode, coordinates, cuisine, rating, review count, price category, and restaurant status.
Menu-level fields can include menu category, dish name, description, listed price, dietary attributes, availability, and collection date.
This structure allows analysts to answer much more detailed questions than a restaurant directory can answer.
For example, researchers can determine which cities have the highest average dish prices, which cuisines have the deepest menus, which restaurants are changing prices fastest, and which neighbourhoods have low cuisine density.
Restaurant menu intelligence can support several commercial applications across the UK hospitality ecosystem. Restaurant chains can benchmark branches against local competitors, investors can assess restaurant density before entering a market, food-delivery companies can analyse merchant pricing and menu composition, and hospitality consultants can identify emerging cuisines and underserved locations.
A Restaurant Guru Food Delivery Scraping API can support structured analysis of restaurant and menu information for delivery-focused research, helping businesses organise pricing, menu categories, restaurant locations, and other relevant attributes into a consistent analytical framework where appropriate authorised access is available.
Historical menu data can also reveal premiumisation. A restaurant might remove several low-priced products while introducing higher-priced dishes. Its average menu price would then increase partly because of product-mix changes rather than direct price inflation.
Restaurant Guru Food Delivery App Data Scraping can further support delivery-market research by enabling analysis of menu structures, restaurant offerings, pricing patterns, and competitive positioning where relevant information is accessible and collection is permitted.
This combination of current and historical information allows businesses to distinguish genuine price inflation from menu restructuring, identify changing customer-facing strategies, and understand how restaurant offerings evolve within different UK markets.
The value of restaurant data in 2026 comes from combining multiple dimensions rather than analysing menu prices independently. Pricing, menu breadth, cuisine, ratings, reviews, geographic density, market gaps, and historical changes can collectively reveal how the UK restaurant ecosystem is evolving.
A structured Restaurant Guru API Data Scraping workflow can support analytical processes when appropriate authorised access is available. It can help organise restaurant information into consistent records, making it easier to compare pricing patterns, menu structures, cuisine categories, and geographic competition.
Extraction from Restaurant Guru becomes more valuable when each observation is timestamped, validated, and preserved for historical comparison instead of being overwritten by the latest record. This creates a historical foundation for identifying price movements, menu changes, emerging cuisine categories, and shifts in restaurant density.
Likewise, Restaurant Guru Data Scraping can form the foundation of recurring competitive datasets used to monitor menu changes, pricing movements, cuisine trends, restaurant locations, and market opportunities.
The central conclusion is clear: restaurant intelligence becomes significantly more powerful when it answers three questions together—how the market is changing, where supply gaps exist, and how dense the competitive environment has become. Combining these dimensions turns restaurant menu information into a strategic resource for pricing decisions, expansion planning, competitor intelligence, and UK hospitality market research.
Looking for dependable data scraping services? Food Data Scrape delivers accurate Food Data Aggregator and Mobile Restaurant App Scraping solutions, backed by advanced analysis of Sales and Demand Trends to support smarter strategic decisions.



