Introduction
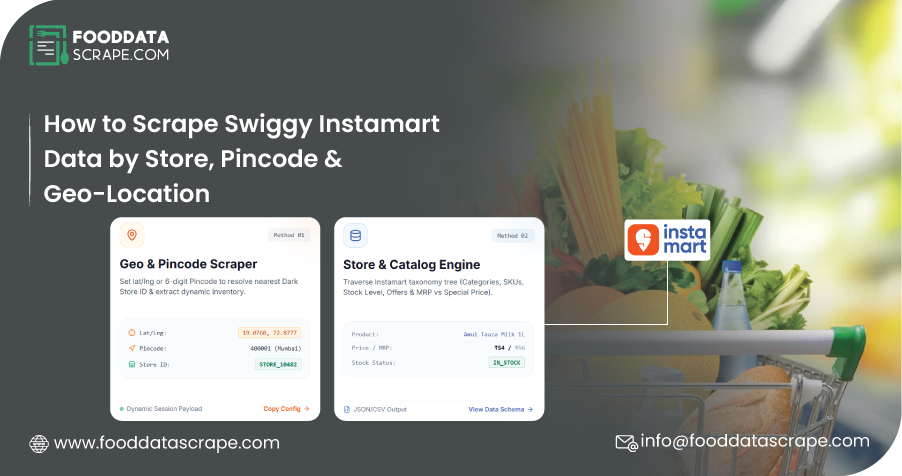
Quick commerce has transformed grocery shopping by making everyday essentials available within minutes. Swiggy Instamart operates in a competitive, location-driven environment where product prices, discounts, inventory, and delivery availability can vary significantly between stores and serviceable pincodes. For retailers, FMCG brands, distributors, and market researchers, understanding these variations is essential for making informed business decisions. Businesses can Scrape Swiggy Instamart Data By Store Pincode & Geo-Location to examine localized product assortments, compare prices, identify promotional patterns, and understand how grocery demand differs across markets. This information provides a foundation for better operational planning and competitive intelligence.
Implementing Swiggy Instamart Pricing Data Scraping also helps businesses monitor changes in listed prices, promotional offers, and effective selling prices across selected locations. Through Swiggy Instamart Store-Level Analytics, companies can identify geographic pricing differences, evaluate assortment strategies, and compare product availability across store-level markets. However, successful data collection requires more than simply extracting product listings. It involves capturing location identifiers, standardizing product information, validating records, and organizing observations into a consistent analytical framework. With a structured approach, businesses can turn publicly accessible or otherwise authorized quick-commerce information into actionable insights while respecting applicable platform terms, privacy requirements, and technical restrictions.
Understanding Swiggy Instamart Data Scraping
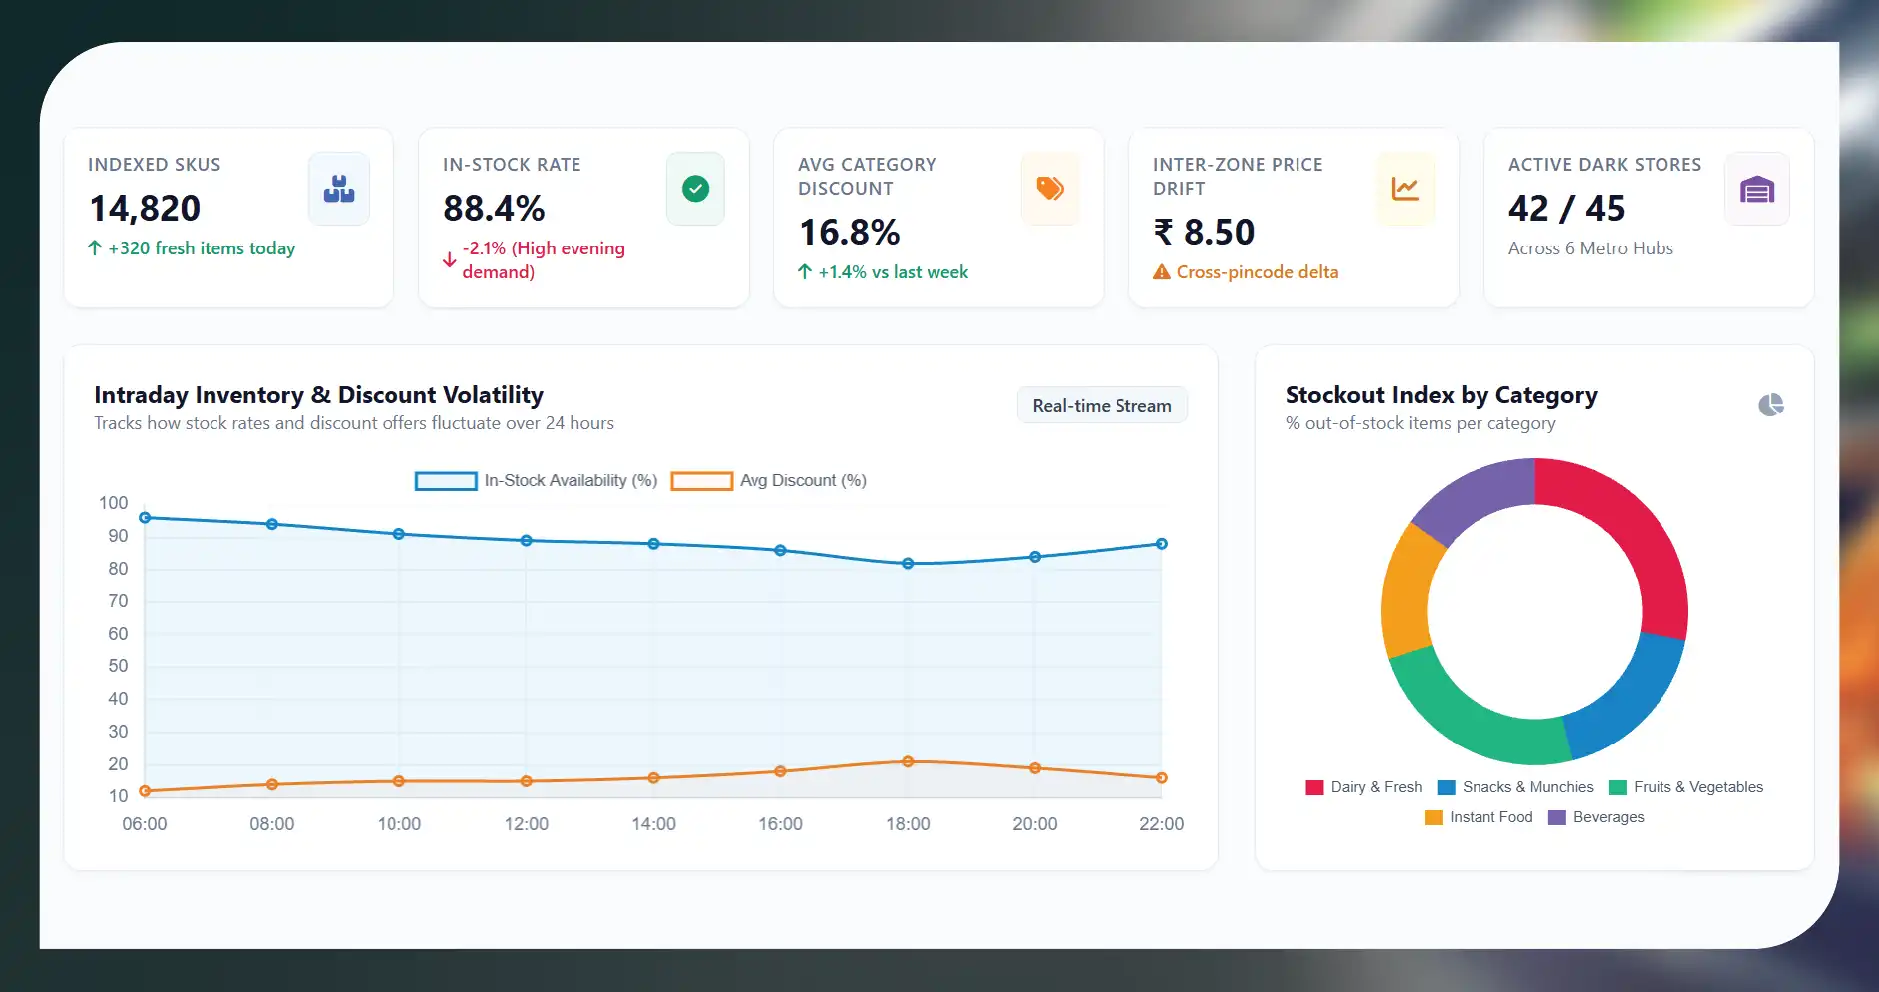
Swiggy Instamart data scraping involves collecting relevant grocery information from authorized, accessible platform pages or approved interfaces and converting it into structured datasets. Depending on available access and business requirements, these datasets may include product names, categories, pack sizes, displayed prices, discounts, availability indicators, store identifiers, serviceable pincodes, and observation timestamps.
The objective is to create a reliable view of how grocery products are presented across different locations and shopping sessions. Unlike conventional e-commerce monitoring, quick-commerce analysis must account for geographic serviceability and frequently changing inventory. A product visible in one locality may be unavailable in another, while promotional prices can differ across customer locations.
Swiggy Instamart Grocery Data Extraction becomes particularly useful when businesses need to compare multiple stores, analyze localized product assortments, and monitor pricing changes over time. The resulting information can support assortment planning, market research, promotional evaluation, and competitive benchmarking.
1. Collecting Data by Store
Store-level collection focuses on understanding the products, prices, and availability associated with individual service locations. Where the platform exposes a store identifier or an equivalent location reference through an authorized interface, that identifier can serve as the primary key for organizing observations.
A practical workflow begins by selecting the target stores or service areas. Researchers then identify the product categories relevant to their analysis, such as dairy, packaged foods, beverages, personal care, household essentials, and fresh produce. Each observation should be associated with its store reference and collection timestamp.
Important fields include:
- Store identifier or location reference
- Product name and category
- Brand and pack size
- Displayed price and promotional price
- Discount percentage, when available
- Product availability status
- Product URL or reference
- Collection date and time
The main advantage of store-based monitoring is that it reveals differences that broader national or city-level datasets can conceal. Two stores serving neighboring areas may display different assortments or promotional offers because of inventory, fulfillment arrangements, and local demand.
Swiggy Instamart Store-Level Data Scraping helps businesses evaluate these differences systematically. Analysts can group products by store, compare equivalent items, identify recurring stock gaps, and measure how frequently prices change. Store identifiers should be verified carefully because displayed locations do not always correspond directly to publicly documented physical outlets.
2. Extracting Data by Pincode
Pincodes provide a practical geographic unit for examining quick-commerce serviceability and market coverage. They help businesses organize observations around delivery areas, compare localized shopping experiences, and identify differences between neighborhoods.
To collect pincode-based information, analysts should define a list of target pincodes and use the platform's authorized location-selection mechanism or approved data interface. For each serviceable pincode, the collection process can record the products visible to that location, applicable prices, available offers, and serviceability indicators.
A useful pincode dataset may contain:
| Data Field | Example | Business Purpose |
|---|---|---|
| Pincode | 110001 | Geographic segmentation |
| City | Delhi | Market comparison |
| Product | Toned Milk | Product identification |
| Pack Size | 500 ml | Comparable assortment analysis |
| Listed Price (₹) | 32 | Price benchmarking |
| Offer Price (₹) | 29 | Promotional monitoring |
| Discount (%) | 9.38 | Offer evaluation |
| Availability | In stock | Availability tracking |
| Observation Date | 2026-10-12 | Historical comparison |
The values above are illustrative examples, not verified live Swiggy Instamart listings.
Extract Pincode-Level Quick Commerce Data to understand how product selection, discounts, and availability differ across service areas. This can help FMCG companies identify underrepresented markets, retailers evaluate localized competition, and researchers examine geographic differences in grocery pricing.
Businesses should also distinguish between a pincode being recognized and a location actually being serviceable. A platform may serve only certain addresses within a broader postal area. Consequently, pincode-level findings should be interpreted alongside available serviceability information rather than assuming uniform coverage.
3. Using Geo-Location for Market-Level Intelligence
Geographic analysis adds another layer to store and pincode monitoring. Depending on authorized data access, geographic information may include city, locality, neighborhood, coordinates, or a platform-provided service-area reference.
The first step is to define the geographic boundaries of the research. For example, a grocery brand might compare selected localities in Bengaluru, Mumbai, Hyderabad, or Delhi. The same set of products can then be monitored across the chosen locations to identify differences in pricing, assortment, and availability.
Swiggy Instamart Product Availability is an important metric in this process because visibility and stock status can vary between locations. Analysts should record the observation time and the location context whenever possible. A missing listing should not automatically be classified as an out-of-stock product; it could reflect assortment differences, search limitations, serviceability, or temporary technical issues.
Geographic datasets can be mapped to local market boundaries, allowing businesses to identify coverage gaps, compare neighboring areas, and prioritize locations for further research. Coordinates should be collected only when legitimately available and necessary for the intended analysis. Personal customer addresses and other sensitive information should not be collected without an appropriate lawful basis.
4. Building a Reliable Data Collection Workflow
An effective scraping project requires a repeatable process rather than occasional manual observations.
Step 1 Define the scope: Select the target locations, product categories, monitoring frequency, and business questions. A focused scope reduces unnecessary collection and makes results easier to interpret.
Step 2 Confirm permitted access: Review applicable platform terms and use authorized interfaces or approved collection methods. Respect access controls, rate limits, and restrictions instead of attempting to bypass them.
Step 3 Standardize location identifiers: Maintain a consistent mapping between pincodes, localities, store references, and cities. This prevents duplicate locations and makes comparisons more reliable.
Step 4 Normalize product information: Standardize brand names, quantities, units, categories, and product identifiers. For example, a 500 ml product should not be directly compared with a one-liter pack without accounting for size.
Step 5 Validate pricing fields: Separate listed prices from promotional prices and calculate discounts only when the necessary values are available. Record unavailable fields as missing instead of inventing values.
Step 6 Schedule authorized collection: Choose collection intervals that match the research objective. Frequent monitoring may help track volatile promotions, while daily or weekly observations may be sufficient for broader assortment studies.
Step 7 Store historical snapshots: Preserve timestamps and location references so analysts can compare observations over time rather than overwriting previous records.
Scrape Pincode and Location Data using a consistent schema to connect every observation to its relevant geographic context. This makes it easier to investigate why prices, discounts, and product visibility differ between locations.
5. Creating a Structured Grocery Dataset
Raw observations rarely provide immediate business value. Data must be cleaned, reconciled, and transformed into a format suitable for analysis.
A useful dataset should include standardized product names, brand identifiers, pack sizes, prices, discounts, store references, pincodes, location names, availability indicators, and timestamps. Additional fields can record collection status, data source, validation results, and confidence levels.
Duplicate records should be identified using combinations of product identifiers, location references, and observation times. Analysts should also flag implausible prices, inconsistent pack sizes, missing identifiers, and sudden changes that may require verification.
For price comparisons, unit-price calculations can provide a more meaningful view of products sold in different quantities. For instance, comparing prices per liter or per kilogram can help distinguish genuine pricing differences from pack-size variations.
Historical snapshots are equally important. A product that is unavailable during one observation may return later, and a temporary discount may disappear within hours. Maintaining dated records allows businesses to calculate price movements, promotion frequency, and observed availability rates.
6. Analyzing Pricing, Promotions, and Availability
Once the dataset is structured, businesses can examine several useful indicators.
- Price variation: Compare equivalent products across selected stores and pincodes to understand geographic pricing differences.
- Discount intensity: Measure the frequency and depth of displayed promotions to evaluate promotional positioning.
- Assortment coverage: Count the distinct products observed in each category and location to identify differences in selection.
- Observed availability: Calculate the proportion of valid observations in which a product was marked available. This measure should reflect the monitoring schedule and distinguish confirmed stockouts from missing or inconclusive observations.
- Price volatility: Track changes between comparable observations to understand how frequently prices fluctuate.
- Competitive positioning: Compare equivalent products across selected retailers when comparable, authorized data is available.
These metrics should be interpreted carefully. A lower displayed price does not necessarily indicate a lower final checkout cost, and a single unavailable observation does not prove a persistent stockout. Delivery charges, personalized offers, taxes, and other checkout conditions may also affect the final amount paid.
7. Turning Location Data into Business Decisions
The greatest benefit of location-specific scraping is its ability to connect market observations with practical decisions.
FMCG manufacturers can identify areas where their products appear less frequently than expected. Grocery retailers can examine assortment gaps and benchmark prices across selected service areas. Market researchers can study differences in promotional activity, while category managers can prioritize products requiring closer monitoring.
Location-based insights can also support expansion research. Businesses may compare observed product variety and serviceability across target neighborhoods before conducting deeper market assessments. However, platform visibility alone cannot establish total market demand, sales volume, or a store's actual inventory position.
Supermarket Store Locator information can complement this analysis when it is lawfully accessible and relevant to identifying retail locations. Combining verified location references with product observations creates a more useful geographic framework for comparing markets and interpreting store-level performance.
8. Common Challenges and Best Practices
Quick-commerce data collection presents several challenges. Location-dependent pages may change when a selected address changes, product listings can disappear, and promotional information may be updated between observations. Store references may also be difficult to reconcile with geographic boundaries.
To manage these issues, businesses should maintain consistent collection rules, record timestamps, validate representative records, and document changes in the data schema. They should avoid treating inaccessible pages as evidence that products do not exist and distinguish between missing data, unavailable products, and confirmed stockouts.
Another important consideration is responsible collection. Businesses should use permitted access methods, minimize unnecessary requests, protect stored information, and avoid collecting personal or sensitive customer data. Platform restrictions should be respected, and data should be used in accordance with applicable laws and contractual requirements.
Regular quality checks can reveal incomplete locations, duplicated products, inconsistent prices, and outdated observations. A documented validation process also makes reports easier to audit and helps stakeholders understand the limitations of their findings.
How Food Data Scrape Can Help You?
- Location-Based Collection: Food Data Scrape helps organize authorized grocery observations by store, pincode, and locality, enabling businesses to compare regional assortments, prices, promotions, and availability using consistent geographic identifiers.
- Pricing Intelligence: Structured datasets help brands monitor displayed prices, evaluate promotional changes, compare equivalent pack sizes, and identify recurring pricing differences across selected quick-commerce markets.
- Availability Monitoring: Scheduled observations help businesses track product visibility, identify repeated availability gaps, and distinguish confirmed stockouts from incomplete records or temporary collection issues.
- Data Standardization: Food Data Scrape supports consistent product categorization, location mapping, duplicate detection, and historical record management, helping teams prepare cleaner datasets for research and business intelligence.
- Actionable Reporting: Organized datasets can feed analytical reports and dashboards, allowing category managers, FMCG brands, and market researchers to evaluate geographic trends and prioritize further investigation.
Conclusion
Location-specific quick-commerce intelligence helps businesses understand how grocery prices, promotions, assortments, and availability vary across local markets. By combining store identifiers, pincodes, geographic references, standardized product fields, and historical observations, companies can develop a more consistent view of the competitive landscape.
Businesses seeking to Scrape Swiggy Instamart Grocery Data should prioritize reliable collection methods, clear location mapping, careful validation, and responsible data handling. A structured Swiggy Instamart Data Scraping API integration, where officially supported or otherwise authorized, can simplify the delivery of consistent records to analytics systems and reporting workflows.
When combined with a Q-Commerce Dashboard, these datasets can help teams compare locations, monitor price movements, assess promotional patterns, and review observed product availability. The ultimate value comes not from collecting the largest possible volume of information, but from producing accurate, traceable, location-aware insights that support better-informed business decisions.
Are you in need of high-class scraping services? Food Data Scrape should be your first point of call. We are undoubtedly the best in Food Data Aggregator and Mobile Grocery App Scraping service and we render impeccable data insights and analytics for strategic decision-making. With a legacy of excellence as our backbone, we help companies become data-driven, fueling their development. Please take advantage of our tailored solutions that will add value to your business. Contact us today to unlock the value of your data.