Introduction
The restaurant industry reflects changing consumer lifestyles faster than almost any other sector. Every week, restaurants introduce new dishes, revise prices, add seasonal specials, and experiment with flavors that match local tastes. These frequent updates create an enormous amount of publicly available information that, when collected and analyzed responsibly, provides valuable insights into regional dining behavior. Businesses no longer have to depend solely on surveys or annual industry reports to understand food preferences. Instead, they can monitor live restaurant ecosystems and identify emerging opportunities through structured data.
Scraping Cuisine Trends by City enables organizations to gather restaurant listings, cuisine classifications, menu details, pricing, ratings, and location-specific information from multiple online sources. By organizing this information into structured datasets, businesses can evaluate how consumer preferences vary between cities and identify where particular cuisines are expanding or losing momentum.
Similarly, city-wise cuisine popularity analysis helps compare demand across metropolitan areas, allowing restaurant chains, investors, food delivery companies, and market researchers to understand how regional preferences influence business performance.
A modern cuisine demand intelligence platform transforms millions of restaurant records into dashboards that reveal market movements, customer interests, competitive density, and growth opportunities with remarkable precision.
The Growing Importance of Regional Cuisine Intelligence
Food preferences are deeply influenced by geography, culture, income levels, tourism, migration, and lifestyle trends. While one city may experience increasing demand for authentic Japanese cuisine, another may show stronger growth in regional Indian food or Mediterranean dining. These differences shape restaurant success and influence where businesses choose to invest.
Traditional market research often provides only a broad overview of dining habits. Restaurant data, however, reflects actual market activity. Every newly opened restaurant, newly introduced menu item, customer review, and pricing update contributes fresh information about consumer demand.
For restaurant operators, this intelligence supports menu planning and expansion decisions. Food aggregators can improve customer recommendations by understanding local cuisine preferences. Investors use historical restaurant data to evaluate emerging food segments, while FMCG brands identify restaurants that align with evolving consumer tastes.
Because restaurant websites and delivery platforms update continuously, businesses gain access to a dynamic view of the market instead of relying on static reports that become outdated within months.
How Restaurant Data Reveals Cuisine Trends?
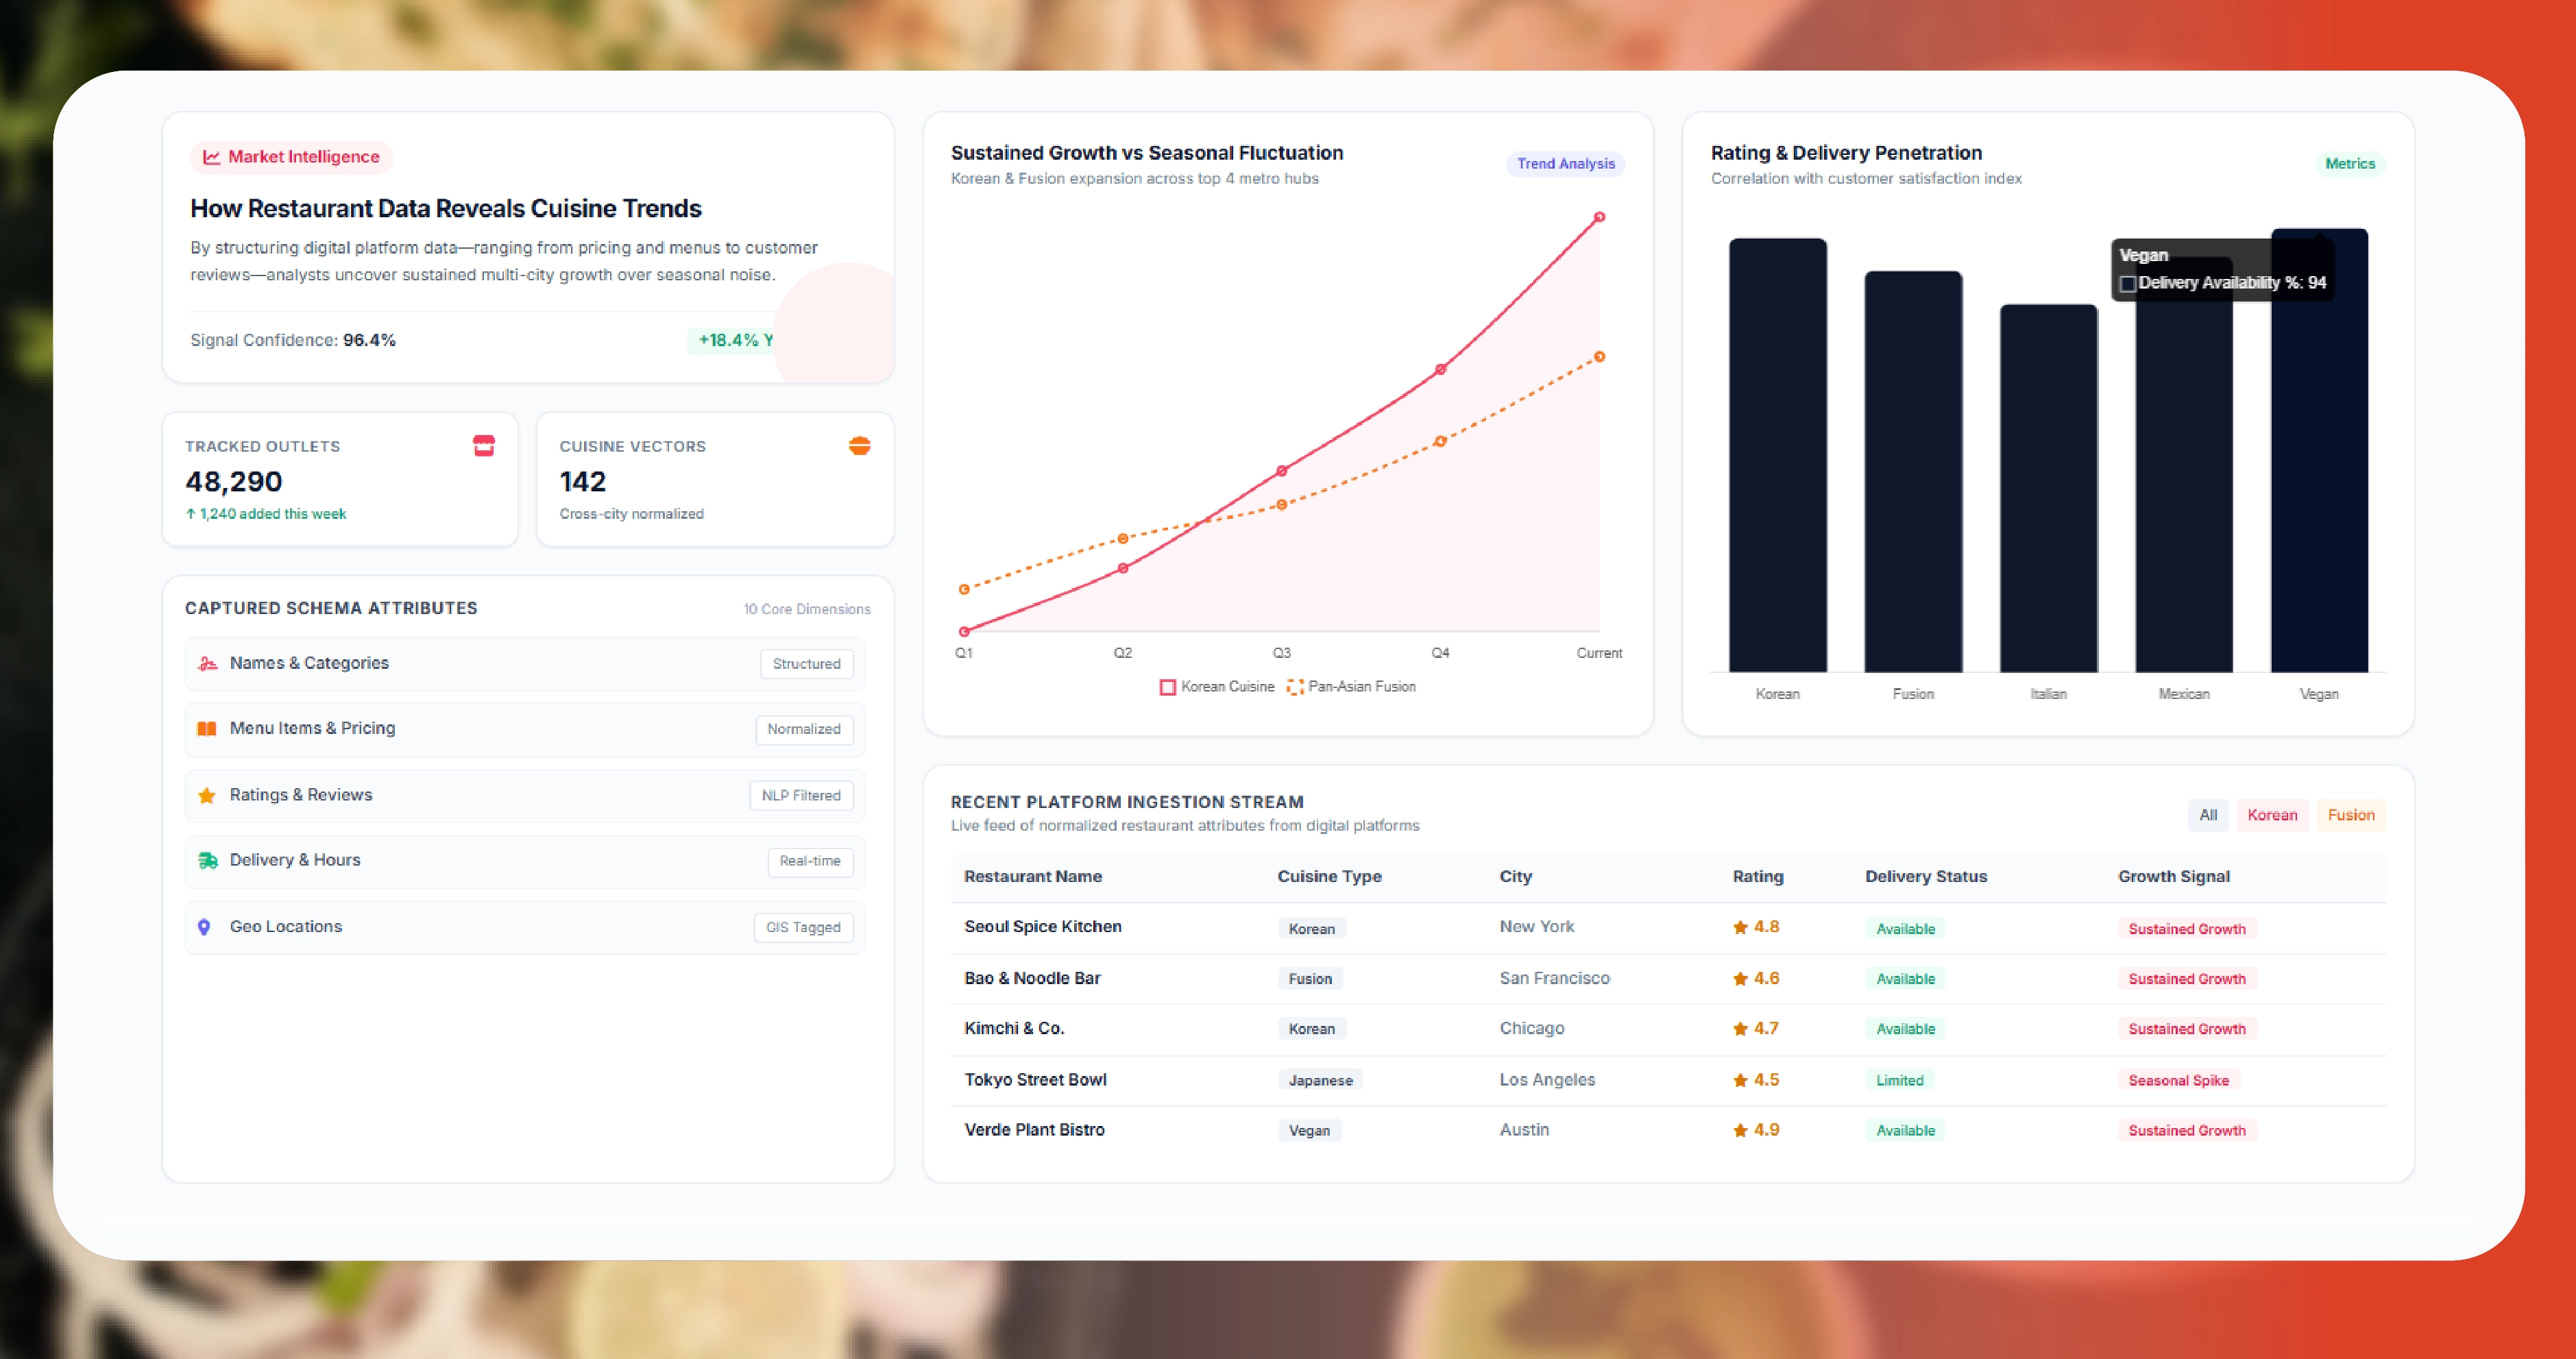
Cuisine and Restaurant Trends Analysis begins with collecting structured restaurant information from digital platforms. The value lies not only in gathering data but also in organizing it into consistent formats that allow comparisons across different cities and time periods.
A comprehensive dataset usually includes restaurant names, cuisine categories, menu items, pricing, ratings, delivery availability, operating hours, customer reviews, promotional campaigns, and geographic locations. Together, these attributes provide a detailed picture of local restaurant ecosystems.
For example, if several cities simultaneously experience an increase in Korean restaurants, expanded menu selections, higher customer ratings, and greater delivery availability, analysts can confidently identify sustained market growth rather than temporary popularity.
Historical data further strengthens this analysis by showing whether changes represent seasonal fluctuations or long-term shifts in consumer behavior.
Understanding Consumer Preferences Through Menu Evolution
Restaurant menus constantly adapt to changing customer expectations. New dishes appear regularly, ingredients evolve, healthier alternatives are introduced, and seasonal offerings create fresh dining experiences. Studying these menu updates provides a direct window into consumer preferences.
Rather than focusing solely on restaurant counts, businesses increasingly perform Cuisine restaurant menu trend analysis to understand how restaurants respond to market demand. Menu diversity, ingredient innovation, pricing adjustments, and category expansion often indicate where customer interests are moving.
For instance, increasing availability of high-protein meals across multiple restaurant chains may signal rising health consciousness. Similarly, rapid expansion of regional street food menus could reflect growing consumer interest in authentic local flavors.
Restaurants also revise beverage selections, dessert offerings, children's menus, and family meal packages based on customer purchasing behavior. Monitoring these changes across hundreds or thousands of restaurants helps businesses anticipate future dining trends before they become widely recognized.
Comparing Cuisine Performance Across Cities
One of the greatest advantages of structured restaurant data is the ability to compare cuisine performance across multiple geographic markets using standardized metrics.
| City | Restaurants Tracked | Leading Cuisine | Average Rating | Average Menu Items | Average Meal Price |
|---|---|---|---|---|---|
| Mumbai | 8,420 | North Indian | 4.4 | 126 | ₹415 |
| Bengaluru | 7,180 | South Indian | 4.5 | 132 | ₹385 |
| Delhi | 9,140 | Mughlai | 4.3 | 138 | ₹445 |
| Hyderabad | 5,760 | Biryani | 4.6 | 117 | ₹365 |
| Chennai | 5,310 | Seafood | 4.4 | 108 | ₹395 |
| Pune | 4,880 | Italian | 4.3 | 101 | ₹430 |
These comparisons highlight regional strengths that may remain hidden in nationwide reports. While North Indian cuisine dominates one market, seafood or Italian dining may lead another. Such insights enable restaurant brands to adapt expansion strategies according to local demand instead of applying a uniform business model everywhere.
Businesses also evaluate pricing differences, menu diversity, customer satisfaction, and restaurant density to determine whether a city represents an emerging opportunity or an already saturated market.
The Role of Menu-Level Intelligence
Restaurant categories alone provide only a partial understanding of the market. Much richer insights emerge from analyzing the actual menu offerings available within each cuisine.
Cuisine Trend Analysis from Restaurant Menus examines menu composition, ingredient usage, cooking styles, dish variety, premium offerings, seasonal additions, and product innovation. This deeper analysis reveals how restaurants compete within the same cuisine category.
For example, two Italian restaurants may both serve pizza and pasta, but one may specialize in gourmet ingredients while another focuses on affordable family dining. Understanding these distinctions helps businesses evaluate market positioning more accurately.
Menu intelligence also identifies recurring patterns such as increased vegetarian options, growing demand for fusion cuisine, premium desserts, healthier beverages, or locally inspired recipes. These signals often appear months before they are reflected in conventional market reports.
Restaurants that consistently innovate their menus frequently demonstrate stronger customer engagement and improved long-term competitiveness.
Competitive Intelligence for Restaurant Expansion
Restaurant expansion involves substantial investment, making reliable market intelligence essential before entering a new location. Structured restaurant datasets help decision-makers evaluate competition objectively instead of relying on assumptions.
A city-level restaurant analytics platform combines restaurant locations, menu information, customer ratings, pricing, promotions, and operational details into a centralized system that supports expansion planning.
Businesses can identify neighborhoods with growing demand, compare competitor pricing, measure cuisine saturation, and evaluate customer satisfaction before selecting new restaurant locations. This reduces investment risk while increasing the likelihood of long-term success.
Rather than simply identifying where restaurants exist, analytics platforms reveal how they perform and how competitive each local market has become.
Using Data to Build Smarter Restaurant Menus
Understanding customer preferences is only the first step. The real business value comes from transforming those insights into practical decisions that improve menu performance and customer satisfaction. Restaurant operators increasingly rely on data rather than intuition when deciding which dishes to introduce, discontinue, or promote.
A restaurant serving urban professionals, for example, may notice growing demand for healthy lunch bowls, protein-rich meals, and low-calorie beverages. Another restaurant in a tourist destination may observe higher demand for local specialties and signature desserts. Without analyzing market-wide menu information, these opportunities can remain unnoticed.
This is where Cuisine menu optimization intelligence plays a significant role. By comparing competitor menus, ingredient combinations, portion sizes, pricing structures, and customer preferences, restaurants can refine their offerings based on measurable market evidence instead of assumptions. Menu optimization also helps businesses maintain the right balance between innovation and operational efficiency, ensuring that new dishes satisfy customer expectations without increasing kitchen complexity or food waste.
Restaurant groups operating across multiple cities benefit even more because they can adapt menus according to regional tastes. Instead of offering identical products nationwide, they can create localized menus that better reflect customer demand in each market.
Benchmarking Restaurants Through Structured Menu Data
Restaurant benchmarking has become far more sophisticated than simply comparing prices. Businesses now evaluate multiple operational indicators simultaneously, including menu diversity, customer ratings, promotional activity, cuisine specialization, delivery performance, and product innovation.
One of the most valuable resources for this purpose is Cuisine-wise Menu Data, which allows analysts to compare restaurants within the same cuisine category using standardized metrics. Structured datasets make it possible to measure not only how many dishes restaurants offer but also how frequently menus are updated, how pricing differs across cities, and how customers respond to those changes.
The availability of historical menu data also enables long-term benchmarking. Analysts can determine whether restaurants are expanding their product portfolios, introducing premium offerings, or focusing on value-based dining experiences. Such comparisons reveal competitive strategies that may otherwise remain hidden.
Unlock city-wise cuisine insights with Food Data Scrape's restaurant data solutions to track menu trends, benchmark competitors, and make smarter, data-driven business decisions.
Sample Cuisine Benchmark Across Major Cities
| Cuisine | Restaurants Monitored | Average Menu Items | Average Price | Average Customer Rating | Monthly Menu Updates | Customer Growth (%) |
|---|---|---|---|---|---|---|
| North Indian | 5,950 | 136 | ₹425 | 4.5 | 14 | 18.2 |
| South Indian | 3,680 | 108 | ₹315 | 4.4 | 10 | 15.6 |
| Chinese | 4,520 | 122 | ₹365 | 4.3 | 12 | 14.1 |
| Italian | 2,980 | 96 | ₹485 | 4.4 | 8 | 16.7 |
| Japanese | 1,760 | 82 | ₹695 | 4.6 | 9 | 19.5 |
| Mexican | 1,420 | 79 | ₹535 | 4.3 | 7 | 17.4 |
| Mediterranean | 1,050 | 73 | ₹615 | 4.5 | 6 | 18.9 |
| Thai | 1,330 | 85 | ₹555 | 4.4 | 8 | 16.3 |
The benchmark demonstrates how different cuisine categories vary in menu size, pricing, customer engagement, and product innovation. Businesses can use these metrics to identify opportunities for differentiation while maintaining competitive positioning within their target markets.
Challenges in Analyzing Cuisine Trends
Although restaurant data offers tremendous business value, building reliable cuisine intelligence requires careful attention to data quality and consistency.
Restaurant menus change frequently, promotions may appear for only a few days, and cuisine classifications often differ across platforms. The same restaurant may describe identical dishes using different names, while pricing structures vary depending on delivery zones, meal combinations, or promotional campaigns.
Duplicate restaurant listings, incomplete menu information, and inconsistent location details can also affect analytical accuracy if not properly managed. Successful restaurant intelligence programs therefore include automated validation processes, standardized classification methods, and regular data updates to maintain reliable datasets over time.
Businesses that invest in high-quality data management gain significantly more accurate insights than those relying on incomplete or outdated information.
How Food Data Scrape Can Help You?
1. Comprehensive Restaurant Data Collection
Food Data Scrape gathers accurate restaurant listings, menus, cuisine categories, pricing, ratings, and location data from multiple online platforms for market intelligence.
2. City-Wise Cuisine Trend Monitoring
Track changing cuisine preferences across cities with continuously updated datasets, helping businesses identify emerging food trends and regional customer demand patterns.
3. Competitive Menu and Pricing Analysis
Compare competitor menus, pricing strategies, promotional offers, and cuisine diversity to optimize your restaurant positioning and strengthen competitive decision-making.
4. Expansion and Market Opportunity Insights
Identify underserved markets, high-demand cuisines, and ideal expansion locations using data-driven restaurant analytics that reduce investment risks and improve planning.
5. Customized Data Delivery Solutions
Receive structured restaurant and cuisine datasets in preferred formats with scheduled updates, supporting business intelligence, analytics, research, and operational efficiency.
Conclusion
Restaurant markets change every day as new businesses open, menus evolve, prices fluctuate, and customer preferences shift across different regions. Organizations that monitor these developments through structured data gain a significant advantage in understanding how local food cultures influence commercial success. Instead of relying on assumptions or infrequent market surveys, businesses can make informed decisions using continuously updated restaurant intelligence.
A comprehensive Cuisine Demand Tracker enables companies to identify high-growth cuisine categories, compare regional performance, and monitor changing consumer preferences with greater accuracy. Combined with a structured Menu Pricing Dataset, organizations can benchmark competitors, evaluate pricing strategies, and understand how menu positioning varies across cities. When supported by reliable Restaurant Menu Data Scraping, these insights become the foundation for smarter restaurant expansion, menu innovation, competitive benchmarking, and long-term market planning in an increasingly data-driven food industry.
If you are seeking for a reliable data scraping services, Food Data Scrape is at your service. We hold prominence in Food Data Aggregator and Mobile Restaurant App Scraping with impeccable data analysis for strategic decision-making.