
Introduction
Grocery retailers can lose sales in minutes when popular products disappear from shelves, apps, or dark stores. For brands, marketplaces, and retailers, scraping Out-of-Stock Rates provides a systematic way to measure product availability, identify recurring stockouts, and understand where customers encounter unavailable items. Instead of relying on occasional store audits, businesses can continuously collect online availability signals across retailers, cities, categories, and individual SKUs.
grocery out-of-stock rate analysis helps businesses transform raw availability observations into measurable insights. A retailer might appear well stocked overall while experiencing severe shortages in high-demand products, specific neighborhoods, or particular pack sizes. Tracking these differences reveals operational weaknesses that conventional sales reports can easily overlook.
Why Out-of-Stock Rates Matter in Grocery Retail?
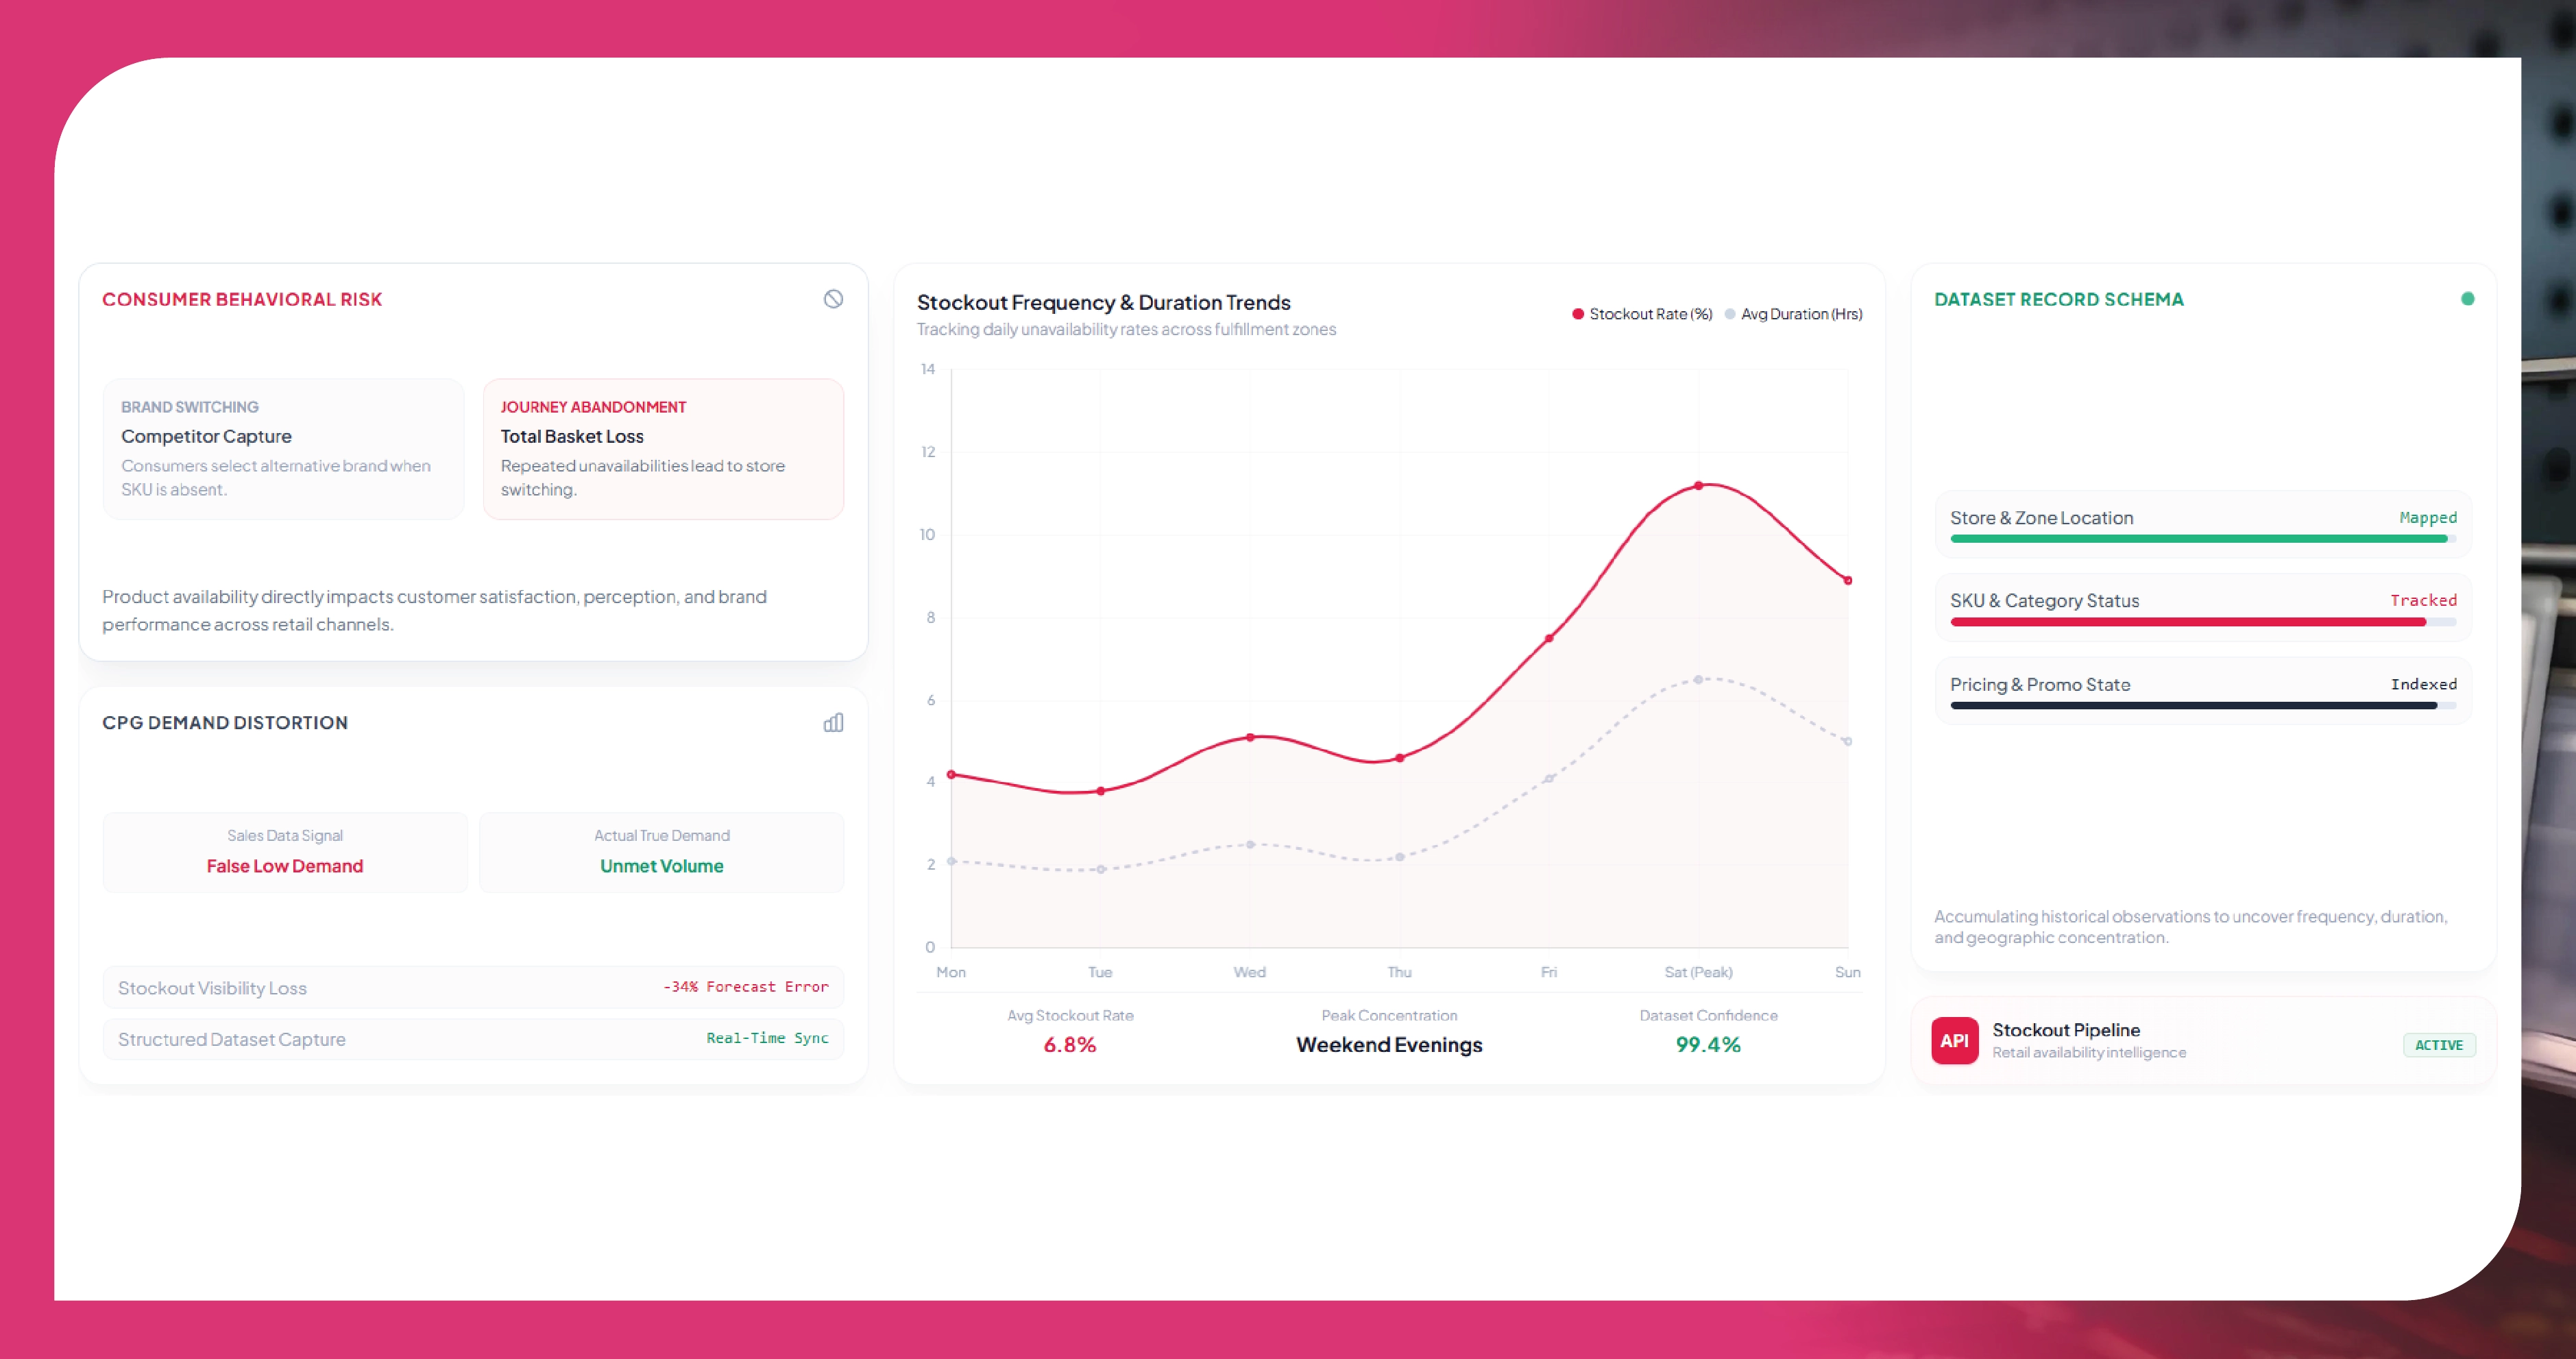
Product availability directly influences revenue, customer satisfaction, brand perception, and retailer performance. When consumers search for a product and repeatedly find it unavailable, they may switch brands, choose another retailer, postpone their purchase, or abandon the shopping journey completely.
For CPG companies, stockouts create another problem: lost visibility into actual demand. If a product sells fewer units because it was unavailable, sales data alone may incorrectly suggest weak consumer interest.
An effective grocery stock-out rate dataset captures availability observations over time and converts them into structured intelligence. Typical records can include retailer, store or fulfillment location, SKU, product category, product name, listed price, promotional status, availability status, timestamp, city, and delivery zone.
Once historical data is accumulated, businesses can calculate stockout frequency, duration, geographic concentration, and retailer-specific performance.
What Is an Out-of-Stock Rate?
An out-of-stock rate generally represents the percentage of observed product availability instances where an item is unavailable.
For example, if a SKU is checked 100 times and appears unavailable during 12 observations, its observed out-of-stock rate is 12%.
The same methodology can be expanded across:
- Individual SKUs
- Product categories
- Retailers
- Cities
- Stores
- Dark stores
- Delivery zones
- Time periods
- Promotions
- Brands
- Pack sizes
This creates a much more detailed picture than a simple "in stock" or "out of stock" label.
Building an SKU-Level Availability Monitoring System
SKU-level out-of-stock monitoring allows businesses to identify exactly which products are repeatedly unavailable. This is particularly valuable for fast-moving consumer goods where small differences in pack size, flavor, brand, or formulation can affect availability.
A monitoring system can periodically capture product pages from grocery websites, quick-commerce platforms, supermarket applications, and retailer marketplaces. The collected information can then be normalized so that identical products are recognized across different retailers.
For example, a 1-liter branded milk product may appear with different titles across three platforms. Product identifiers, brand names, pack sizes, categories, and other attributes can help create a consistent SKU identity.
Historical records then make it possible to determine whether a stockout was temporary, recurring, seasonal, geographically concentrated, or associated with unusual demand.
Comparing Stockout Rates Across Retailers
Out-of-stock rates by retailer scraping enables businesses to compare availability performance across competing grocery platforms.
Suppose a consumer electronics-style availability dashboard shows that Retailer A maintains 94% availability for a particular category, Retailer B maintains 88%, and Retailer C maintains 79%. The difference becomes commercially meaningful when evaluated across thousands of products and multiple time periods.
Retailers can benchmark their own performance against competitors, while brands can identify which retail partners consistently provide better product availability.
The analysis can also reveal whether a retailer performs strongly overall but struggles with particular categories, brands, cities, or fulfillment models.
Measuring Promotional Availability
Promotions can dramatically increase demand, making stock availability particularly important during discounted periods.
Promotional stock availability scraping connects promotional activity with product availability. Data collection can identify whether an item is discounted, featured, bundled, or otherwise promoted and then compare its availability before, during, and after the promotion.
This creates valuable questions for retailers and brands:
- Did stockouts increase after a promotion started?
- Were promoted SKUs replenished quickly?
- Which retailers maintained sufficient inventory?
- Which cities experienced the highest availability deterioration?
- Did a promotion create sustained demand after the discount ended?
These insights can improve promotion planning, inventory allocation, and replenishment strategies.
City-Level Stockout Intelligence
Retail availability can vary significantly from one location to another because of differences in demand, inventory, logistics, store density, weather, events, and consumer preferences.
With the ability to scrape compare stock-out rates across cities, businesses can identify geographic patterns that would otherwise remain hidden.
For instance, a beverage brand may have excellent availability in Delhi but frequent stockouts in Mumbai. A quick-commerce category could show strong availability in Bengaluru but substantially weaker coverage in Hyderabad.
City-level comparisons help companies prioritize inventory investments, investigate fulfillment gaps, and understand local demand pressures.
Real-Time Product Availability Tracking
Real-Time Product Stock Tracking provides a more responsive view of retail inventory conditions.
Rather than analyzing availability once a month, businesses can schedule automated collection at suitable intervals. Depending on the use case, data can be gathered hourly, several times per day, daily, or according to specific operational requirements.
Real-time or near-real-time monitoring can help identify sudden availability changes, especially for fast-moving grocery products.
A sudden increase in stockouts could indicate:
- Unexpected demand
- Supply-chain disruption
- Replenishment delays
- Promotion-driven demand
- Store-level inventory issues
- Regional logistics problems
- Product discontinuation
- Catalog changes
Alerts can then notify analysts or operations teams when predefined thresholds are exceeded.
What Data Can Be Collected?
A robust grocery availability dataset can contain much more than stock status. Depending on platform structure and business requirements, collection can include product name, SKU, brand, category, pack size, listed price, discounted price, availability, promotion status, retailer, store, city, delivery location, timestamp, product URL, and related metadata.
Price and availability data become particularly powerful when analyzed together.
A product that becomes unavailable immediately after a major discount may indicate demand exceeding inventory. Conversely, a product that remains available but experiences a substantial price increase could indicate changing supply conditions.
Combining these signals creates a richer retail intelligence layer.
From Raw Data to Actionable Insights
Simply collecting stockout observations is not enough. Businesses need a structured analytical workflow.
First, product records should be standardized and duplicates removed. Next, availability states should be classified consistently. Historical observations can then be aggregated by SKU, retailer, location, category, and time period.
Analytical dashboards can display:
- Overall out-of-stock percentage
- Top stockout SKUs
- Stockout rates by retailer
- Availability by city
- Average stockout duration
- Promotional availability
- Category-level availability
- Brand-level availability
- Availability trends over time
Threshold-based alerts can highlight products whose stockout rate suddenly exceeds an acceptable level.
Business Benefits of Monitoring Grocery Stockouts
For retailers, availability intelligence can support replenishment decisions and store-level performance management. For brands, it can expose distribution problems and help evaluate retail execution.
Marketplaces can use availability information to improve catalog quality and identify products that repeatedly fail to meet customer expectations.
Investors and market researchers can also use historical availability patterns as an additional indicator of consumer demand, competitive strength, and operational execution.
Perhaps most importantly, stockout monitoring helps distinguish between "low sales" and "low availability." Those two conditions can look similar in traditional sales reports but require completely different business responses.
How Food Data Scrape Can Help You?
1. Continuous Availability Monitoring
Food Data Scrape can collect recurring product availability observations across selected grocery platforms, helping businesses identify recurring stockouts and measure availability changes throughout different time periods.
2. SKU and Retailer Benchmarking
It can organize availability information by SKU, brand, category, and retailer, allowing teams to compare stockout performance and identify products or retail partners requiring closer operational attention.
3. Geographic Stockout Analysis
Food Data Scrape can structure location-level availability signals across cities and delivery zones, helping businesses uncover geographic stockout patterns and prioritize inventory or replenishment improvements.
4. Promotion Impact Measurement
By connecting promotional indicators with availability observations, Food Data Scrape can help businesses determine whether discounts, campaigns, and featured placements contribute to increased stockout frequency.
5. Historical Retail Intelligence
Continuous data collection creates historical availability records that businesses can analyze alongside prices, promotions, and product information to uncover trends, operational gaps, and emerging market opportunities.
Conclusion
Grocery availability is no longer simply an operational metric; it is a powerful source of competitive and market intelligence. When businesses Scrape Grocery Retail Stockout Data, they can understand where products disappear, how frequently stockouts occur, and which retailers or locations experience the greatest availability challenges.
Modern Food Data Scraping can bring together product, pricing, promotional, location, and availability information into structured datasets that support better retail decisions. This intelligence can strengthen replenishment strategies, improve retailer benchmarking, and reveal demand patterns that sales data alone may miss.
For quick-commerce businesses and dark-store operators, the opportunity becomes even broader. Organizations can Scrape Dark Store Stock & Pricing Data to monitor inventory conditions alongside competitive pricing, helping them understand both product availability and market positioning.
The result is a more complete view of grocery retail performance—one that connects what products cost, where they are available, when they disappear, and how those patterns change over time.
Ready to turn grocery stockout signals into actionable retail intelligence? Connect with Food Data Scrape to build a scalable product availability and out-of-stock monitoring solution tailored to your business.
If you are seeking for a reliable data scraping services, Food Data Scrape is at your service. We hold prominence in Food Data Aggregator and Mobile Restaurant App Scraping with impeccable data analysis for strategic decision-making.
Get a Free Food Data Sample in 48 Hours.
Tell us your platforms, target markets and required fields — we'll map exactly what's possible with food data scraping, recommend the right approach, and send a working sample so you can verify quality before any commitment.
Request a strategy call
Thanks — our data team will reach out within 48 hours with your sample.



