Introduction
Staple food price tracking means recording what dal, rice, atta and cooking oil actually cost, by pack size and pin code, on a fixed schedule. Done well, it compares app prices with official benchmarks, converts every pack to a price per kg or litre, and flags real price moves instead of noise.
This matters more in October 2026. India's retail inflation rose to 5.54% in September 2026, and food inflation reached 7.74%, according to the latest MoSPI release. Grocery buyers, brands and apps all feel these moves first in everyday staples.
This guide shows how to build a tracker step by step. It covers the official sources to start with, the five main apps, the fields to capture and how to clean the data. It is a how-to, not a sales page.
Why does staple food price tracking matter in 2026?
Staples carry weight in household budgets, so small price changes travel fast. Brands use them to set pack prices, apps use them to stay competitive, and analysts use them to read food inflation early.
The official numbers released this month show why timing matters. The table below lists the key figures, each with its date and source.
| Indicator | Value | Period / date | Source |
|---|---|---|---|
| All-India CPI inflation (combined, provisional) | 5.54% | September 2026 (released 12 Oct 2026) | MoSPI CPI press release |
| All-India CPI inflation (combined, final) | 4.83% | August 2026 | MoSPI CPI press release |
| Consumer Food Price Index inflation (combined) | 7.74% | September 2026 | MoSPI CPI press release |
| Rural food inflation | 8.06% | September 2026 | MoSPI CPI press release |
| Onion inflation (top high-inflation item) | 108.09% | September 2026 | MoSPI CPI press release |
| RBI policy repo rate | 5.50% (up 25 bps) | MPC decision, 7 Oct 2026 | RBI MPC resolution |
| RBI CPI projection for 2026-27 | 5.2% (Q3: 6.0%) | Projection made 7 Oct 2026 | RBI MPC resolution |
The new CPI series uses base year 2024=100. The RBI also noted that food price increases have become more broad based, with spikes in items such as sugar and onion. The CPI release does not give separate figures for pulses or edible oils, which is one reason item-level tracking is useful.
- FMCG and staples brands check whether their pack prices stay in line across apps and cities.
- Quick commerce and grocery apps compare their basket against rivals at the same pin code.
- Analysts and lenders read retail staple prices as an early signal ahead of monthly CPI data.
- Restaurants and cloud kitchens watch dal, rice and oil costs that drive menu margins.
Which official benchmarks should you track first?
Start with the government series. The Department of Consumer Affairs runs a Price Monitoring Division that tracks 22 essential commodities, collected daily at retail and wholesale level from about 550 market centres. States submit prices through a geo-tagged mobile app, as described on the Department of Consumer Affairs price monitoring page.
The list includes rice, wheat, atta, five dals (gram, tur, urad, moong and masur) and six edible oils. The fcainfoweb.nic.in price portal publishes the all-India daily averages below.
| Staple | All-India average retail price (₹/kg) | Date |
|---|---|---|
| Rice | 47.05 | 12 Oct 2026 |
| Wheat | 32.06 | 12 Oct 2026 |
| Atta (wheat) | 37.66 | 12 Oct 2026 |
| Tur / arhar dal | 128.66 | 12 Oct 2026 |
| Moong dal | 113.14 | 12 Oct 2026 |
| Gram dal | 90.88 | 12 Oct 2026 |
| Mustard oil (packed) | 204.00 | 12 Oct 2026 |
| Groundnut oil (packed) | 210.31 | 12 Oct 2026 |
| Sunflower oil (packed) | 191.20 | 12 Oct 2026 |
| Soya oil (packed) | 167.66 | 12 Oct 2026 |
| Palm oil (packed) | 153.50 | 12 Oct 2026 |
Source: Department of Consumer Affairs, Price Monitoring Division, all-India average retail prices as on 12 October 2026. These are averages for fair average quality, not branded premium packs.
That gap is the point. App prices for a branded 5 kg atta or a 1 litre oil pouch will differ from the government average. Tracking both shows whether a move comes from the market or from one platform's pricing.
How do Blinkit, Zepto, Instamart, BigBasket and JioMart differ for price tracking?
Each app shows prices tied to a delivery location. The same product can show a different price, stock status or offer depending on the pin code you set. Treat the location as part of every price record.
| Platform | What a price record depends on | What to watch for staples |
|---|---|---|
| Blinkit | Delivery pin code and the store serving it | Pack-size variety in atta and rice; out-of-stock flags on popular dals |
| Zepto | Delivery pin code and serving store | Short-lived offers and combo packs that change the per-kg price |
| Swiggy Instamart | Delivery pin code and serving store | Bank and app offers shown beside the listed price; record them separately |
| BigBasket | Delivery location and delivery option chosen | Own-label staples next to national brands; larger bulk packs |
| JioMart | Delivery pin code | Bulk packs and multi-buy offers on oils and rice |
Note: the table describes what to record for each platform, not how any app sets its prices. Check each app's current layout before you start, because listing pages change often.
The 10 data fields every staple price tracker needs
A good tracker captures enough detail to compare like with like. These fields cover most needs.
- Capture time. Date and time of each observation, stored in IST.
- Platform. Which app the price came from.
- Pin code and city. The delivery location used for the check.
- Product name and brand. As shown on the listing, plus an own-label flag.
- Category. Dal type, rice type, atta, or oil type, mapped to a standard list.
- Pack size and unit. For example 1 kg, 5 kg, 1 litre or 5 litre.
- MRP and selling price. Both values, so the discount can be calculated.
- Price per kg or litre. Selling price divided by pack size, for fair comparison.
- Stock status. In stock, low stock or out of stock at that pin code.
- Offer text. Combo, coupon or bank offer, kept apart from the listed price.
Add an internal product ID that links the same item across apps. Without it, comparisons break as soon as names differ slightly.
How to collect, clean and match the data
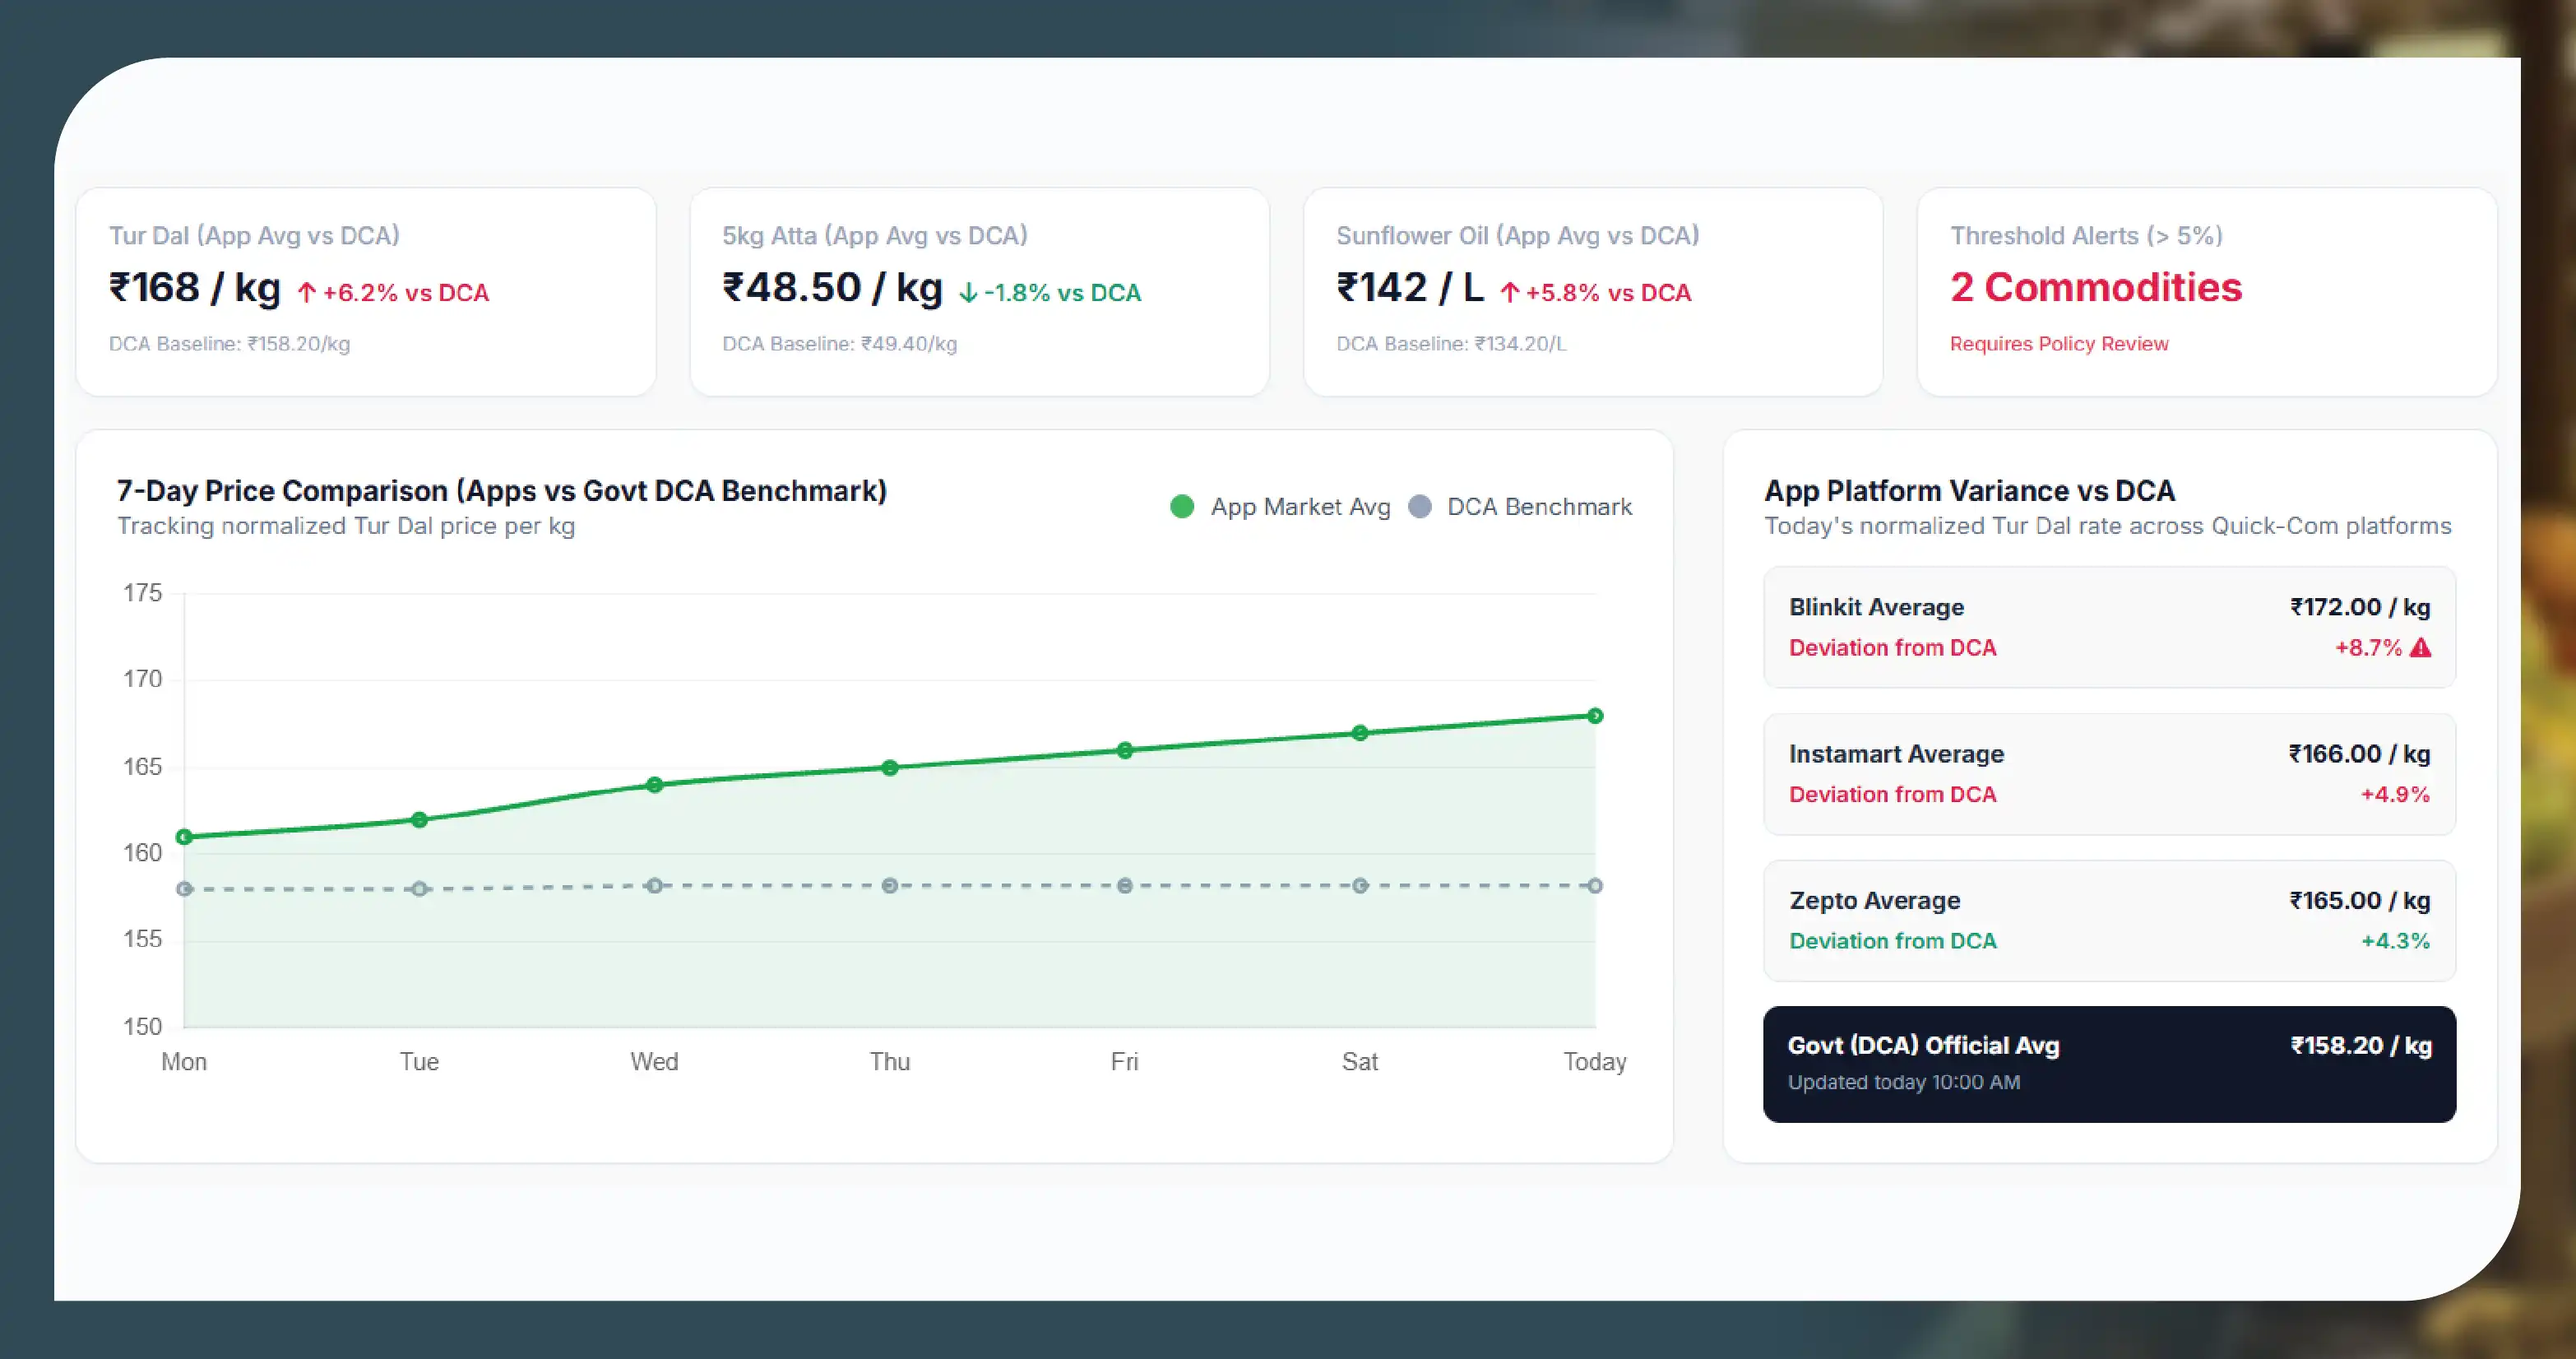
Use these six steps to turn raw listings into a usable staple food price tracking dataset.
Step 1: Define the basket
Pick 20 to 40 items that match how people really buy. Include at least one tur dal, one basmati and one non-basmati rice, a 5 kg atta and two oils. Mix national brands and own labels.
Step 2: Choose pin codes
Pick pin codes per city that reflect different income areas. Keep the list fixed so you compare the same places every week.
Step 3: Set the schedule
Daily checks suit fast-moving items like oils and dals. Weekly checks often work for rice and atta. Capture at the same time of day to avoid timing bias.
Step 4: Normalise prices
Convert every pack to price per kg or litre. Keep MRP, selling price and offers in separate columns so you can see real price changes and short promotions.
Step 5: Match products
Match items across apps using brand, variant and pack size. Review uncertain matches by hand; a 1 kg and a 1.5 kg pack should never count as the same item.
Step 6: Compare with benchmarks
Set each app's per-kg price beside the Department of Consumer Affairs daily average. Flag moves above a threshold you choose, such as a week-on-week change of 5 percent (pick the threshold that suits your category).
Tracking strategy by staple category
Each staple behaves differently, so set rules per category.
| Category | Normalise to | Packs to compare | Official benchmark | Suggested cadence |
|---|---|---|---|---|
| Dal (tur, moong, gram, urad, masur) | ₹ per kg | 500 g, 1 kg | DoCA daily retail price for each dal | Daily |
| Rice (basmati and non-basmati) | ₹ per kg | 1 kg, 5 kg, 10 kg | DoCA rice average; MoSPI CPI monthly | Weekly |
| Atta (wheat flour) | ₹ per kg | 5 kg, 10 kg | DoCA atta average | Weekly |
| Cooking oil (mustard, sunflower, soya, groundnut, palm) | ₹ per litre or kg as labelled | 1 litre pouch or bottle, 5 litre can | DoCA packed oil prices (₹/kg) | Daily |
| Average basket | ₹ per basket | Fixed basket per pin code | MoSPI food inflation trend | Weekly |
Oils need care. Government averages are in ₹ per kg, while many packs are sold by volume. Record the unit exactly as labelled and convert only with a stated density rule.
Use cases
- A quick commerce app launching in India can compare its staples basket against established apps at the same pin codes before setting launch prices.
- An Indian grocery comparison app can show users the lowest per-kg price for dal or atta near them, using pin-code level records.
- A staples brand can check whether its 5 kg atta sells below MRP on one app and flag discount leakage.
- A research or lending team can watch weekly basket costs ahead of the next monthly CPI release, due on 12 November 2026 for October data.
- A restaurant group can track oil and dal input costs across cities to plan menu prices.
Food Data Scrape has handled requests for Blinkit and wider quick commerce datasets of this kind.
Legal and compliance basics
Keep the tracker to public business data and respect each site's rules.
- Public data only. Collect product, price, pack and stock data visible to any shopper. Never collect customer or personal data.
- No bypassing. Do not get around logins, CAPTCHAs, paywalls or other security controls.
- Respect site rules. Check robots.txt and terms of service, and keep request rates low.
- Label sources. Show the platform, pin code and capture time with every price you publish.
- Seek advice.platform terms review with legal before publishing
Staple food price tracking vs FMCG price monitoring: which do you need?
Staple food price tracking follows a small basket of everyday commodities against official benchmarks. FMCG price monitoring covers many brands and SKUs across categories, often for commercial pricing teams. If you need the wider service, see our India FMCG price monitoring page.
You can build a small tracker yourself for a few items and pin codes. It gets harder as you add cities, handle layout changes and match thousands of listings. Buying data makes sense when you need many pin codes, daily updates or a delivered feed.
| Factor | Build in-house | Use a data provider |
|---|---|---|
| Setup time | Weeks of engineering | Sample data first, then a scheduled feed |
| Maintenance | Your team fixes broken collectors | Provider maintains collection |
| Product matching | Manual rules you maintain | Matched IDs in delivered data |
| Delivery | Your own database | CSV, Excel, JSON, API or dashboard |
| Best for | A handful of items and cities | Many pin codes, apps and daily cadence |
When choosing a provider, ask how they normalise pack sizes, how they match products, and how they show capture time and pin code. Ask for a sample before you commit.
Get a free sample dataset. Want to see dal, rice, atta and cooking oil prices by pin code across Blinkit, Zepto, Instamart, BigBasket and JioMart? Ask for a sample with per-kg prices, stock status and capture times. Contact sales to describe your basket, cities and cadence.
Questions
Frequently Asked Questions
It is the regular recording of prices for everyday staples such as dal, rice, atta and cooking oil, by pack size, location and date. The goal is to compare prices fairly over time and across sellers.
The Department of Consumer Affairs publishes daily all-India average retail and wholesale prices for 22 essential commodities on fcainfoweb.nic.in. MoSPI publishes monthly CPI data, usually around the 12th of each month.
Apps show prices, stock and offers for the store serving your delivery location. So the same product can show different prices or availability in different pin codes.
Daily for fast-moving items like dals and cooking oils, and weekly for rice and atta usually works. Capture at the same time each day to keep data comparable.
Collecting public product and price data is common, but you must follow each site's terms of service and robots.txt, keep request rates low and never bypass logins or security. Get legal advice for your use case.
Get a Free Food Data Sample in 48 Hours.
Tell us your platforms, target markets and required fields — we'll map exactly what's possible with food data scraping, recommend the right approach, and send a working sample so you can verify quality before any commitment.
Request a strategy call
Thanks — our data team will reach out within 48 hours with your sample.