
Introduction
Grocery prices rarely stay still. Supermarkets continuously adjust prices according to supplier costs, inventory levels, demand, promotions, competitor movements, seasonality, local competition, and customer behavior. For retailers, brands, analysts, and pricing teams, understanding these movements is becoming as important as knowing the current price itself.
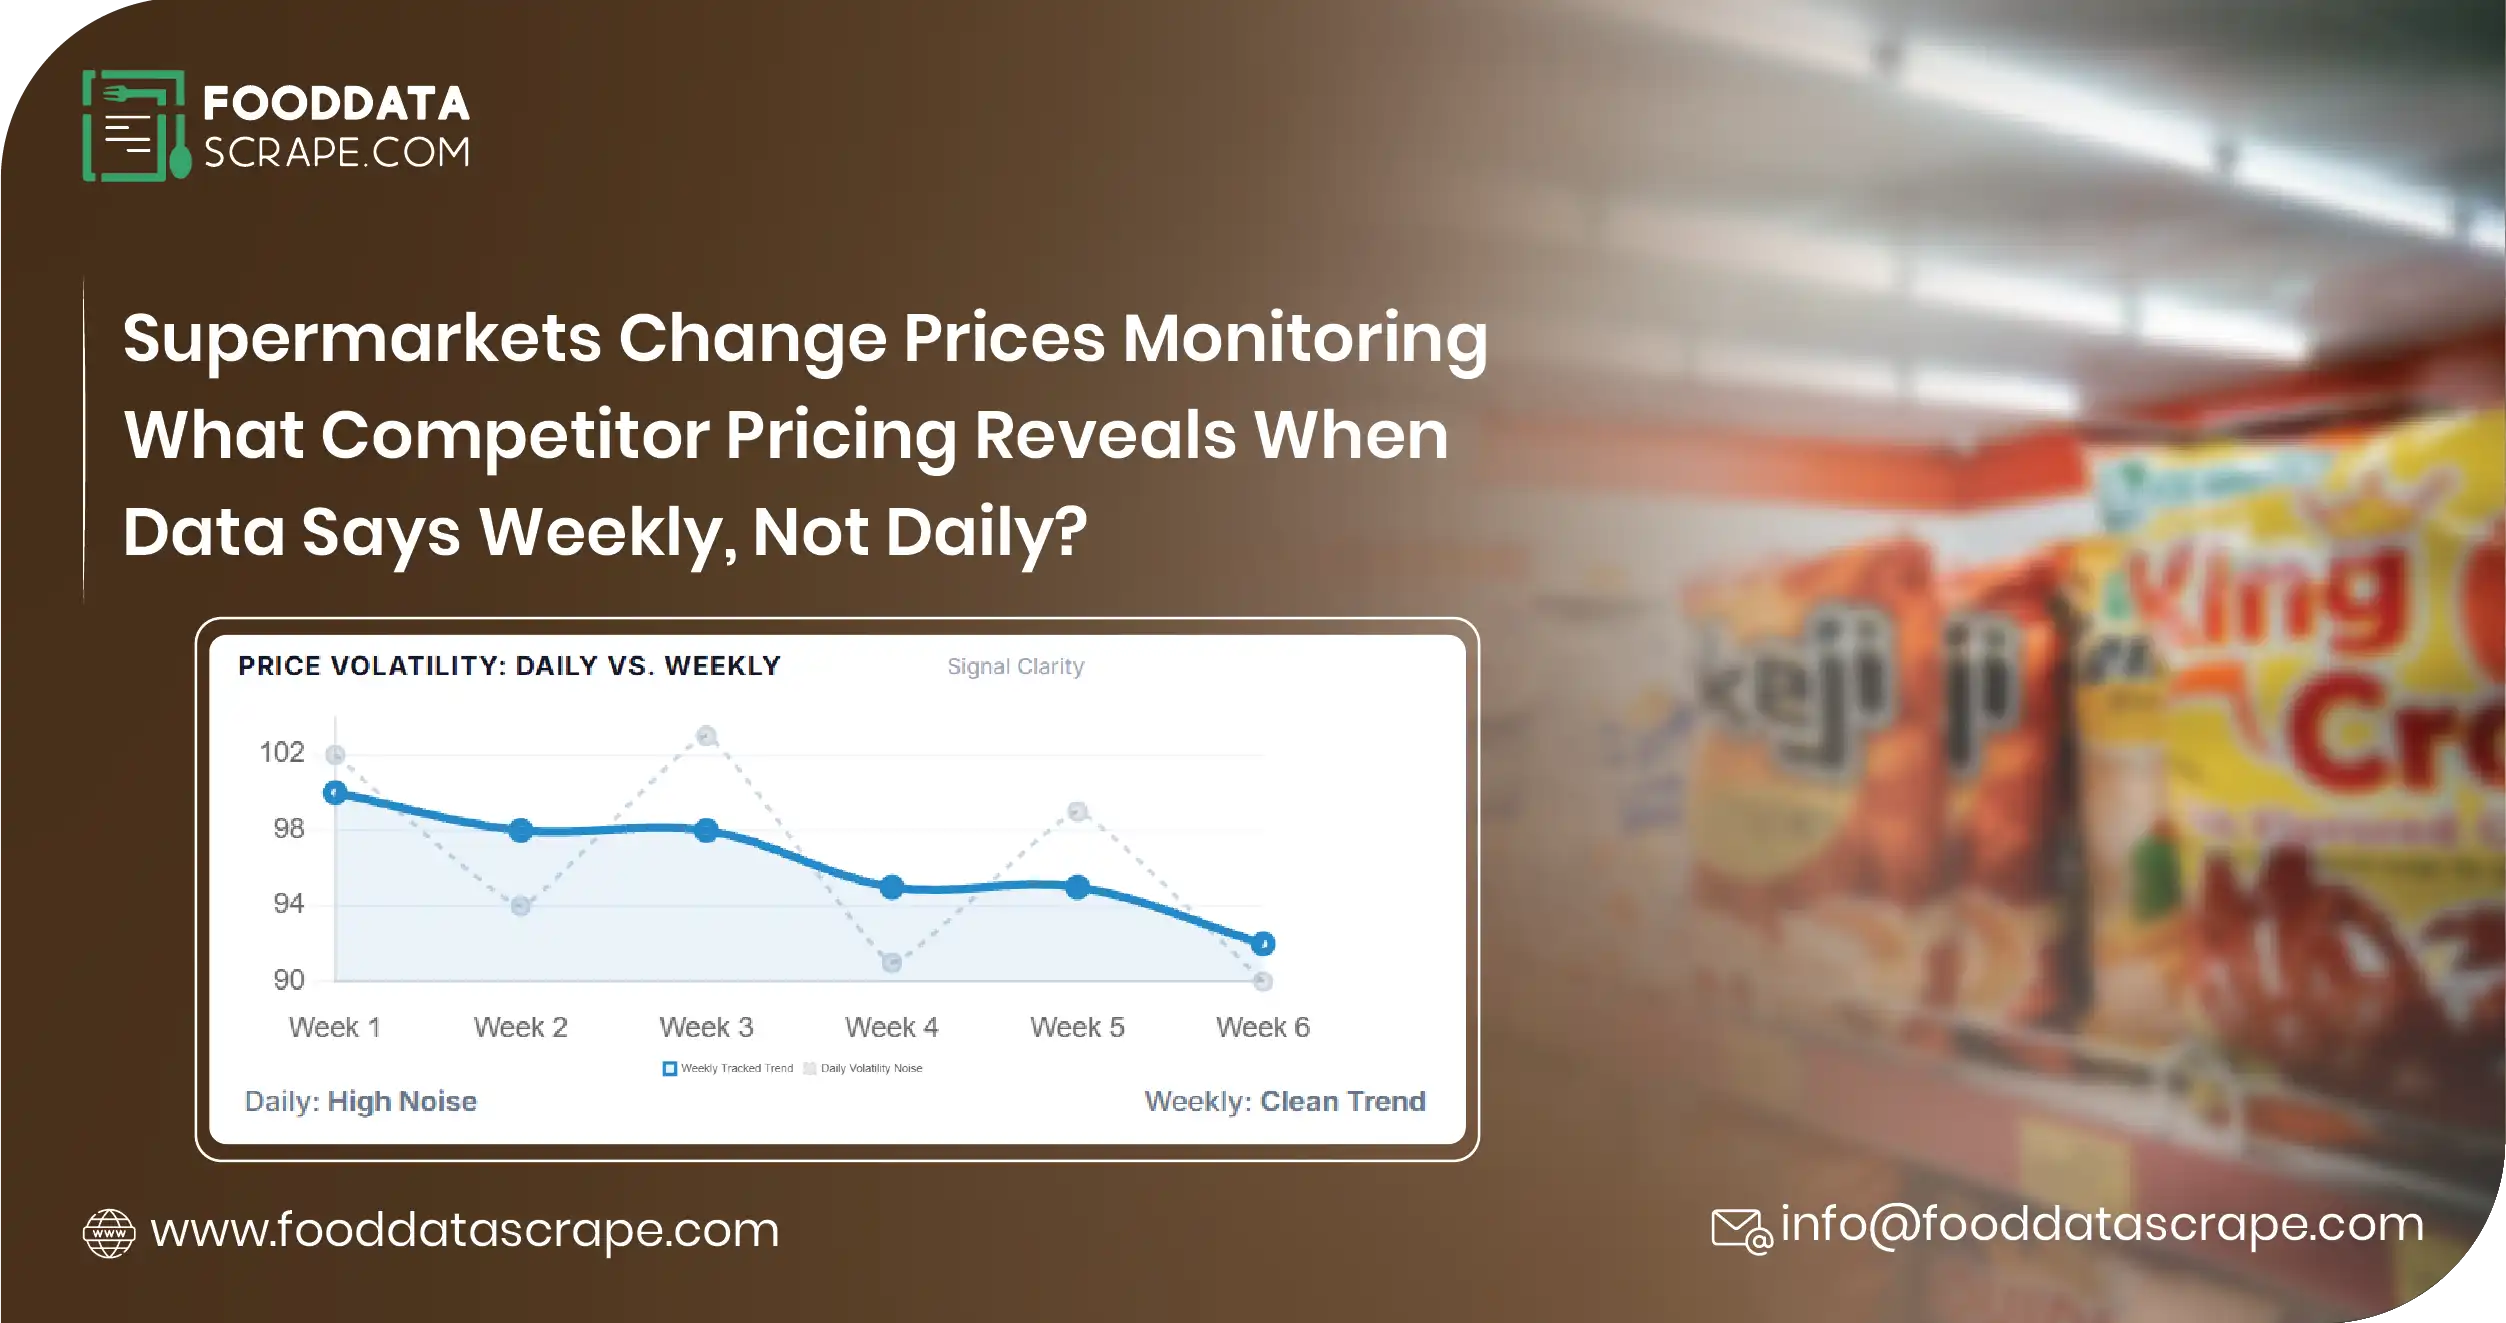
Supermarkets Change Prices monitoring helps businesses identify when, where, and how frequently products are repriced. Instead of looking at isolated prices, businesses can build a historical view of price movements across products, categories, stores, locations, and time periods.
Scrape Supermarkets price changes by weekday to understand whether Monday, midweek, Friday, or Sunday produces different pricing behavior. This type of analysis can reveal recurring repricing windows that may otherwise remain invisible in conventional market research.
Supermarkets pricing frequency analysis adds another layer by measuring how often products change prices within defined periods. A retailer may modify hundreds of prices daily, while another may maintain stable prices for weeks and rely heavily on promotional campaigns.
Modern grocery markets make this intelligence particularly valuable. Customers compare prices across multiple supermarkets, mobile applications, marketplaces, and delivery platforms before completing purchases. A small pricing difference can therefore influence store selection, basket composition, conversion, and customer loyalty.
Why Supermarket Price Monitoring Matters?
Price monitoring is no longer limited to checking whether a competitor is cheaper. Businesses increasingly need to understand the entire pricing cycle.
A historical dataset can show the original price, revised price, percentage change, timestamp, product category, brand, pack size, promotion status, store location, and availability. Combining these variables creates a detailed picture of supermarket pricing behavior.
For example, a cereal product priced at $4.99 may fall to $3.49 on Friday, remain discounted through Sunday, and return to $4.99 on Monday. Without historical tracking, the retailer only sees today's price. With continuous monitoring, the complete promotional pattern becomes visible.
This helps businesses distinguish between permanent price changes, temporary discounts, loyalty offers, clearance pricing, and recurring weekly promotions.
Understanding Weekday Versus Weekend Pricing
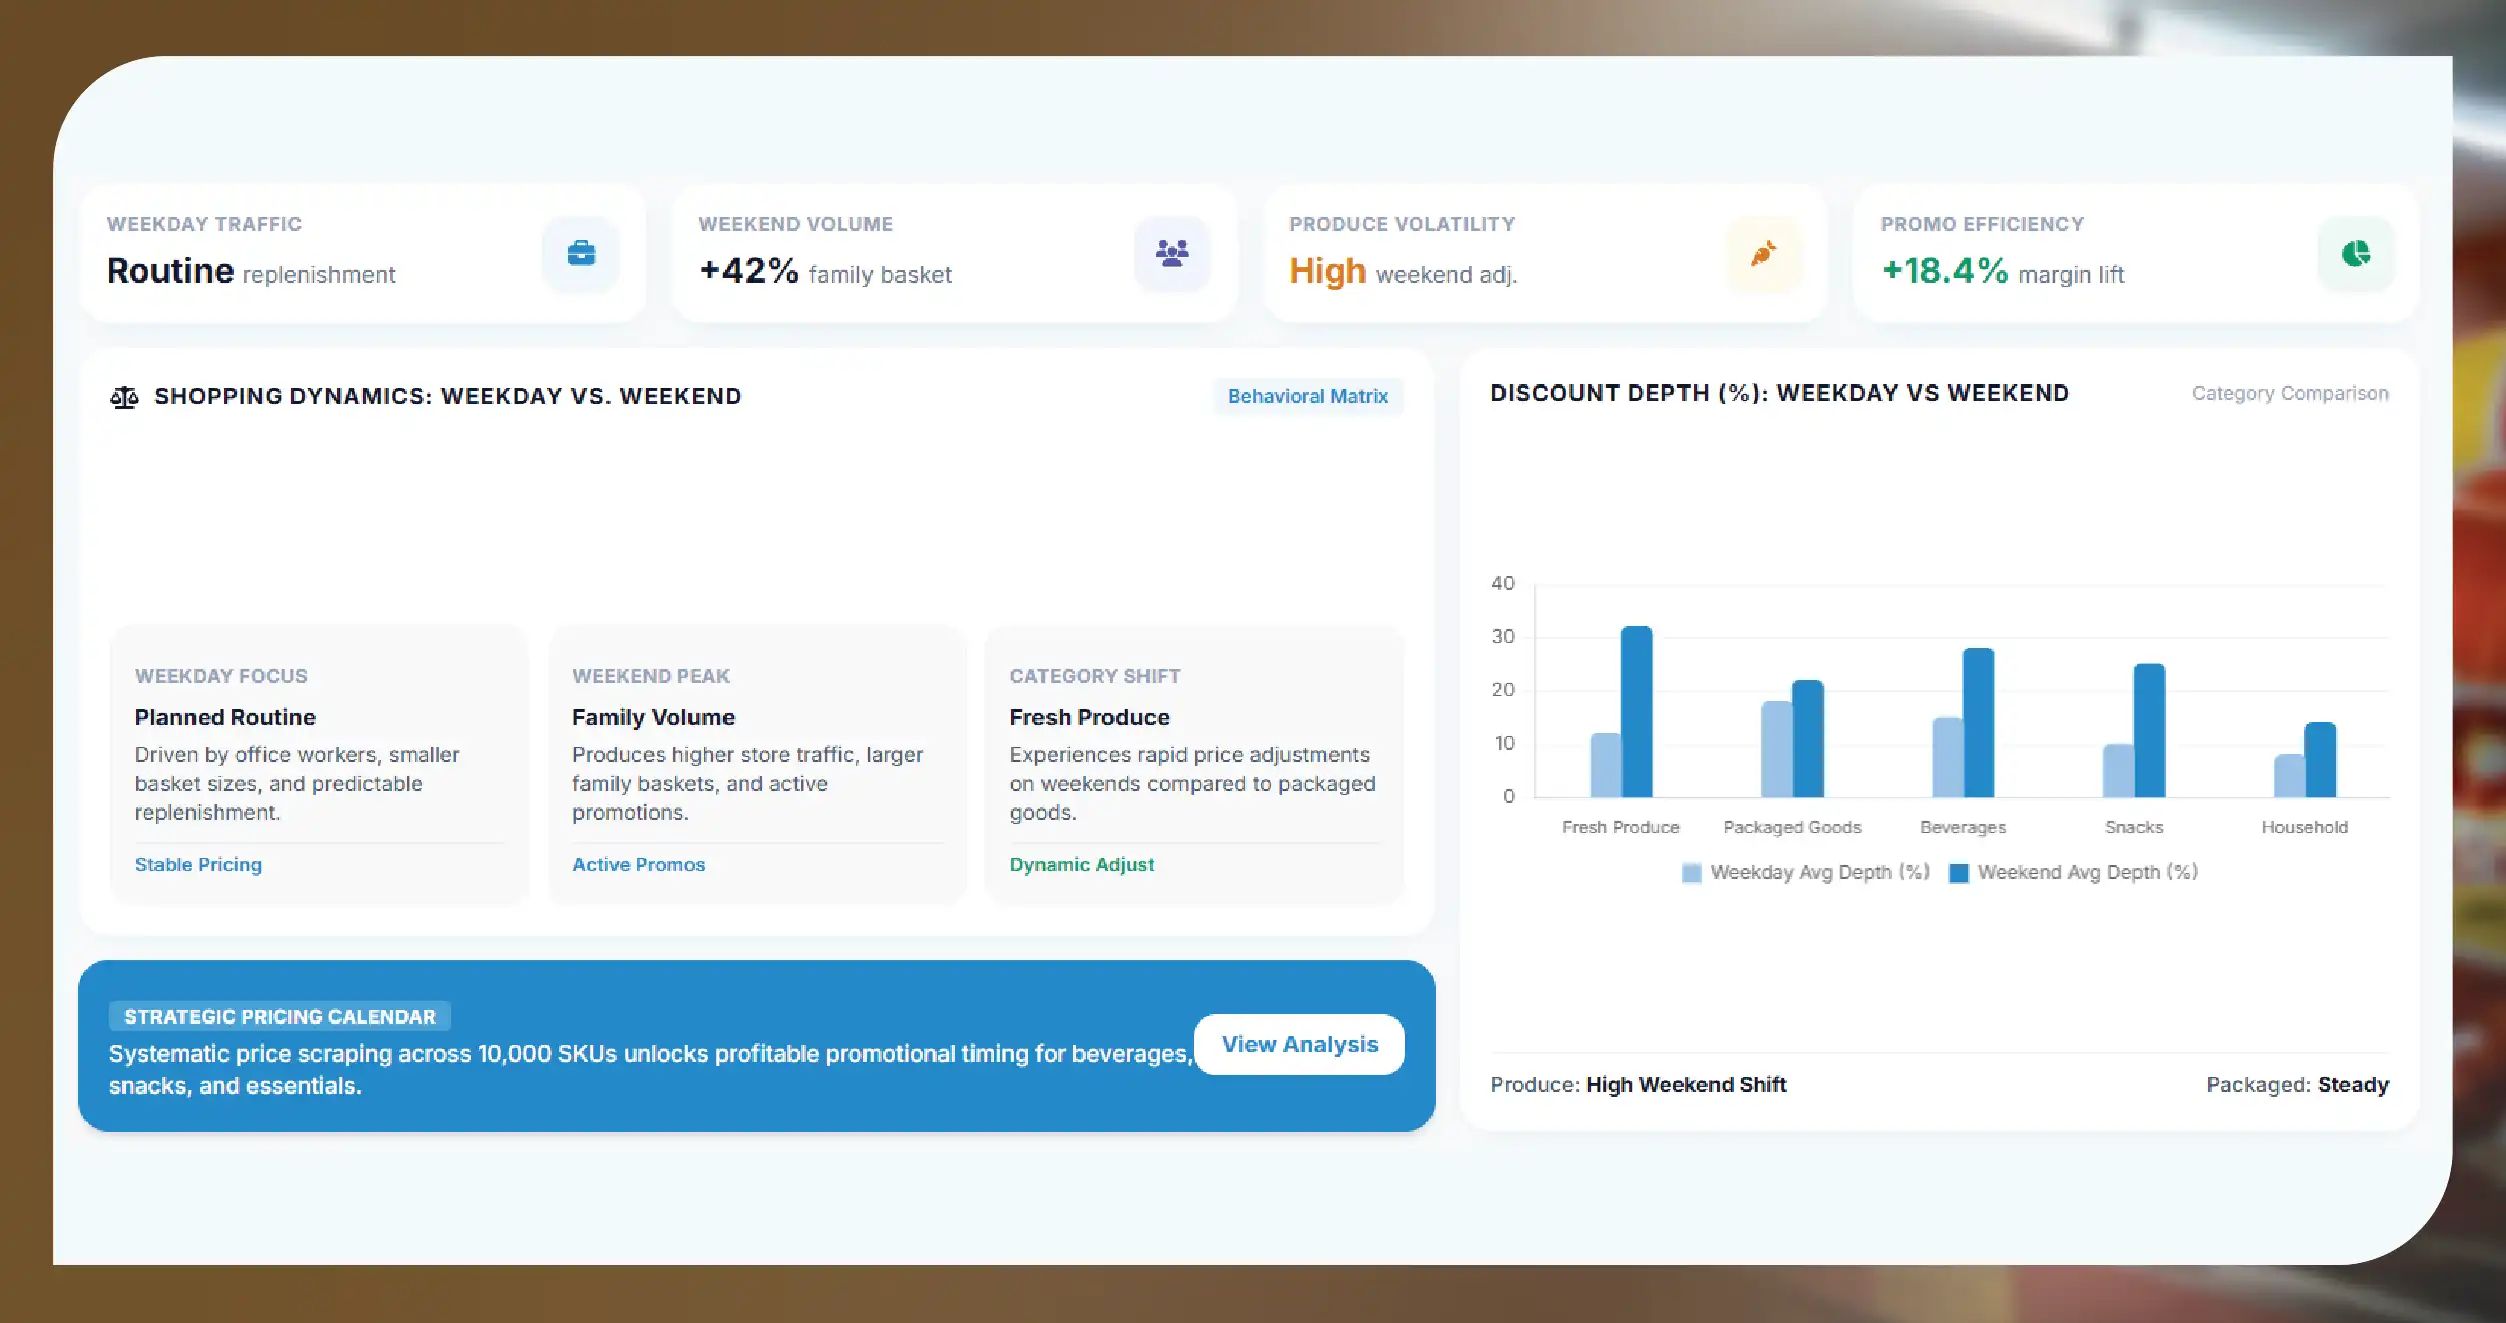
Consumer shopping behavior changes throughout the week. Weekday shopping may be driven by planned household purchases, office workers, smaller baskets, and routine replenishment. Weekend shopping often produces higher traffic, larger baskets, family purchases, and stronger promotional activity.
Weekday vs weekend Supermarkets prices scraping enables businesses to compare these periods systematically rather than relying on assumptions.
Consider a dataset containing 10,000 products monitored every day for six months. Analysts can calculate average weekday prices, average weekend prices, discount depth, price volatility, promotional frequency, and product-level changes.
Such comparisons can reveal that fresh produce experiences more frequent adjustments during weekends, while packaged grocery products may follow predictable promotional calendars. Other categories, such as beverages, snacks, personal care products, and household essentials, may demonstrate entirely different patterns.
These insights can support pricing calendars, promotion planning, competitor benchmarking, and revenue optimization.
Measuring Repricing Frequency
Not every supermarket reprices at the same speed. Some categories may change prices multiple times per week, while others remain unchanged for long periods.
Supermarket price tracking provides the historical foundation needed to identify these differences.
Businesses can assign products to repricing-frequency groups such as daily, several times per week, weekly, biweekly, monthly, or irregular. These classifications make it easier to identify high-volatility products and stable-price products.
Supermarket repricing frequency can also be compared between competing retailers. If one retailer changes the price of a popular product five times during a month while another changes it only once, their pricing strategies may be fundamentally different.
A retailer could use this information to determine whether it is responding quickly enough to market changes. A consumer brand could identify which retailers are most aggressive with promotions. An investment team could evaluate the pricing intensity of different supermarket chains.
Tracking Price Changes Over Time
Historical pricing provides considerably more intelligence than a one-time snapshot.
Scrape Supermarkets price changes over time to create longitudinal datasets that reveal trends, cycles, sudden movements, and recurring promotional behavior.
A useful dataset may capture:
- Product name and SKU
- Brand and category
- Regular price
- Sale price
- Discount percentage
- Promotion type
- Store or supermarket
- City and region
- Product availability
- Collection timestamp
- Previous price
- Current price
- Price-change direction
- Price-change percentage
- Promotion start and end dates
With these fields, analysts can calculate price volatility, average selling prices, median prices, discount depth, promotional duration, and repricing intervals.
Historical datasets can also identify unusual events. A sudden 20% price increase across multiple products may indicate supplier cost pressure. A rapid decrease across competing stores may signal a promotional battle. A product disappearing shortly after a price reduction could indicate inventory depletion.
Product-Level Competitive Intelligence
Price monitoring becomes even more powerful when products are matched accurately across supermarkets.
Scrape Product Prices from Supermarket datasets can compare identical products by SKU, UPC, EAN, brand, size, flavor, packaging, or other identifiers.
Product matching prevents misleading comparisons. A 500-gram cereal package should not automatically be compared with a 750-gram package simply because the product names are similar.
Normalized datasets allow businesses to calculate price differences at product level. For example, if Supermarket A sells a product for $5.20 and Supermarket B sells the same item for $4.75, the price gap is $0.45, or approximately 8.7% relative to Supermarket A.
Across thousands of products, these comparisons can reveal which retailer consistently leads on price and which categories contribute most to competitive gaps.
Building a Supermarket Pricing Dashboard
A dashboard transforms raw monitoring data into actionable intelligence.
A pricing dashboard can display average prices, price changes, discount rates, promotional frequency, product availability, competitor gaps, and historical trends.
Useful dashboard filters include:
- Supermarket
- City
- Store
- Product category
- Brand
- SKU
- Date
- Weekday
- Weekend
- Promotion status
- Price-change percentage
A category manager could filter beverages and identify products that experienced the largest price increases during the previous month. A pricing analyst could isolate weekend promotions. A procurement team could examine products with persistent supplier-driven increases.
The dashboard therefore becomes a decision-support system rather than simply a price database.
Business Applications of Supermarket Price Monitoring
Retailers can use price intelligence to benchmark competitors and improve their own pricing strategies. Brands can monitor how retailers position their products and whether promotional activity is consistent across locations.
Investors and market researchers can analyze pricing aggressiveness, product availability, market positioning, and regional differences.
For grocery technology companies, historical price data can power shopping comparison platforms, basket optimization engines, consumer savings tools, and personalized recommendation systems.
Promotional analysis can also identify products that frequently appear in discounts. Businesses can determine whether promotions are short-term events or recurring weekly strategies.
Inventory information adds further context. A price decrease combined with declining availability may have a different meaning from a price decrease accompanied by abundant stock.
Data Quality and Monitoring Challenges
Supermarket websites and digital storefronts can change frequently. Product pages may contain dynamic elements, location-specific prices, personalized promotions, changing inventory indicators, or different prices for delivery and pickup.
A reliable monitoring system therefore needs consistent collection schedules, product matching, duplicate handling, timestamping, validation, and historical storage.
Data should also distinguish between regular price and promotional price. Otherwise, an analysis could incorrectly interpret a temporary discount as a permanent price reduction.
Location is equally important. The same supermarket chain may display different prices across cities, stores, regions, or fulfillment zones. Monitoring at a broader national level without accounting for geography can hide important local pricing differences.
How Food Data Scrape Can Help You?
1. Automated Price Intelligence
Food Data Scrape can collect supermarket product prices continuously, helping businesses compare current and historical pricing across categories, locations, brands, and competing retailers efficiently for strategic decisions.
2. Historical Repricing Analysis
It can organize timestamped price records to reveal recurring discounts, price increases, promotional cycles, weekday patterns, weekend movements, and long-term pricing trends across thousands of grocery products.
3. Competitive Benchmarking
Food Data Scrape can compare matched products across supermarkets, highlighting price gaps, discount percentages, promotional intensity, availability differences, and retailer-specific pricing strategies for stronger competitive positioning and planning.
4. Inventory and Availability Monitoring
It can track product availability alongside pricing changes, helping businesses understand relationships between stock conditions, promotions, product demand, regional supply differences, and potential out-of-stock situations.
5. Decision-Ready Grocery Datasets
Food Data Scrape can deliver structured supermarket datasets containing product details, prices, promotions, availability, timestamps, and locations, enabling dashboards, analytics, forecasting, benchmarking, and automated pricing decisions.
Conclusion
Supermarket pricing is becoming increasingly dynamic, competitive, and data-driven. Businesses that monitor only today's prices miss the patterns that explain why prices changed, how long those changes lasted, and whether competitors responded.
Supermarket Data Scraping creates the historical foundation required to analyze these movements at scale.
Scraping Cheapest Groceries Supermarket data can help identify where customers find better prices, which categories offer the strongest savings, and how competitive positions shift over time.
Supermarket Inventory Data Tracking adds another dimension by connecting pricing behavior with availability, helping businesses understand whether changes are driven by demand, promotions, supply conditions, or stock levels.
When price history, competitive intelligence, promotional behavior, weekday patterns, and inventory signals are combined, supermarket data becomes a powerful resource for pricing optimization and market intelligence.
Turn supermarket price movements into actionable competitive intelligence—connect with Food Data Scrape today to build your customized supermarket monitoring dataset.
Are you in need of high-class scraping services? Food Data Scrape should be your first point of call. We are undoubtedly the best in Food Data Aggregator and Mobile Grocery App Scraping service and we render impeccable data insights and analytics for strategic decision-making. With a legacy of excellence as our backbone, we help companies become data-driven, fueling their development. Please take advantage of our tailored solutions that will add value to your business. Contact us today to unlock the value of your data.



