
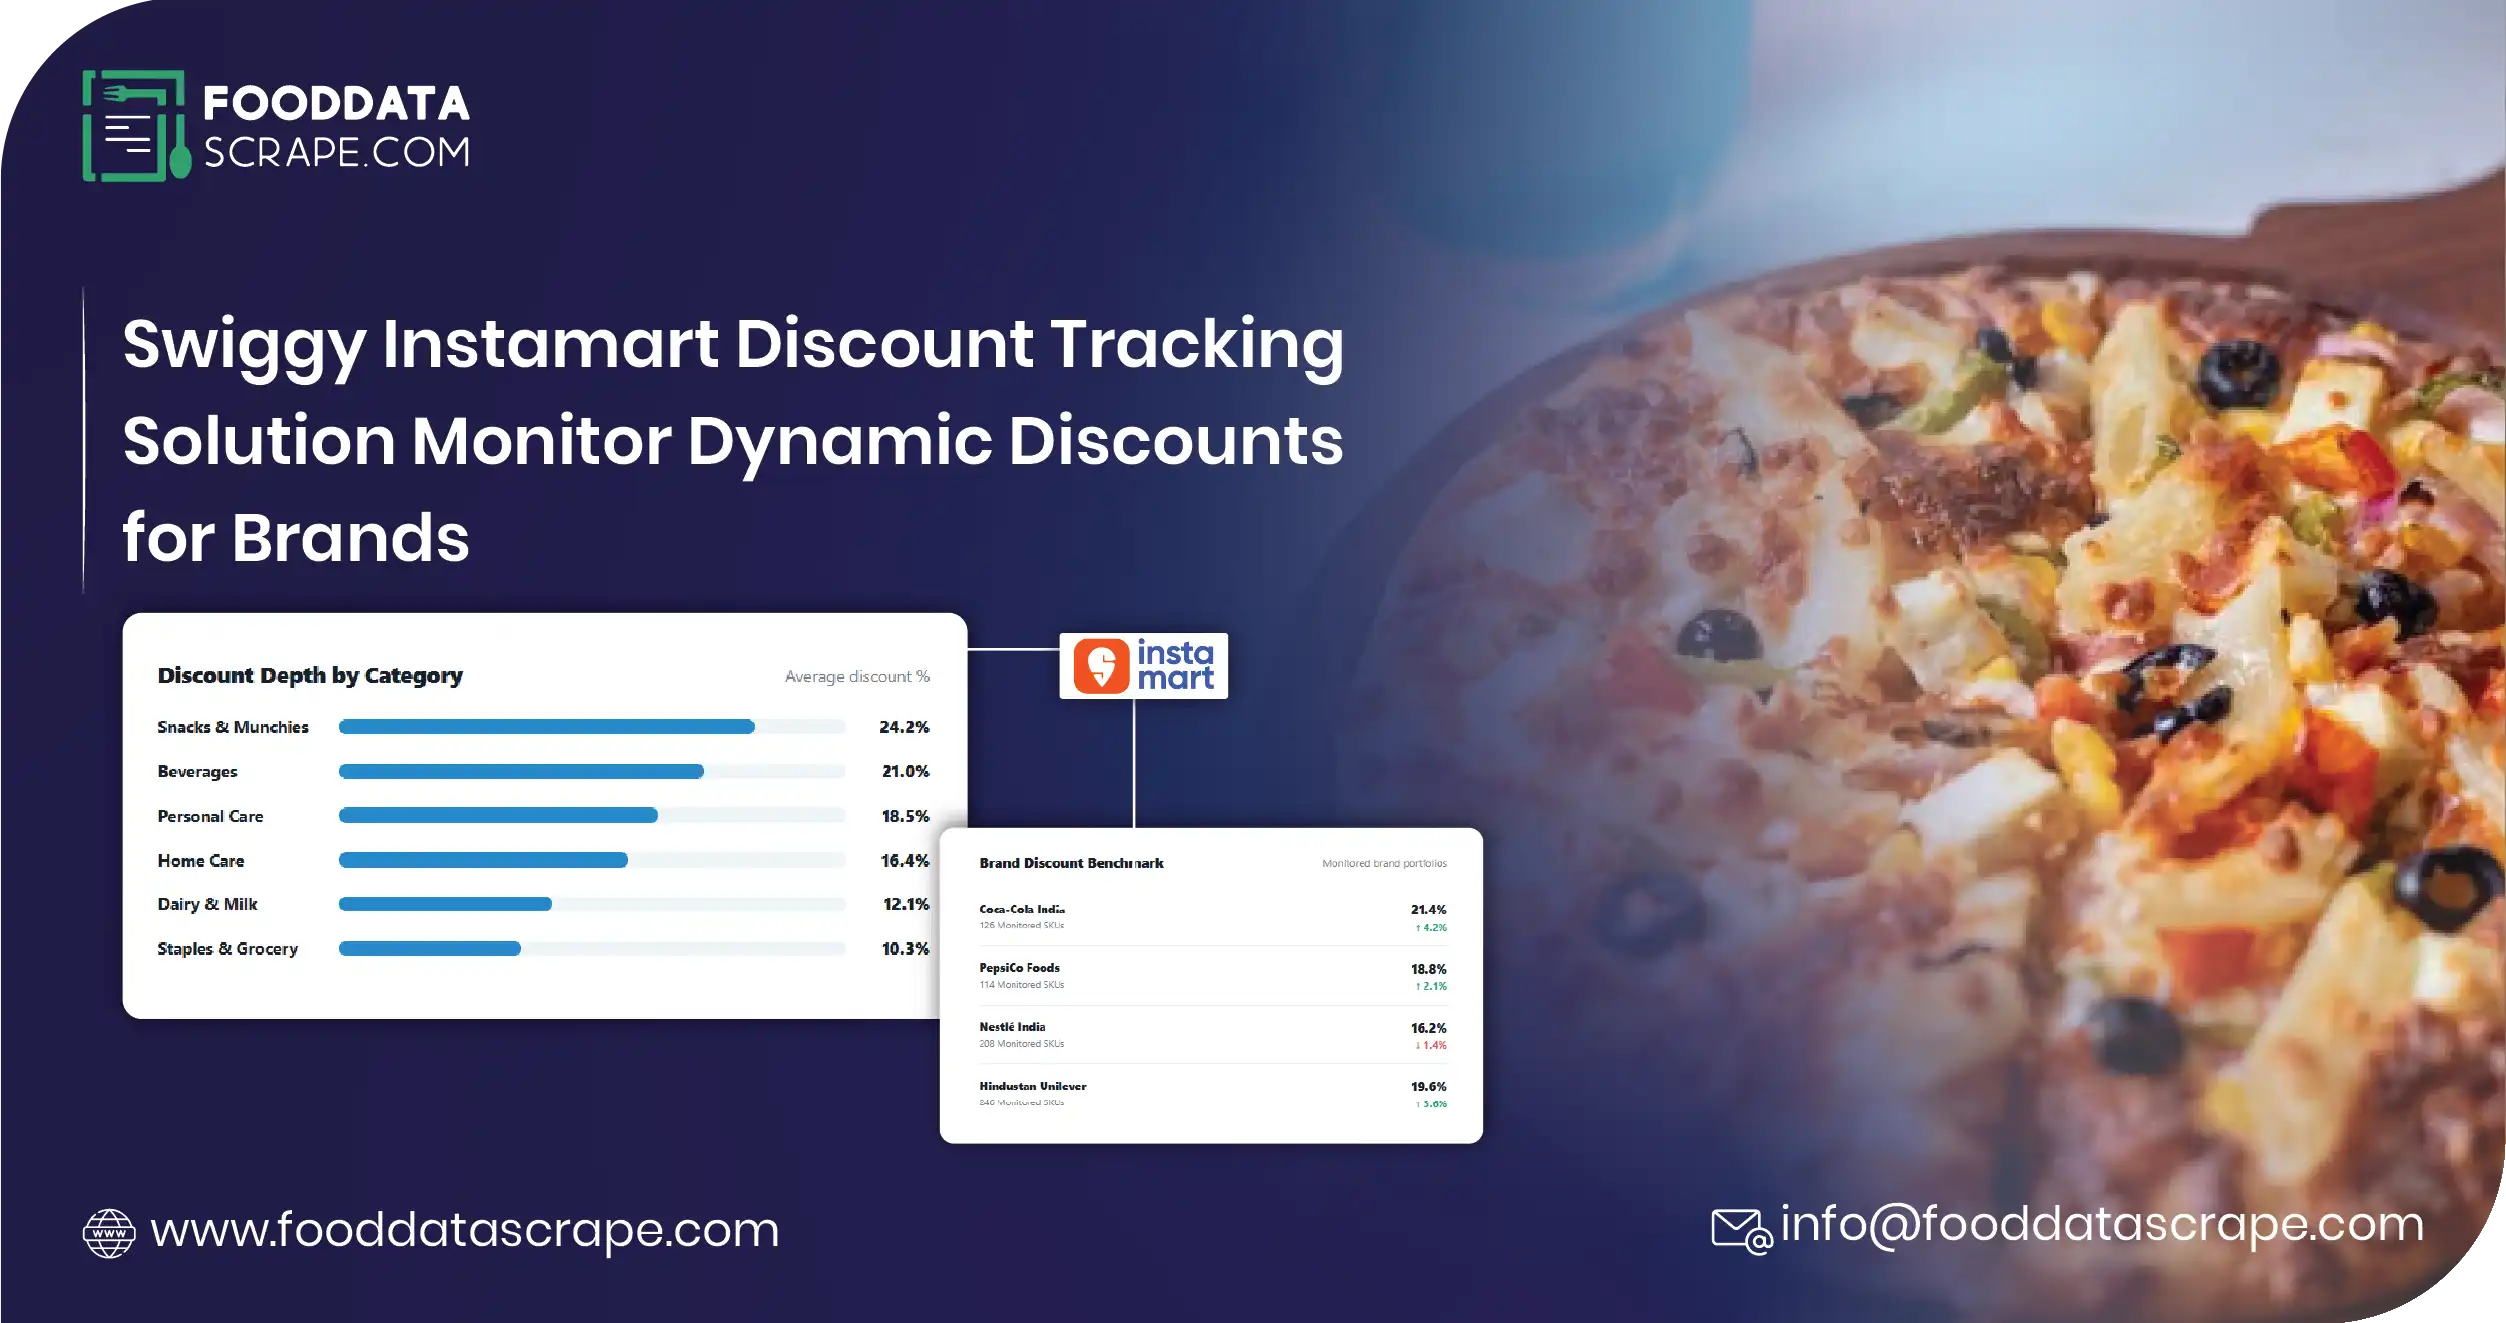
Introduction — Why Tracking Dynamic Discounts on Swiggy Instamart Matters for Brands in 2026
Swiggy Instamart operates one of India's fastest-changing pricing environments — dynamic discounts on branded FMCG SKUs shift throughout the day, vary by pincode, respond to real-time inventory pressure, and rotate across brands based on Instamart's commercial priorities. For FMCG brand managers protecting brand-value positioning through real-time promotional tracking India, for category heads managing trade-spend allocation, and for regional brand teams monitoring tier-2 city performance, continuous visibility into how Instamart applies dynamic discounts to specific brand SKUs has moved from an analytical luxury to an operational imperative.
This is exactly the problem that a modern Instamart discount tracking solves. When Indian FMCG brand managers and category heads deploy purpose-built Swiggy Instamart data scraping pipelines, they gain continuous visibility into per-SKU discount overlays, discount-cycle patterns, and discount-driven consumer-price effects across every Instamart-served pincode.
This guide breaks down how leading Indian FMCG brands and category teams build a Swiggy Instamart dynamic-discount tracking capability in 2026, with real sample data structures, use cases, and the specific pipeline architecture that powers brand-monitoring programs at scale. Examples reference tier-2 city Nagpur and metro deployments.
The 2026 Swiggy Instamart Dynamic Discount Landscape — What Changed
Three structural shifts have made continuous Instamart discount tracking essential in 2026.
1. Dynamic discounts have moved from occasional to systematic. Instamart's discount engine applies dynamic pricing tracking India Q-Com dynamics as real-time promotional overlays to branded SKUs multiple times per day based on inventory pressure, competitive activity, and category priorities. A 20% discount on a leading dairy brand at 10 AM can become 15% by 3 PM and 25% by 8 PM — cycle patterns invisible to any brand relying on daily snapshots.
2. Brand-specific discount targeting has professionalized. Instamart's category team increasingly targets specific brand SKUs with tactical discounts to drive category share, defend against competitor moves, or hit weekly volume commitments. Brand promotional tracking Instamart combined with Swiggy Instamart product data services is essential for brands to understand whether their SKUs are being used as traffic drivers or category anchors.
3. Tier-2 city Q-Com expansion has multiplied the tracking surface. Instamart's tier-2 city expansion including Nagpur Instamart brand analytics coverage (Nagpur, Indore, Kanpur, Coimbatore, Vadodara, Ludhiana, Bhopal) means brands now need discount visibility across dozens of tier-2 city pincodes in addition to metros — Tier 2 city Q-Com tracking India has become a distinct capability requirement.
India Q-Com discount intelligence powers these decisions. The Indian FMCG brands winning in 2026 are those with the fastest, cleanest visibility into how Instamart is actually treating their brand across every pincode their SKUs are stocked in.
What Swiggy Instamart Discount Tracking Delivers
A modern Swiggy Instamart Discount Tracking Solution is a data pipeline plus analytics layer that continuously scrapes per-SKU pricing, discount overlays, availability, and promotional metadata from Instamart across every relevant pincode — delivering structured, decision-ready output to the brand's category and trade teams through comprehensive Instamart SKU price monitoring.
A well-designed Instamart brand discount monitoring pipeline captures Swiggy dark store discount data across pincodes plus:
- Per-SKU shelf price and applied discount percentage
- Real-time discount changes throughout the day (intraday tracking)
- Per-pincode dark-store variation
- Category-level discount pattern detection
- Competitor brand discount comparison at same-category SKUs
- Availability and stock-out signals correlated with discount cycles
- Pack size and unit-price normalization
- Historical discount time-series for pattern recognition
- Refresh cadence ranging from 4-hour to hourly for critical SKUs
- Trade-spend attribution tagging (where discount source can be inferred)
The output plugs directly into the brand team's category dashboard — replacing weekly retail audits and delayed trade-spend reports with continuous discount visibility.
Sample Data — Real Instamart Discount Snapshot
Below is a sample of the structured output a properly designed Swiggy discount data extraction pipeline produces for an FMCG brand tracking 8 branded SKUs across Instamart in Nagpur and Mumbai pincodes.
Sample 1 — Intraday Instamart Discount Snapshot (Nagpur)
| SKU | Category | 10 AM Price | 3 PM Price | 8 PM Price | Discount Range | Pattern |
|---|---|---|---|---|---|---|
| Amul Butter 500g | Dairy | ₹275 (0%) | ₹247 (10%) | ₹261 (5%) | 0-10% | Mid-day promo |
| Britannia Bread 400g | Bakery | ₹55 (0%) | ₹47 (15%) | ₹55 (0%) | 0-15% | Mid-day peak |
| Maggi 4-pack | Instant | ₹65 (0%) | ₹55 (15%) | ₹55 (15%) | 0-15% | Afternoon sustained |
| Coca-Cola 750ml | Beverages | ₹40 (0%) | ₹40 (0%) | ₹34 (15%) | 0-15% | Evening only |
| Aashirvaad Atta 5kg | Staples | ₹275 (0%) | ₹261 (5%) | ₹247 (10%) | 0-10% | Rising discount |
| Nescafe Classic 100g | Beverages | ₹259 (0%) | ₹244 (5%) | ₹244 (5%) | 0-5% | Steady discount |
| Lays 52g | Snacks | ₹20 (0%) | ₹18 (10%) | ₹16 (20%) | 0-20% | Aggressive rising |
| Kissan Jam 500g | Spreads | ₹165 (0%) | ₹148 (10%) | ₹165 (0%) | 0-10% | Mid-day only |
The sample reveals immediate signals for the brand's category team: same-day discount cycles vary dramatically by SKU. Lays 52g shows an aggressive rising discount curve suggesting Instamart is using it as an evening traffic driver. Britannia Bread shows a sharp mid-day promo that reverts — likely an inventory-clearing tactic. Amul Butter shows partial reversion suggesting demand response. This kind of intraday pattern visibility is impossible from daily snapshots and requires continuous refresh.
Sample 2 — 4-Week Discount Frequency Panel (Amul Butter 500g)
| Metric | Wk 1 | Wk 2 | Wk 3 | Wk 4 | Trend |
|---|---|---|---|---|---|
| Days with any discount | 5/7 | 6/7 | 7/7 | 7/7 | Rising |
| Avg discount % applied | 6% | 8% | 11% | 13% | Rising |
| Peak discount % | 12% | 15% | 20% | 22% | Rising |
| Discount hours per day (avg) | 4.2 | 5.8 | 7.4 | 8.9 | Rising |
| Nagpur pincode variation | Low | Low | Medium | High | Increasing |
| Competitor brand parallel discount days | 3/7 | 4/7 | 5/7 | 6/7 | Rising |
Four weeks of data reveals a systematic pattern the brand's category team needs to intervene on: Amul Butter is entering a sustained discount cycle at Instamart — days with discount grew from 5/7 to 7/7, average discount depth grew from 6% to 13%, and hours-per-day discount grew from 4.2 to 8.9. This is likely a category-share push by Instamart potentially using the brand as a traffic driver. The brand's trade team needs to determine whether they are funding this promotional push or Instamart is absorbing it, then decide whether to intervene.
The Nagpur Brand Manager Case — Tier-2 Discount Intelligence
The Nagpur brand manager pattern — an FMCG brand manager monitoring 30-100 branded SKUs across Instamart in Nagpur, Indore, Kanpur, and adjacent tier-2 cities — is a common entry point into Indian Q-Com tier-2 discount tracking deployment.
Instamart tier-2 city expansion combines the competitive pressure of category share capture with the complexity of pincode-varying discount strategies. A brand manager tracking this landscape needs both dimensions visible — the tier-2 city competitive dynamic AND the intraday discount pattern — to inform trade-spend allocation, promotional response, and inventory-planning decisions.
The Instamart discount patterns visible in Nagpur — intraday cycles, sustained multi-week discount campaigns, tier-2 pincode variation — appear with local variations across Indore, Kanpur, Coimbatore, Vadodara, Ludhiana, and every tier-2 city Instamart has expanded into.
How the Instamart Discount Tracking Pipeline Works
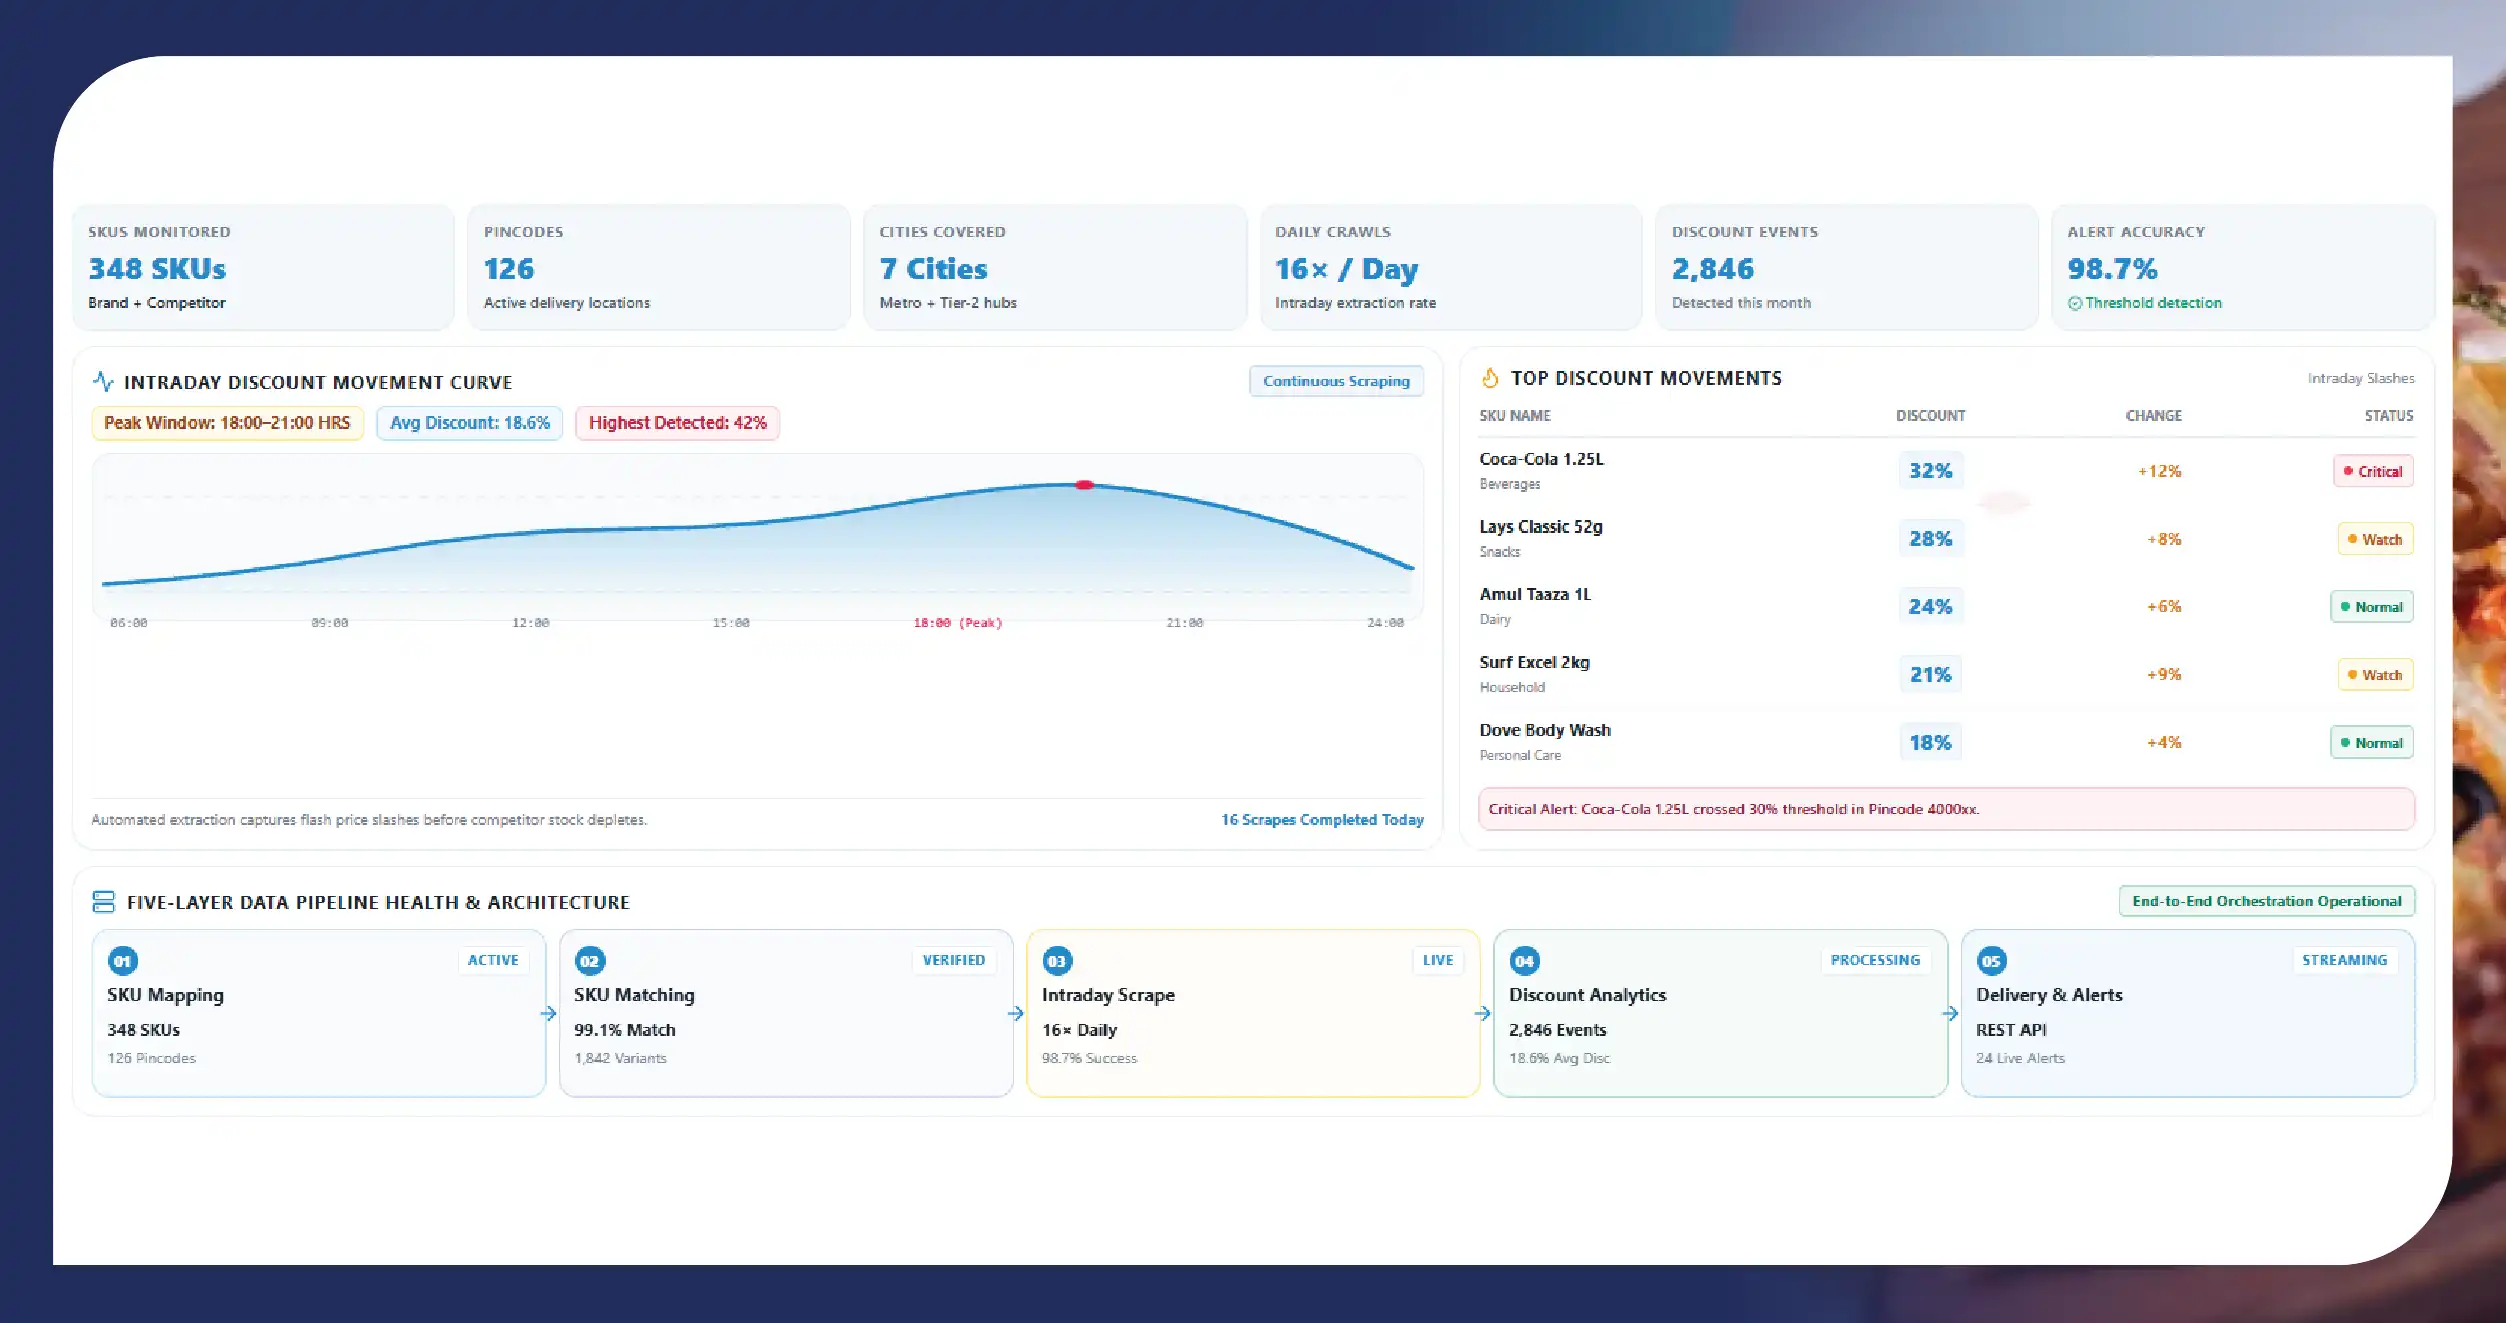
FoodDataScrape builds Instamart discount tracking pipelines on a five-layer architecture designed for real-time discount dynamics — pipelines built for track dynamic discounts swiggy instamart requirements.
Layer 1: SKU and Pincode Mapping. Team defines brand SKUs, competitor SKUs, target metros/tier-2 cities, and pincode scope.
Layer 2: Cross-Pincode SKU Matching. SKU IDs are anchored to pincode-specific product listings to handle any listing variations across dark stores.
Layer 3: Continuous Intraday Scraping. Per-pincode extractors pull pricing and discount overlays 4-24 times per day depending on category volatility.
Layer 4: Discount Analytics Layer. Raw pricing data transforms into decision-ready outputs — intraday discount cycle detection, multi-day discount pattern recognition, discount-frequency trending, competitor discount comparison. This is where raw Instamart category discount analytics data becomes true brand intelligence.
Layer 5: Delivery and Alerts. REST API, dashboards, plus optional Slack/email alerts when discount thresholds are crossed on watched SKUs.
Build timeline is 4-6 weeks for a mid-scope engagement covering 100-500 SKUs across 3-8 metros and tier-2 cities.
Why Indian FMCG Brands Choose Continuous Discount Tracking
Indian FMCG brand managers and category heads select continuous Swiggy Instamart Discount Tracking Solution pipelines over weekly retail audits for six specific reasons.
- Intraday visibility. Daily snapshots miss same-day discount cycles that continuous scraping captures.
- Pincode-level tier-2 accuracy. Tier-2 city discounts often diverge from metro patterns; pincode-anchored data reveals this.
- Competitor brand comparison. Same-category competitor SKU discount data enables relative-positioning intelligence.
- Trade-spend attribution. Discount source (brand-funded vs platform-funded) can often be inferred from discount pattern signatures.
- Real-time alerts. Threshold-crossing alerts enable same-day trade-team response rather than next-week retrospective analysis.
- Historical pattern recognition. Multi-month time-series enables discount-cycle prediction for planning cycles ahead.
Key Success Metrics for Indian FMCG Data Pipelines
Enterprise operators evaluating a Indian FMCG data intelligence pipeline benchmark deployment success against five specific metrics that separate production-grade programs from prototype-quality feeds. Understanding these metrics before scoping an engagement prevents the common trap of celebrating a working scraper while missing the underlying business signal.
Metric 1: SKU Match Accuracy at Scale. Match accuracy on a 50-SKU proof-of-concept sample is not predictive of match accuracy on a 5,000-SKU production catalog. Best-in-class India category-tuned pipelines achieve 95-97% match accuracy at production scale; generic pipelines typically drop to 70-80% once catalog complexity increases. Operators should require match-accuracy testing on a representative production-scale sample before committing to a full engagement.
Metric 2: End-to-End Latency. The gap between data event (a price change on the source platform) and data availability (in the operator's dashboard) determines whether the pipeline supports operational decisions or only retrospective analysis. Production-grade programs target sub-4-hour latency for high-priority SKUs and sub-24-hour latency for the broader catalog.
Metric 3: Missing-Data Rate. Every scraping pipeline occasionally misses SKUs due to platform anti-bot measures, network issues, or category-page restructures. Production programs monitor missing-data rate per platform per city per day and alert operators when rates exceed 3%. Operators should require missing-data rate reporting as a standard deliverable.
Metric 4: Historical Data Integrity. Pattern-detection and elasticity analytics depend on complete historical time-series. Programs that drop data on infrastructure incidents undermine downstream analytical use cases. Best-in-class pipelines preserve 24+ month historical depth with data-quality flags rather than gaps.
Metric 5: Change Adaptation Speed. Source platforms change their category page structures every few months. Production pipelines adapt within 24-48 hours; brittle pipelines break for weeks. Operators should ask potential vendors about their platform-change response cadence over the past year — the answer signals engineering maturity.
Programs monitoring these five metrics as core deliverables — rather than treating them as internal engineering concerns — consistently outperform programs treating scraping as a black-box service.
Sample Use Cases — How Indian Brands Actually Use the Data
Use Case 1: FMCG Brand Manager Daily Discount Review. A brand manager reviews per-SKU discount patterns across Instamart pincodes every morning to inform trade-team discussions.
Use Case 2: Trade Team Discount ROI Measurement. A branded manufacturer measures whether trade-spend commitments to Swiggy Instamart actually translate to shopper-visible discount depth on their SKUs.
Use Case 3: Category Head Competitive Response. A category head monitors competitor brand discount depth to inform defensive promotional response timing.
Use Case 4: Regional Sales Team Tier-2 Positioning. A regional sales team uses Nagpur, Indore, and Kanpur discount visibility to inform trade partner conversations and shelf-slot negotiations.
Use Case 5: Investment Analyst Q-Com Sector Coverage. An investment analyst tracks Instamart's promotional intensity as a proxy for competitive pressure and category-share dynamics.
Getting Started — The 5-Week Roadmap
Getting a Swiggy Instamart Discount Tracking Solution engagement live with FoodDataScrape follows a structured process.
Week 1: Scoping and PoC. Client defines SKUs, pincodes, refresh cadence, alert thresholds. Free PoC delivered within 5 business days.
Weeks 2-4: Production build. Pincode-specific extractors, SKU matching, discount analytics layer, and alerting configured.
Week 5: Live production delivery. Continuous discount data flows into brand team workflows.
Ongoing: Refinement. Additional SKUs, cities, competitor brands, and alert refinement added continuously.
Conclusion — Continuous Instamart Discount Tracking Is the 2026 Standard
The Instamart discount environment in 2026 has become too intraday-dynamic, too pincode-varied, and too competitively-driven for weekly retail audits to serve as reliable brand-monitoring intelligence. Brands without continuous discount tracking are structurally disadvantaged against those that have moved to purpose-built pipelines.
The Nagpur 8-SKU pattern is the entry point for most brand engagements. Most Indian FMCG brands expand within 6-12 months to 500-2,000 SKUs across every major metro and tier-2 city Instamart operates in, adding competitor brand tracking as their category intelligence maturity grows. Brands that establish continuous discount tracking infrastructure gain a compounding advantage — pattern recognition sharpens with more historical data, alert thresholds refine with each seasonal cycle, and category-team decisions become steadily more evidence-anchored quarter after quarter.
FoodDataScrape builds the pipelines that deliver this intelligence — covering Swiggy Instamart, Zepto, Blinkit, and BigBasket with continuous refresh, pincode-anchored accuracy, intraday cycle detection, and real-time alerting.
If you are an Indian FMCG brand, a category head, or a regional sales team — continuous Instamart discount tracking is the fastest path to closing the 2026 visibility gap.
Ready to See Sample Discount Data for Your SKUs? Tell us your target SKUs, pincodes, and refresh needs. Get a free proof-of-concept sample within 5 business days — no commitment required.
Contact FoodDataScrape today for continuous Instamart discount tracking that turns dynamic-discount complexity into brand advantage.
Related Case Studies
- 🇮🇳 India Promo ROI +18% — National chain — Zomato + Swiggy promo analysis.
- 🇮🇳 Bengaluru Cloud Kitchen Stockouts — 68% stockout cut · ₹8cr recovered.
- Price Benchmarking Tool 2026 — Global FMCG pricing intelligence guide.
Questions
Frequently Asked Questions
Per-SKU pricing, applied discount percentage, real-time discount cycle changes, per-pincode variation, competitor brand comparison, availability signals, and historical time-series across Instamart operations in target metros and tier-2 cities.
4-hour, hourly, or on-demand refresh depending on SKU category volatility. High-discount-frequency SKUs benefit from hourly refresh.
Yes — same-category competitor SKU discount tracking enables relative-positioning intelligence essential for brand response decisions.
Yes — threshold-crossing alerts (e.g., "Alert if Amul Butter discount exceeds 20% in Nagpur pincode") can be pushed to Slack, email, or webhook.
Discount pattern signatures (frequency, depth, timing) can often be correlated with known trade-spend commitments to infer whether promotions are brand-funded or platform-funded.
Yes — sourcing operates within Indian data compliance frameworks.
Get a Free Food Data Sample in 48 Hours.
Tell us your platforms, target markets and required fields — we'll map exactly what's possible with food data scraping, recommend the right approach, and send a working sample so you can verify quality before any commitment.
Request a strategy call
Thanks — our data team will reach out within 48 hours with your sample.



