
Introduction — Why Tier 2 Q-Commerce Data Matters for Brand Growth in 2026
India's quick commerce expansion has moved decisively beyond metros. In 2026, Zepto, Blinkit, and Swiggy Instamart operate 500+ dark stores across tier-2 and tier-3 cities — Hyderabad, Jaipur, Lucknow, Indore, Coimbatore, Vadodara, Nagpur, Bhopal, Kanpur, Ludhiana, Chandigarh, Surat, Vishakhapatnam, Kochi, and dozens more. For FMCG brands managing regional growth, for regional sales teams building tier-2 city strategy, for VP trade marketing teams allocating regional promotional spend, and for challenger Q-Com operators identifying market-entry opportunities, continuous visibility into tier-2 city Q-Com pricing, assortment, and promotional dynamics has moved from a strategic bonus to a growth-defining capability.
This is exactly the problem that a modern tier-2 Q-Com intelligence capability solves. When Indian FMCG regional teams and Q-Com operators deploy purpose-built tier-2 dark store data scraping pipelines, they gain continuous visibility into how tier-2 city Q-Com markets are actually developing — informing regional launch timing across emerging city Q-Com tracking India requirements, tier-2 promotional strategy, and city-by-city expansion prioritization based on daily market reality rather than metro assumptions.
This guide breaks down how leading Indian FMCG regional teams, Q-Com operators, and regional analysts build tier-2 city Q-Com intelligence capability in 2026, with real sample data structures, use cases, and the specific pipeline architecture that powers emerging-market intelligence programs at scale. Examples reference Hyderabad and adjacent tier-2 city clusters.
The 2026 India Tier 2 Q-Com Landscape — What Changed
Three structural shifts have made continuous tier-2 city Q-Com intelligence essential in 2026.
1. Tier-2 city Q-Com expansion has moved from tentative to aggressive. Zepto tier-2 expansion data reveals launches in 30+ new tier-2 cities in the past 12 months alone, with Blinkit emerging city tracking showing parallel aggressive expansion. Instamart tier-2 city data shows a slower but strategically-selected expansion pattern. Brands that were not tracking tier-2 markets 12 months ago are now behind on 30+ competitive cities.
2. Tier-2 city Q-Com pricing dynamics differ meaningfully from metros. Assortment depth is narrower, promotional cadences are less frequent but often deeper, and category-share dynamics reflect distinct consumer preferences. Tier-2 city FMCG intelligence at pincode granularity reveals patterns that metro-only tracking systematically misses.
3. Regional brand teams are being measured on tier-2 performance separately. Growth expectations at Indian FMCG brands increasingly separate metro and tier-2 city performance, with regional sales VPs held accountable for tier-2 growth specifically. Q-Commerce expansion analytics tied to tier-2 city performance has become a boardroom KPI at multiple leading brands.
The Indian FMCG brands and Q-Com operators winning in 2026 are those with the fastest, cleanest visibility into how tier-2 city Q-Com is actually developing across their target regional clusters.
What Tier 2 Q-Com Data Services Deliver
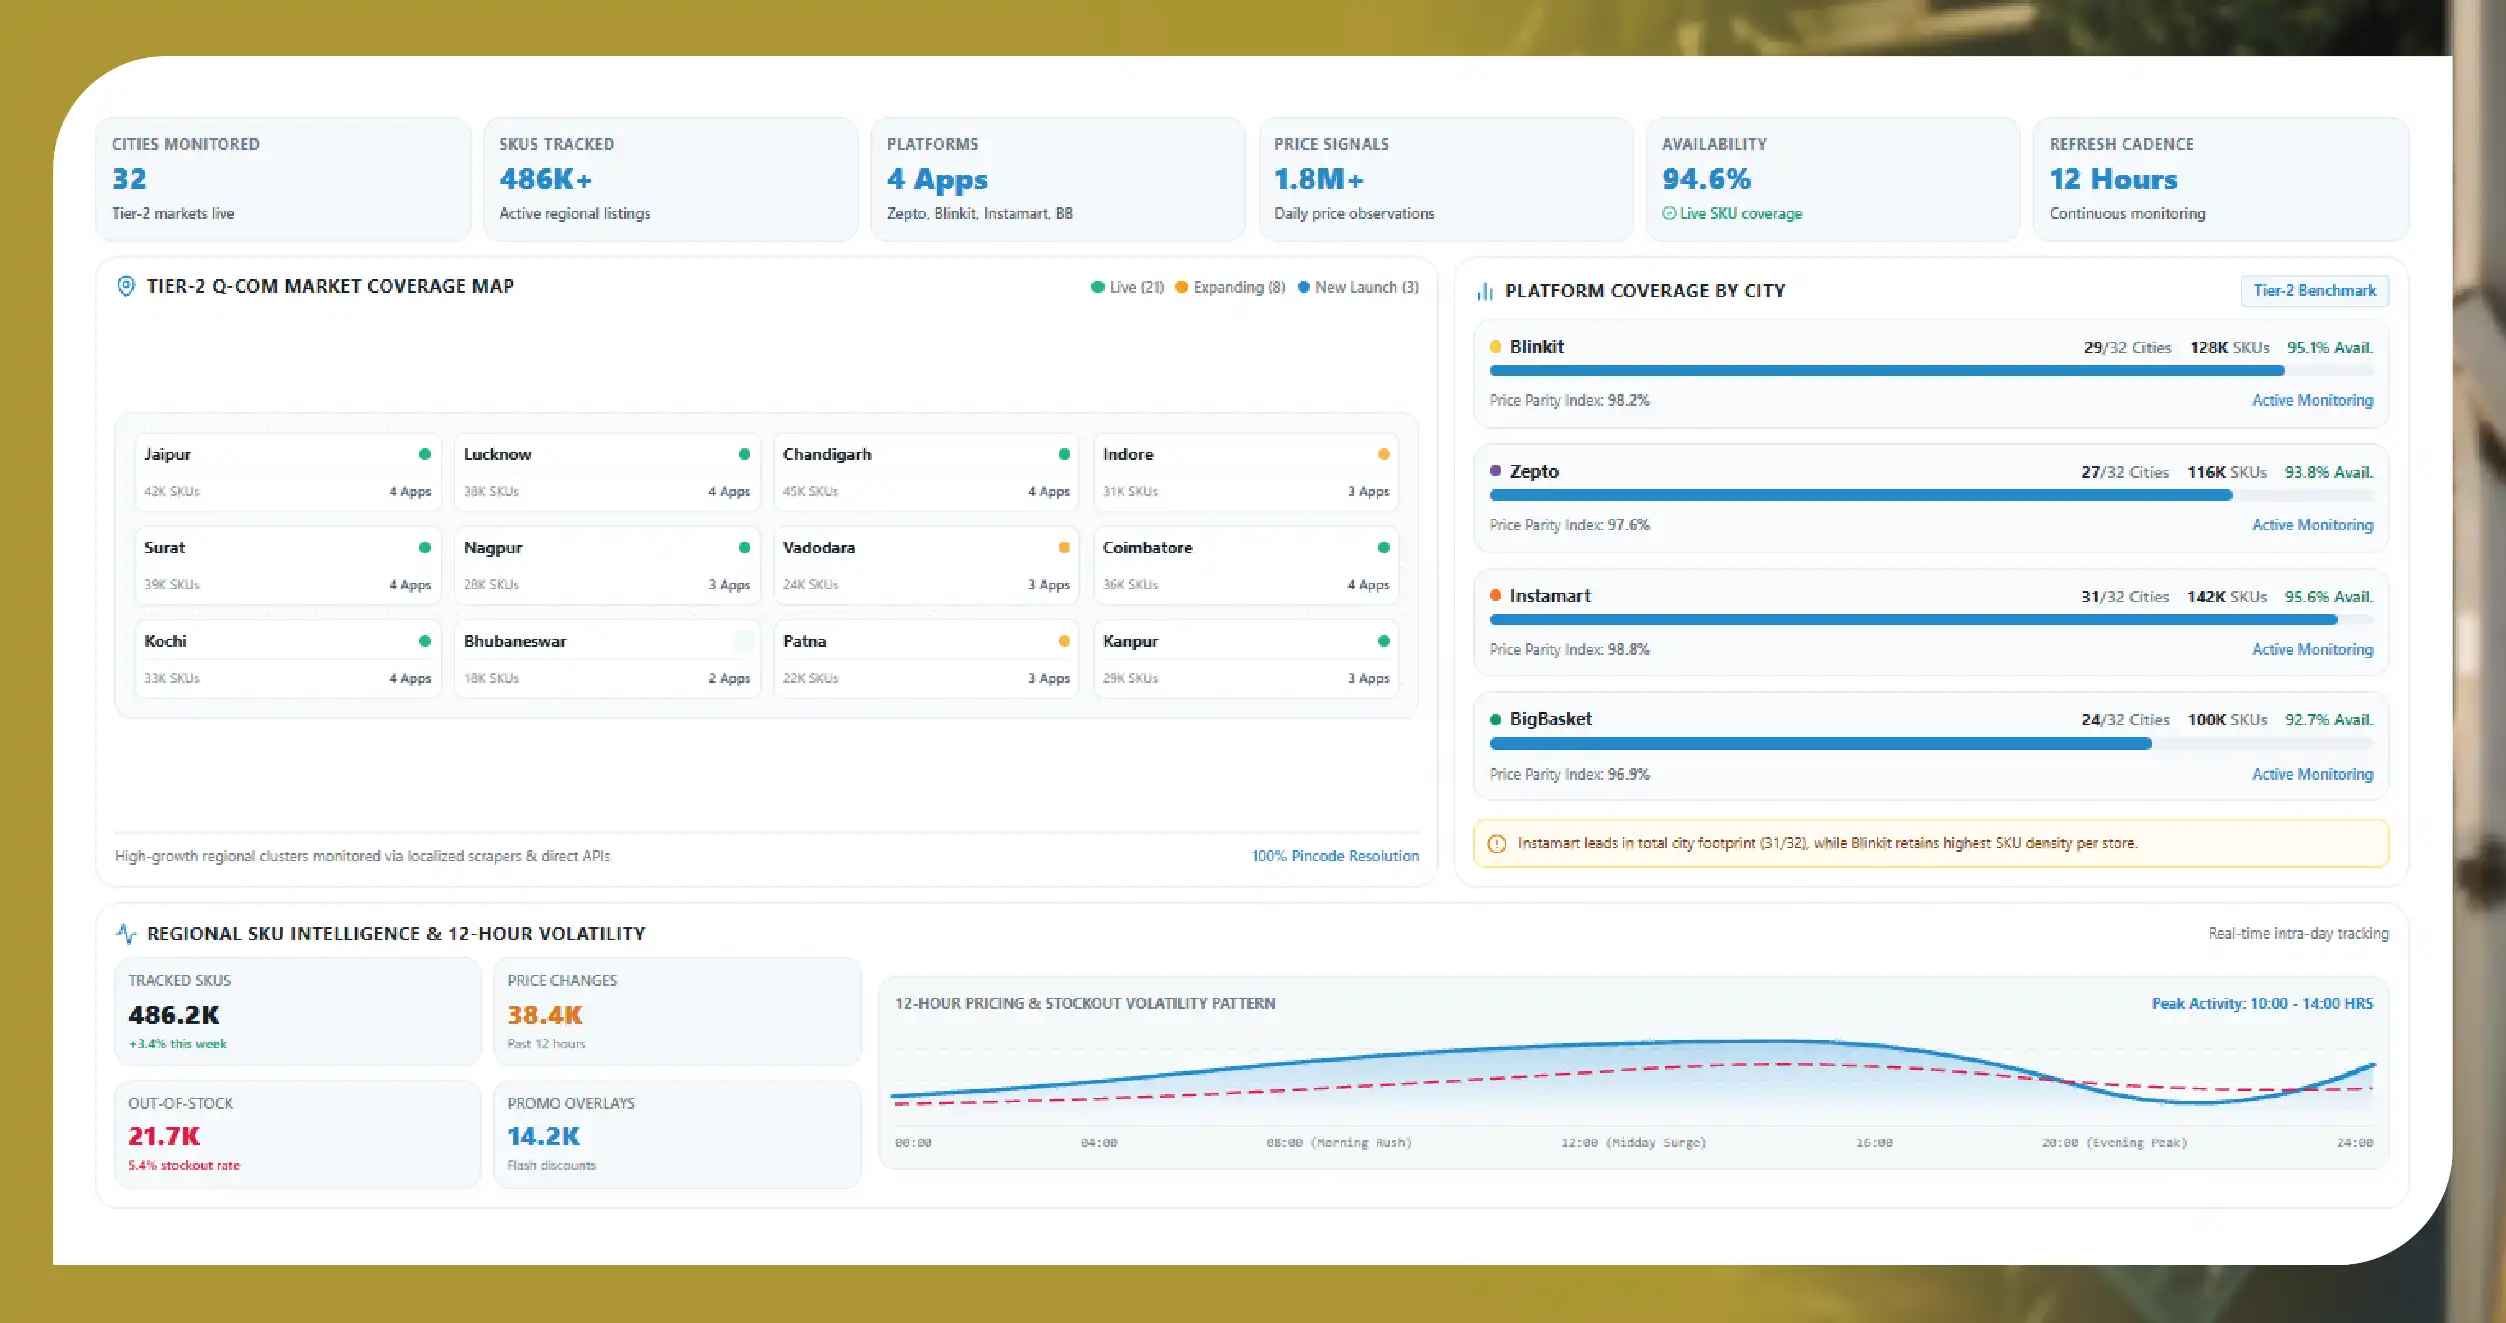
A modern tier-2 city Q-Com data pipeline is a data infrastructure that continuously scrapes product listings, pricing, availability, and promotional overlays from every relevant Q-Com platform operating in tier-2 cities — delivering structured, decision-ready output to regional brand teams and expansion planners.
A well-designed regional Q-Com brand analytics pipeline captures:
- Per-SKU pricing across Zepto, Blinkit, Swiggy Instamart, and BigBasket in every monitored tier-2 city
- Promotional overlays specific to each tier-2 city's competitive dynamics
- Availability and stock-out signals per tier-2 dark store
- Category assortment depth per city and per platform
- Regional preference indicators via pincode-level assortment analysis
- Pack size and unit-price normalization
- Daily or 12-hour refresh cadence
- Historical time-series for expansion-pattern analysis
- New-city launch detection when platforms open service in additional tier-2 markets
The output plugs directly into regional brand teams' commercial workflows — replacing metro-anchored assumptions with continuous tier-2 city market reality.
Sample Data — Real Hyderabad Cluster Snapshot
Below is a sample of the structured output a properly designed Hyderabad Q-Commerce data extraction pipeline produces for an FMCG brand tracking 8 SKUs across three Q-Com platforms in Hyderabad and adjacent tier-2 cluster cities (Warangal, Vijayawada, Vishakhapatnam).
Sample 1 — Multi-City Tier 2 Q-Com Pricing Snapshot
| SKU | Hyderabad (Zepto) | Vijayawada (Zepto) | Vishakhapatnam (Blinkit) | Warangal (Instamart) | Pattern |
|---|---|---|---|---|---|
| Amul Butter 500g | ₹275 | ₹279 | ₹272 | ₹280 | Blinkit cheapest |
| Britannia Bread 400g | ₹55 | ₹58 | ₹53 | Not carried | Vskp cheapest |
| Maggi 4-pack | ₹65 | ₹68 | ₹63 (promo) | ₹67 | Vskp promo win |
| Aashirvaad Atta 5kg | ₹275 | Not carried | ₹278 | ₹285 | Vijaywada gap |
| Nescafe Classic 100g | ₹259 | ₹265 | ₹255 | ₹268 | Warangal premium |
| Kissan Jam 500g | ₹165 | Not carried | ₹162 | Not carried | Assortment gap |
| Everest Chana Masala | ₹85 | ₹88 | Not carried | ₹90 | Blinkit gap |
| Fortune Sunflower 1L | ₹165 | ₹172 | ₹163 | ₹175 | Warangal premium |
The sample reveals immediate signals for the regional brand team: assortment gaps exist across tier-2 cluster cities that metro tracking would completely miss. Aashirvaad Atta is not carried on Zepto Vijayawada; Kissan Jam is not carried on Zepto Vijayawada or Instamart Warangal; Everest Chana Masala is not carried on Blinkit Vishakhapatnam. These are distribution and assortment opportunities the brand's regional sales team needs to prioritize with platform partners. Pricing pattern reveals Warangal (Instamart) sits systematically premium versus Vishakhapatnam (Blinkit) across the same portfolio — likely reflecting competitive intensity differences between the two tier-2 cities.
Sample 2 — 8-Week Tier 2 Platform Expansion Panel
| Tier 2 City | Wk 1 Zepto Stores | Wk 8 Zepto Stores | Wk 1 Blinkit Stores | Wk 8 Blinkit Stores | Net Change |
|---|---|---|---|---|---|
| Hyderabad | 42 | 48 | 38 | 45 | +13 combined |
| Vijayawada | 8 | 14 | 6 | 12 | +12 combined |
| Vishakhapatnam | 12 | 18 | 15 | 22 | +13 combined |
| Warangal | 3 | 8 | 0 | 4 | +9 combined |
| Guntur | 2 | 5 | 0 | 3 | +6 combined |
| Kakinada | 0 | 3 | 0 | 2 | +5 (new markets) |
Eight weeks of tier-2 expansion data reveals the growth pattern the regional team needs to see: Q-Com platforms are aggressively expanding across the Hyderabad cluster tier-2 markets, with Kakinada showing initial launch activity (0→3 stores) in Zepto and Blinkit both opening service. A brand's regional distribution team needs this pattern visibility to align supply-chain planning, trade-partner conversations, and promotional support with actual Q-Com expansion. Regional sales VPs planning next-year strategy get the tier-2 growth curve as a data anchor rather than a boardroom guess.
Key Success Metrics for Tier 2 Q-Com Pipelines
Enterprise operators evaluating a tier-2 city Q-Com data intelligence pipeline benchmark deployment success against five specific metrics.
Metric 1: Tier-2 City Coverage Breadth. Best-in-class programs cover 40+ tier-2 cities across major regional clusters, not just top 10-15 metros disguised as tier-2. Coverage depth should be documented per platform per city.
Metric 2: New-City Launch Detection Latency. Programs should detect new tier-2 city Q-Com launches within 7 days of platform activation, informing brand-side distribution response.
Metric 3: Dark-Store-Level Attribution Accuracy. Pincode-anchored data should tie to specific dark-store IDs rather than only city-level roll-ups, preserving the granularity tier-2 brand teams need.
Metric 4: Regional Language Handling. Some tier-2 city Q-Com platforms operate with regional-language product naming; production programs handle Hindi, Telugu, Tamil, Kannada, Bengali, Gujarati, and Marathi without match-accuracy degradation.
Metric 5: Cost Efficiency at Tier-2 Scale. Covering 40+ tier-2 cities requires cost-efficient scraping infrastructure; production programs deliver per-SKU per-city cost transparency.
Programs monitoring these five metrics as core deliverables consistently outperform programs treating tier-2 tracking as an extension of metro programs.
The Hyderabad Regional Sales Case — Tier 2 Growth Intelligence
The Hyderabad regional sales pattern — an FMCG brand's Head of Regional Sales, VP Trade Marketing, or regional category head monitoring 30-100 branded SKUs across Zepto, Blinkit, and Swiggy Instamart in Hyderabad, Vijayawada, Vishakhapatnam, Warangal, and adjacent tier-2 cluster cities — is a common entry point into Indian tier-2 Q-Com intelligence deployment.
The Indian tier-2 Q-Com market combines the growth-intensity of new-market expansion with the complexity of city-by-city variation in competitive dynamics, consumer preferences, and platform positioning. A regional sales team tracking this landscape needs both dimensions visible — the growth-trajectory AND the city-specific competitive picture — to inform distribution planning, promotional support, and regional target-setting decisions.
The tier-2 Q-Com patterns visible across the Hyderabad cluster — assortment gaps in emerging cities, platform expansion into new cities monthly, city-specific pricing dynamics — appear with local variations across the Jaipur cluster (Rajasthan tier-2), Lucknow cluster (UP tier-2), Indore cluster (MP tier-2), Coimbatore cluster (Tamil Nadu tier-2), and every regional cluster where Q-Com is expanding aggressively.
How the Tier 2 Q-Com Data Pipeline Architecture Works
FoodDataScrape builds tier-2 city Q-Com pipelines on a five-layer architecture designed for emerging-market data challenges — pipelines built for quick commerce tier 2 cities india 2026 requirements.
Layer 1: Regional Cluster Mapping. Team defines tier-2 city clusters (Hyderabad + adjacent, Jaipur + adjacent, Lucknow + adjacent, etc.) and target dark stores per city.
Layer 2: Cross-City SKU Matching. AI matching layer handles regional-language product naming variations and city-specific listing conventions to produce canonical SKU identifiers across all monitored tier-2 cities.
Layer 3: Continuous Multi-City Scraping. Per-platform per-city extractors pull pricing, promo overlays, availability, and metadata daily across every mapped city and SKU.
Layer 4: Tier-2 Analytics Layer. Raw data transforms into decision-ready regional outputs — per-city pricing corridors, city-vs-city comparison, tier-2 expansion trends, assortment gap identification, new-city launch detection.
Layer 5: Delivery and Regional Dashboards. REST API, CSV, and regional-team-optimized dashboards showing per-city and cluster-level intelligence.
Build timeline is 6-8 weeks for a mid-scope engagement covering 30-50 tier-2 cities across major regional clusters.
Why Indian FMCG Regional Teams Choose Continuous Tier 2 Data
Indian FMCG regional teams, Q-Com operators, and expansion planners select continuous Tier 2 Q-Commerce Data Services over metro-anchored intelligence for six specific reasons.
- True tier-2 coverage breadth. Coverage extends to 40+ tier-2 cities across major regional clusters rather than only top 10-15 metros disguised as tier-2.
- New-city launch detection. Sub-7-day detection of new Q-Com city launches enables brand-side distribution response before competitors react.
- Regional-language matching. Hindi, Telugu, Tamil, Kannada, Bengali, Gujarati, and Marathi product naming handled without match-accuracy degradation.
- Dark-store-level accuracy. Pincode-anchored data ties to specific dark-store IDs rather than only city roll-ups.
- Cost efficiency at scale. Covering 40+ tier-2 cities requires cost-efficient infrastructure; purpose-built pipelines deliver this at production scale.
- Regional-team-optimized deliverables. Dashboards and reports designed for regional sales VPs and trade marketing heads rather than headquarters-only consumption.
Sample Use Cases — How Indian Regional Teams Actually Use the Data
Use Case 1: Regional Sales VP Weekly Cluster Review. A regional sales VP reviews per-city tier-2 Q-Com performance weekly to inform distribution partner conversations and promotional support allocation.
Use Case 2: Trade Marketing Regional Promo Calibration. A trade marketing team calibrates city-by-city promotional spend based on continuous Q-Com competitive intelligence rather than metro-averaged assumptions.
Use Case 3: New-City Distribution Response. A brand's supply-chain team receives alerts when Q-Com platforms launch service in new tier-2 cities — enabling proactive distribution partner outreach.
Use Case 4: Assortment Gap Identification. Regional category managers identify tier-2 city assortment gaps where competitors carry SKUs but the brand does not — building city-specific distribution priorities.
Use Case 5: Regional Head Executive Reporting. Regional heads use tier-2 growth trend data to inform quarterly board presentations on regional performance and growth trajectory.
Getting Started — The 6-Week Roadmap
Getting a Tier 2 Q-Commerce Data Services engagement live with FoodDataScrape follows a structured process.
Week 1: Scoping and PoC. Client defines target tier-2 city clusters, SKUs, platforms, refresh cadence. Free PoC delivered within 5-7 business days.
Weeks 2-5: Production build. Regional cluster mapping, cross-city SKU matching, tier-2 analytics layer, and regional dashboards configured.
Week 6: Live production delivery. Continuous tier-2 city intelligence flows into regional team workflows.
Ongoing: Cluster expansion. Additional tier-2 city clusters and adjacent tier-3 markets added as regional strategies broaden.
Conclusion — Continuous Tier 2 Q-Com Data Is the 2026 Growth Standard
The Indian tier-2 Q-Com market in 2026 has become too expansion-dynamic, too city-varied, and too growth-critical for metro-anchored intelligence to serve as reliable regional-team input. Brands without continuous tier-2 city data are structurally disadvantaged against competitors that have moved to purpose-built pipelines covering 40+ tier-2 cities.
The Hyderabad cluster pattern is the entry point. Most Indian FMCG regional teams expand within 6-12 months to 50+ tier-2 cities across every major regional cluster once they see the operational lift from continuous emerging-market visibility.
FoodDataScrape builds the pipelines that deliver this intelligence — covering Zepto, Blinkit, Swiggy Instamart, and BigBasket across every tier-2 city Q-Com service with daily refresh, dark-store-level accuracy, and dedicated regional-analytics support.
If you are an FMCG regional sales VP, a trade marketing head, a Q-Com operator, or a regional category manager — continuous tier-2 city data is the fastest path to closing the emerging-market visibility gap in 2026.
Ready to See Sample Tier 2 Data? Tell us your target regional cluster and SKUs. Get a free proof-of-concept sample within 5-7 business days — no commitment required.
Contact FoodDataScrape today for continuous tier-2 city Q-Com intelligence that turns emerging-market complexity into regional growth advantage.
Related Case Studies
- 🇮🇳 India Promo ROI +18% — National chain — Zomato + Swiggy promo analysis.
- 🇮🇳 Bengaluru Cloud Kitchen Stockouts — 68% stockout cut · ₹8cr recovered.
- 🇦🇪 UAE Q-Commerce SKU — 22% assortment cut · +14% GMV growth.
Questions
Frequently Asked Questions
Per-SKU per-platform per-city pricing, promotional overlays, availability signals, dark-store-level attribution, category assortment depth, new-city launch detection, and historical time-series across Zepto, Blinkit, Swiggy Instamart, and BigBasket operations in tier-2 cities.
40+ tier-2 cities including Hyderabad, Jaipur, Lucknow, Indore, Coimbatore, Vadodara, Nagpur, Bhopal, Kanpur, Ludhiana, Chandigarh, Surat, Vishakhapatnam, Kochi, Warangal, Vijayawada, and adjacent tier-2 cluster cities including Jaipur Q-Com data services and Lucknow quick commerce data coverage. Additional cities added as scope expands.
Continuous monitoring of Q-Com platform coverage maps detects new-city launches within 7 days of activation. Detected launches are flagged in regional dashboards for brand-side response.
Yes — Hindi, Telugu, Tamil, Kannada, Bengali, Gujarati, Marathi, and other regional-language product naming variations are handled with 95%+ match accuracy.
Yes — REST API, CSV, S3, direct Snowflake integration, plus regional-team-optimized dashboards. Regional sales and trade marketing systems can consume the feed directly.
Yes — sourcing operates within Indian data compliance frameworks and only compliantly-collected retail price data is delivered. India tier-2 retail data pipeline architecture supports this compliance-aware approach across the full tier-2 Q-Com landscape, delivering tier-2 Q-Com competitor intelligence that regional teams can act on immediately.
Get a Free Food Data Sample in 48 Hours.
Tell us your platforms, target markets and required fields — we'll map exactly what's possible with food data scraping, recommend the right approach, and send a working sample so you can verify quality before any commitment.
Request a strategy call
Thanks — our data team will reach out within 48 hours with your sample.



