
Market Gap: Grocery basket costs differ by around 40% between Aldi and Waitrose.
Market Leader: Tesco leads UK grocery market share at 27.8%.
Inflation Trend: UK food inflation eased to 1.3% in August 2026.
Loyalty Pricing: Tesco and Sainsbury’s offer separate member prices.
Price Monitoring: Track promotions, unit prices and product availability across ten retailers.

UK supermarket price data is the structured record of what ten major grocers charge for the same basket online: shelf price, loyalty price, unit price, promotion, pack size and availability. In 2026 it matters because food inflation has cooled to 1.3%, yet price gaps between retailers remain wide.
That gap is the story of this report. In September 2026, Which? found the same basket cost £159.48 at Aldi and £223.38 at Waitrose, a difference of about 40% (Which?). Headline inflation hides moves like these, so brands, retailers, comparison apps and analysts need item-level UK supermarket price data.
This report explains how that data is structured. It covers market shares, the inflation trend, loyalty versus non-loyalty prices, the new unit pricing rules, promotions, own label, online versus store prices and postcode effects. It ends with a practical method for building a UK supermarket price index from public online prices only.
UK supermarket price data from the last five years shows a sharp cycle. The Office for National Statistics (ONS) recorded food and non-alcoholic beverage inflation at 19.2% in March 2023, the highest annual rate in over 45 years (ONS). By August 2026 the rate was 1.3%, unchanged from July and the lowest since September 2021 (ONS, August 2026).
The path was not smooth. Food inflation fell to 1.3% in August 2024, rose again to 5.1% in August 2025, and then eased back. For anyone tracking UK grocery prices in 2026 with UK supermarket price data, the lesson is that annual averages swing fast, and category-level detail explains why.
Different measures also tell different stories. Worldpanel by Numerator, which tracks what households actually pay, put grocery price inflation at 2.3% for the four weeks to 6 September 2026 (Worldpanel). The ONS figure is an official consumer price index; Worldpanel measures like-for-like shopper spend. Your own UK supermarket price data adds a third view: what each retailer is asking for each product, every day.
| Year (August reading) | ONS food and non-alcoholic beverage inflation, 12-month rate | Worldpanel (formerly Kantar) grocery price inflation, early August |
|---|---|---|
| 2022 | 13.1% (ONS) | 11.6%, 4 weeks to 7 Aug (Worldpanel, via news report) |
| 2023 | 13.6% (ONS) | 12.7%, 4 weeks to 6 Aug (Worldpanel, via news report) |
| 2024 | 1.3% (ONS) | 1.8%, 4 weeks to 4 Aug (Worldpanel, via news report) |
| 2025 | 5.1% (ONS) | 5.0%, 4 weeks to 10 Aug (Worldpanel, via news report) |
| 2026 | 1.3% (ONS) | 2.1%, 4 weeks to 9 Aug, like-for-like (Worldpanel, via news report) |
Any index built on UK supermarket price data needs weights, and weights start with market share. Worldpanel by Numerator's data for the 12 weeks to 6 September 2026 shows Tesco at 27.8%, Sainsbury's at 15.2% and Asda at 11.5% (Worldpanel).
The discounters are now part of the core. Aldi held 10.6% and Lidl 8.7%, with Lidl's sales up 8.0% year on year. Lidl now sits ahead of Morrisons (8.4%). Online-only Ocado was the fastest grower among the listed grocers, with sales up 13.3% and share at 2.2%.
By our own sum of these figures, the ten retailers below cover about 96.7% of the market measured by Worldpanel. That is why a ten-retailer panel is a sensible scope for UK supermarket price data. Marks & Spencer is reported separately by Worldpanel and is not fully included in its share table.
| Retailer | Market share, 12 weeks to 6 Sep 2026 | Sales growth, year on year | Price data notes |
|---|---|---|---|
| Tesco | 27.8% | +1.7% | Clubcard prices shown alongside shelf price |
| Sainsbury's | 15.2% | +2.9% | Nectar prices shown alongside shelf price |
| Asda | 11.5% | +0.1% | No separate loyalty price in Which? Sept 2026 basket |
| Aldi | 10.6% | +0.7% | Ended click and collect in August 2024 (Retail Gazette); few prices online |
| Lidl | 8.7% | +8.0% | Lidl Plus prices in Which? basket |
| Morrisons | 8.4% | +2.8% | More Card prices in Which? basket |
| Co-op | 5.5% | +2.9% | Convenience format; member prices |
| Waitrose | 4.5% | +2.8% | Premium positioning |
| Iceland | 2.3% | +2.6% | Frozen-led range |
| Ocado | 2.2% | +13.3% | Online only |
Source for share and growth: Worldpanel by Numerator. Loyalty notes: Which?.
Loyalty card pricing is the biggest structural change in UK supermarket price data this decade. Many products now carry two prices: one for members, one for everyone else. A supermarket price comparison using UK supermarket price data that records only one of them gives a misleading answer.
The Competition and Markets Authority (CMA) reviewed this in November 2024. It analysed around 50,000 loyalty-priced products and found 92% offered a genuine saving, with average member savings of 17% to 25% across Tesco, Sainsbury's, Waitrose, Co-op and Morrisons (CMA). It also found that 61 of 429 branded products checked (14%) were cheaper at another supermarket, so a loyalty price is not always the lowest price.
Which?'s September 2026 basket shows the effect at basket level. Our calculation from its figures: a Clubcard saved about 3.0% at Tesco and a Nectar card about 3.1% at Sainsbury's, while the Morrisons and Lidl gaps were under 0.5%. Asda had no separate loyalty price, yet its £186.71 basket was still slightly below Tesco's Clubcard total.
| Supermarket | Sept 2026 basket, with loyalty card | Without loyalty card | Gap (our calculation) |
|---|---|---|---|
| Aldi | £159.48 | No loyalty price | – |
| Lidl | £161.48 | £161.84 | 0.2% |
| Asda | £186.71 | No loyalty price | – |
| Tesco | £187.71 | £193.45 | 3.0% |
| Sainsbury's | £188.95 | £195.01 | 3.1% |
| Morrisons | £192.93 | £193.13 | 0.1% |
| Ocado | £208.64 | No loyalty price | – |
| Waitrose | £223.38 | No loyalty price | – |
Source: Which?, 93-item basket, monthly average; multibuys, points and personalised offers excluded. Which? notes totals cannot be compared across months because the list changes.
For any UK supermarket price data programme, the rule is simple. Capture both prices as separate fields, record the condition text ("Clubcard Price", "Nectar Price"), and collect them only where they are shown publicly to a logged-out visitor. Personalised vouchers and points live behind accounts and should not be collected.
Unit pricing is what makes UK supermarket price data comparable across pack sizes. A 400g own-label pack and a 500g branded pack only line up once both are expressed per kilogram.
The rules changed this year. The Price Marking (Amendment) Orders took effect on 6 April 2026, according to Department for Business and Trade guidance published in September 2025 (DBT guidance). The update followed CMA calls to fix inconsistent unit pricing, first raised in 2023 (CMA).
Two points matter most for teams handling UK supermarket price data. First, units are now more standard: per kilogram for goods marked by weight, per litre for goods marked by volume, and per item for goods sold by number. Second, where a product has more than one selling price, such as a loyalty price, each selling price and its unit price must be shown, with the condition displayed prominently. The rules apply online as well as in store.
| Rule area (from 6 April 2026) | What the guidance says | What it means for price data |
|---|---|---|
| Unit of measure | Per kg (weight), per litre (volume), per item (sold by number) | Normalise every record to £/kg, £/litre or £/each |
| More than one price | Each selling price and unit price shown, with conditions | Expect a loyalty unit price as well as a shelf unit price |
| Multi-buys | Identical-item offers such as "2 for £3" do not qualify for the exemption | Promotional unit prices become more visible |
| Online sales | Order applies to online sales and catalogues | Retailer websites are a valid public source |
| Small shops | Shops up to 280 sq m exempt for pre-packed constant-quantity goods | Convenience stores may show fewer unit prices in store |
| Scope | Great Britain; Northern Ireland has its own order | Flag NI postcodes separately |
Source: DBT guidance on the Price Marking Order 2004.
Promotions are back in growth. Worldpanel reported that spending on grocery deals rose by £243m, or 7.0% year on year, in the 12 weeks to 6 September 2026, against 1.4% growth for full-price sales (Worldpanel). Own-label sales grew 2.9% over the same period.
For UK supermarket price data this means a weekly snapshot misses a lot. Promotions start and end mid-week, loyalty deals rotate, and "was/now" prices need a reference period. A daily capture, with promotion type and dates as fields, is the minimum for a credible UK supermarket price index. Our guide to extracting weekly offers data from UK supermarkets covers the offer side in more detail.
Own label versus branded is the other key split in UK supermarket price data. Discounters sell mostly own label, while the big four sell both side by side. Matching an own-label item to its branded equivalent needs pack size, unit price and attribute rules, not just product names. We cover this in our branded vs private label UK price analysis.
| Price signal | Field to capture | Why it matters |
|---|---|---|
| Shelf price | price_gbp | Base price every shopper sees |
| Loyalty price | loyalty_price_gbp, loyalty_scheme | Member price where shown publicly |
| Unit price | unit_price_gbp, unit_basis (kg / litre / each) | Fair comparison across pack sizes |
| Promotion | promo_type, promo_text, promo_start, promo_end | Separates temporary from permanent moves |
| Was / now | was_price_gbp | Context for discounts |
| Own label flag | is_own_label, brand | Own-label vs branded comparisons |
| Availability | in_stock | Price is only meaningful when buyable |
A common question from comparison apps is whether a supermarket's website price equals its shelf price. The honest answer is that it depends on the retailer, the format and the channel, and it should be tested rather than assumed.
Three dimensions are worth measuring in UK supermarket price data. Format: convenience stores (such as Express, Local and Co-op formats) may price differently from large stores. Channel: online delivery, click and collect and in-store can differ. Location: some retailers set online prices and ranges by delivery postcode or serving store, which affects both price and availability.
Which?'s own method shows the practical route. It uses online prices from an independent price comparison provider and sends fieldworkers to stores without online prices (Which?). A UK supermarket price data panel can do the same online, by sampling a fixed set of postcodes across UK regions and recording which postcode each price came from.
| Variation dimension | How to test with public data | Latest public evidence |
|---|---|---|
| Online vs in-store | Compare website price with a store-visit sample | No current UK grocery study found. A 10-country study found online and offline prices identical about 72% of the time, across all retail (NBER w22142, 2016). Groceries bought via delivery apps cost at least 20% more than direct from the supermarket (Which?, Oct 2025) |
| Large store vs convenience format | Compare formats that publish online prices | Morrisons Daily about 21%, Sainsbury's Local about 14% and Tesco Express about 11% dearer than the same chain's supermarkets (Which?, Sep 2024) |
| Delivery postcode | Same basket across a fixed postcode panel | No public UK study found; Which? notes app delivery charges vary by location and time |
| England, Scotland, Wales, Northern Ireland | Regional postcode sample | Food price levels ranged only 97.6–102.2 (UK = 100): Wales 100.8, Scotland 99.8, Northern Ireland 99.7, as large grocers price nationally (ONS, 2016 data) |
| Availability by postcode | In-stock rate per postcode | No location-level study found. Proxy: 29% of online shoppers got a substitute in their last order, Asda highest at 47% (Which?, Mar 2025) |
The ONS itself is changing how grocery prices are measured. From March 2026 it began adding grocery scanner data to consumer price statistics, covering around 50% of the grocery market and about 300 million price points a month (ONS). Scanner data reflects average prices paid, including loyalty and multi-buy transactions, and the ONS uses a GEKS-Törnqvist index method.
Scanner data is not available to most businesses. Public online UK supermarket price data is. A UK supermarket price index built from websites cannot see what shoppers paid, but it can see what every retailer asks for every product, every day. That is exactly what pricing, category and comparison teams need.
The method below follows the same logic as official statistics, adapted to public UK supermarket price data. Each step can be audited.
| Step | What happens | Key choice |
|---|---|---|
| 1. Define the basket | Fixed list of items across categories, own label and branded | Use stable product IDs and GTINs where shown on the page |
| 2. Collect daily | Public product pages for 10 retailers, logged out | Respect robots.txt, terms of service and rate limits |
| 3. Normalise | Convert to £/kg, £/litre or £/each using pack size | Follow the 2026 unit pricing units |
| 4. Match products | Same GTIN, or like-for-like rules for own label | Record match confidence |
| 5. Treat loyalty prices | Store shelf and public loyalty price separately | Publish two index lines: shelf and loyalty |
| 6. Weight | Retailer weights from published market share | Worldpanel shares, refreshed quarterly |
| 7. Calculate | Month-on-month and year-on-year change by category and retailer | Document method; flag stock-outs and range changes |
Source for official approach: ONS. Index design above is the Food Data Scrape method.
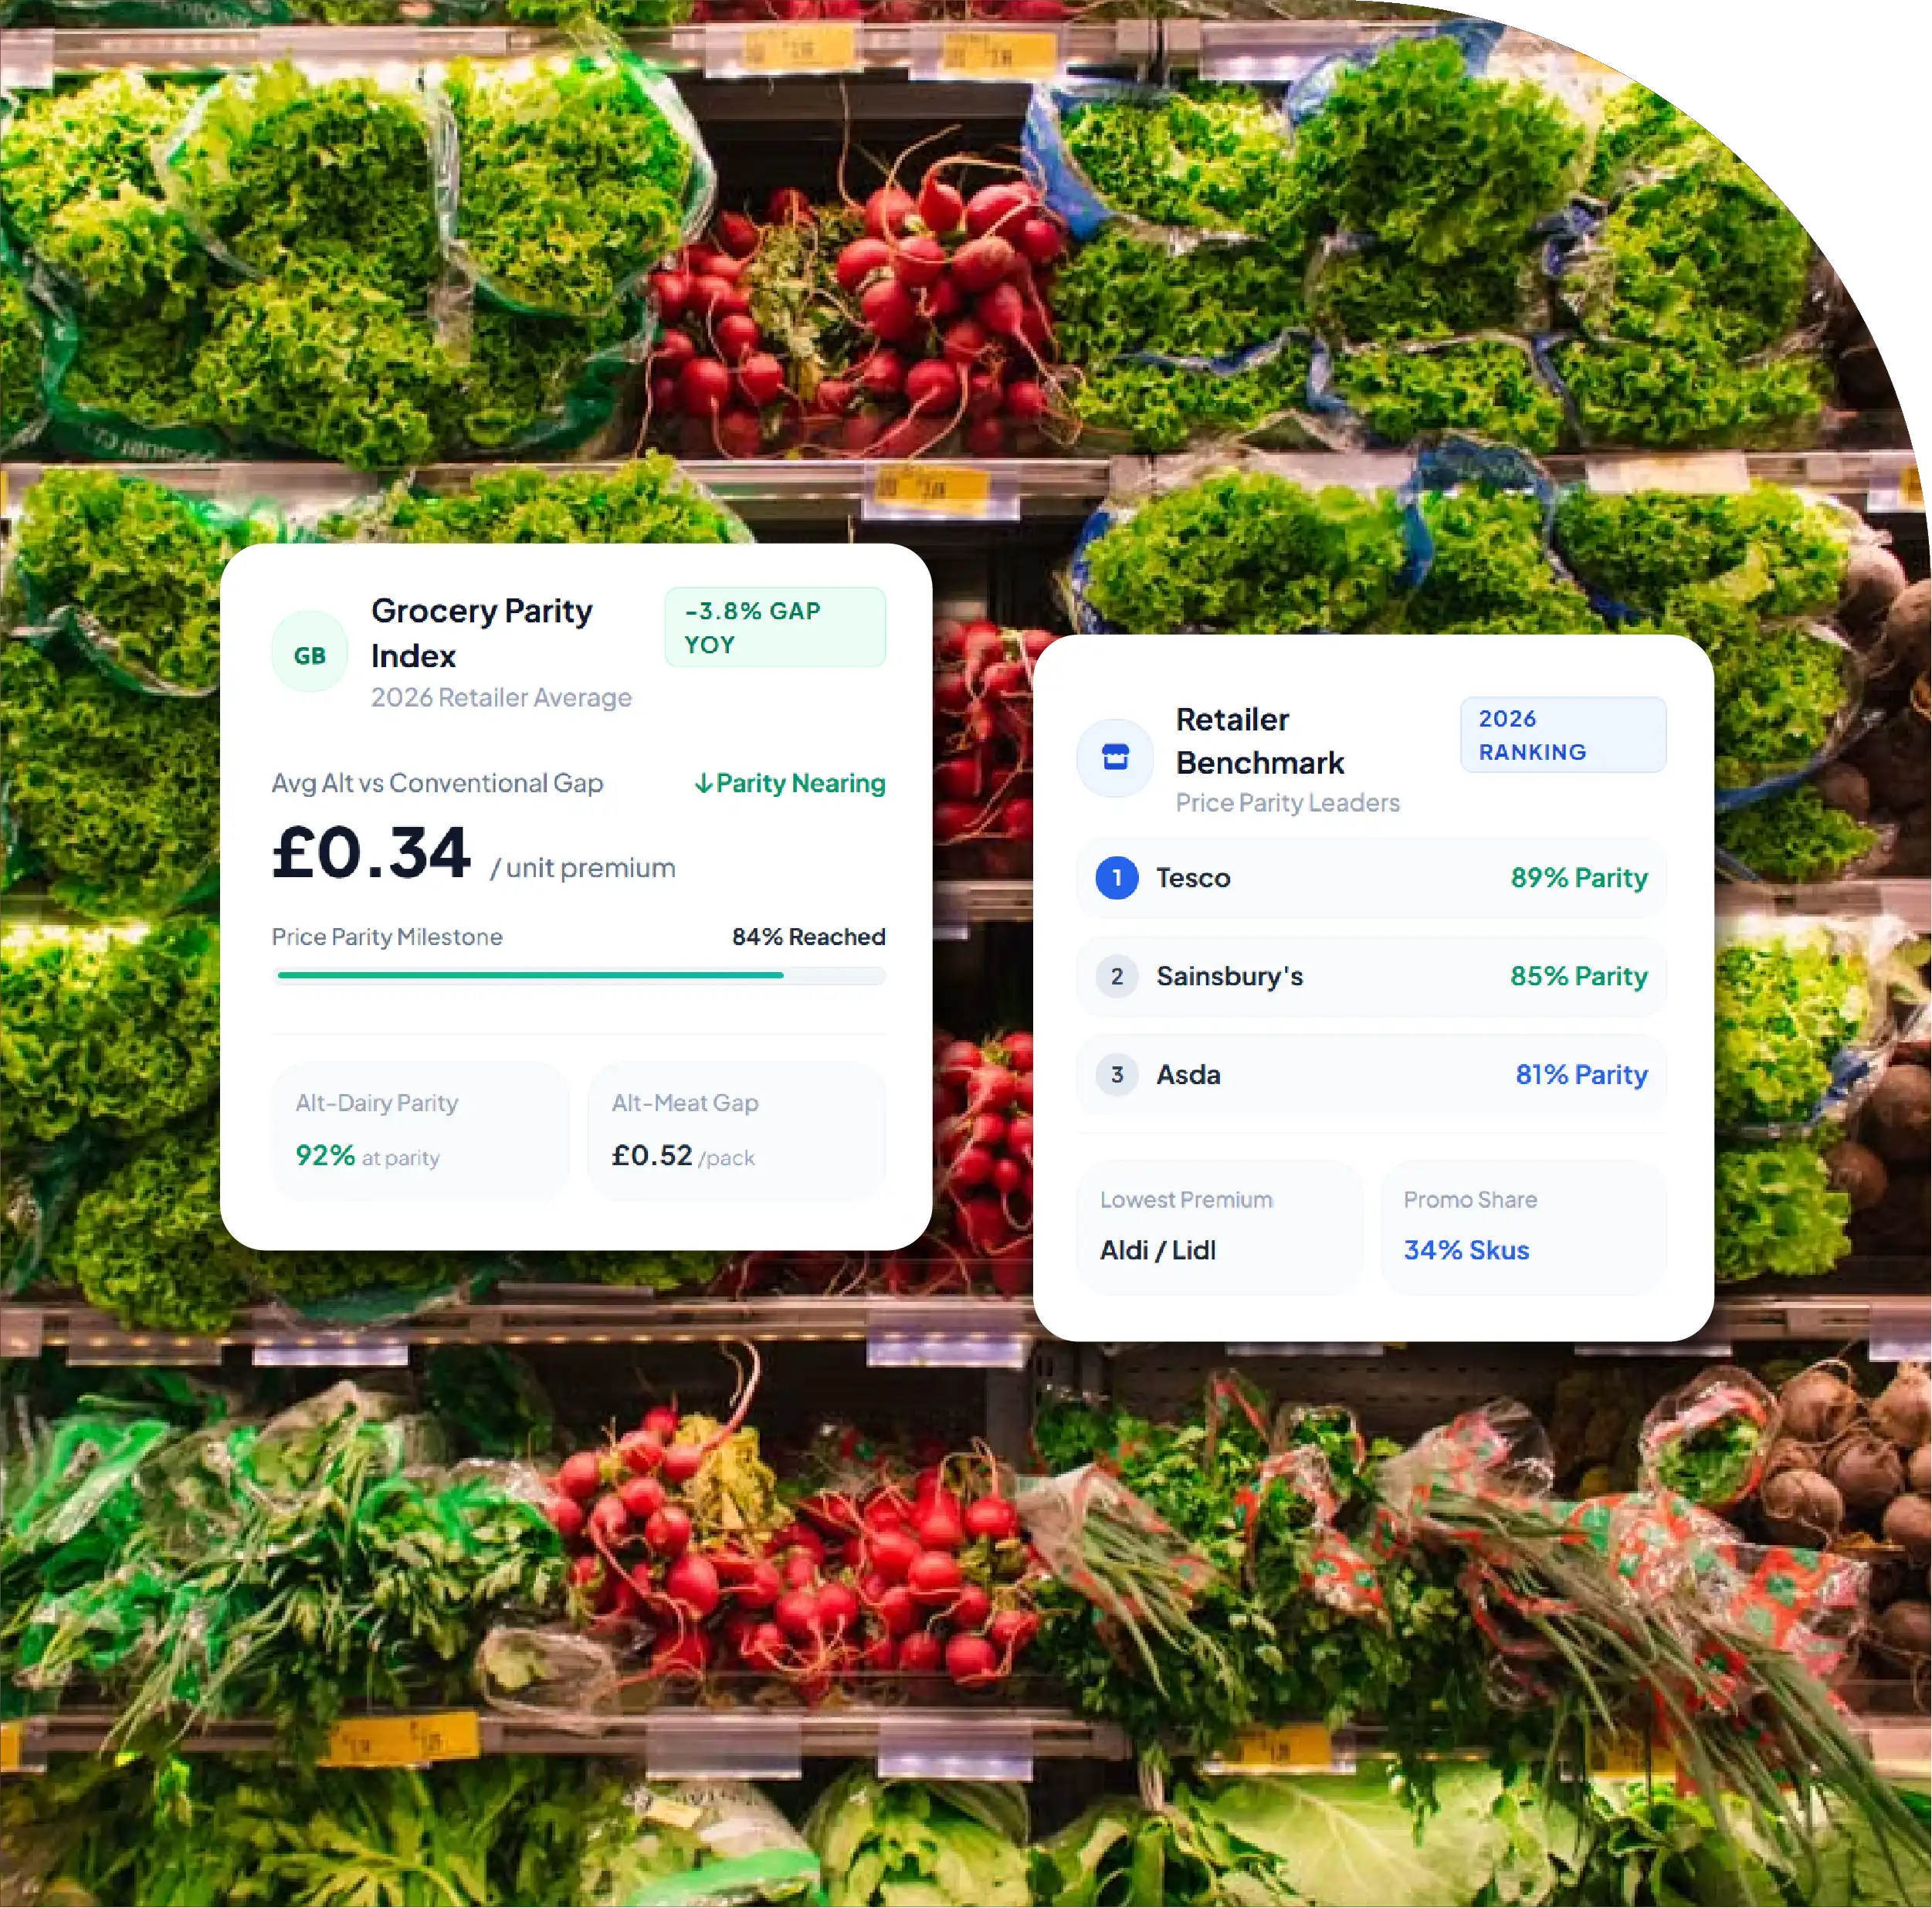
Demand for UK supermarket price data is broad. Last month our team saw several separate requests for UK grocery price feeds, including from a grocery comparison app and a meal-planning app. Public market listings also show requests for UK convenience-store product databases with barcodes, nutrition and allergen fields. Our earlier UK work collected product and review data from a major supermarket's public pages. For a ready view, see our UK grocery price parity data and grocery price tracking dashboard.
1. Ten-retailer UK coverage: Daily public UK supermarket price data from Tesco, Sainsbury's, Asda, Aldi, Lidl, Morrisons, Waitrose, Ocado, Iceland and Co-op, scoped on our United Kingdom coverage page.
2. Shelf and loyalty prices kept apart: Both captured as separate fields, only where shown to logged-out visitors, with the scheme name recorded.
3. Unit price normalisation: Every record converted to £/kg, £/litre or £/each in line with the April 2026 rules.
4. Product matching: GTIN matching where barcodes are public, plus documented rules for own-label equivalents.
5. Index-ready outputs: Basket indices by retailer, category and region, delivered as CSV, API or dashboard, with the match rate reported for every delivery.
6. Compliance by design: Public business data only; no logins, no personal data, robots.txt and rate limits respected.
UK grocery prices in 2026 look calm on the surface. ONS food inflation is 1.3%, but basket costs still differ by about 40% between the cheapest and most expensive grocer, loyalty prices split the market into two price lists, and promotions are growing faster than full-price sales.
UK supermarket price data turns that complexity into something you can measure. With shelf prices, loyalty prices, unit prices and promotions captured daily and weighted by market share, a business can run its own UK supermarket price index. Request a free sample of UK supermarket price data from our team via the contact page.
Questions
It is a structured record of product prices at UK grocers, usually including shelf price, loyalty price, unit price, promotion, pack size, brand and availability, captured on a regular schedule.
In Which?'s September 2026 basket, Aldi was cheapest at £159.48, just ahead of Lidl at £161.48 with Lidl Plus. Waitrose was the most expensive at £223.38.
The CMA found 92% of around 50,000 loyalty-priced products offered a genuine saving, with average savings of 17% to 25%. It also found some items cheaper at other supermarkets.
From 6 April 2026, amended price marking rules standardise units (per kg, per litre, per item) and require unit prices for each selling price, including loyalty prices, with conditions shown clearly.
Yes, but collect only prices shown publicly to logged-out visitors, follow each site's terms of service and robots.txt, and never collect personalised offers or account data.
Daily is the practical minimum, because promotions and loyalty deals change mid-week. Weekly snapshots can miss short offers.