

Chain-Level Price Leadership
Ranks major chains by movement on a fixed core-menu basket, held constant across quarters so changes are directly comparable.
Metro Price Geography
Prices the identical basket across major US cities to quantify how far franchise-level and local-cost pricing diverges.
Item-Level Movers
Identifies the individual menu items driving each chain's increases, with old and new prices and percentage change.
Value-Menu Reality Check
Tests whether advertised value tiers are genuinely holding price, quietly repriced, or held at the cost of portion and drink size.
Inflation Context
Sets the tracked menu-price index against official food-away-from-home and food-at-home inflation reporting, cited and linked at source.

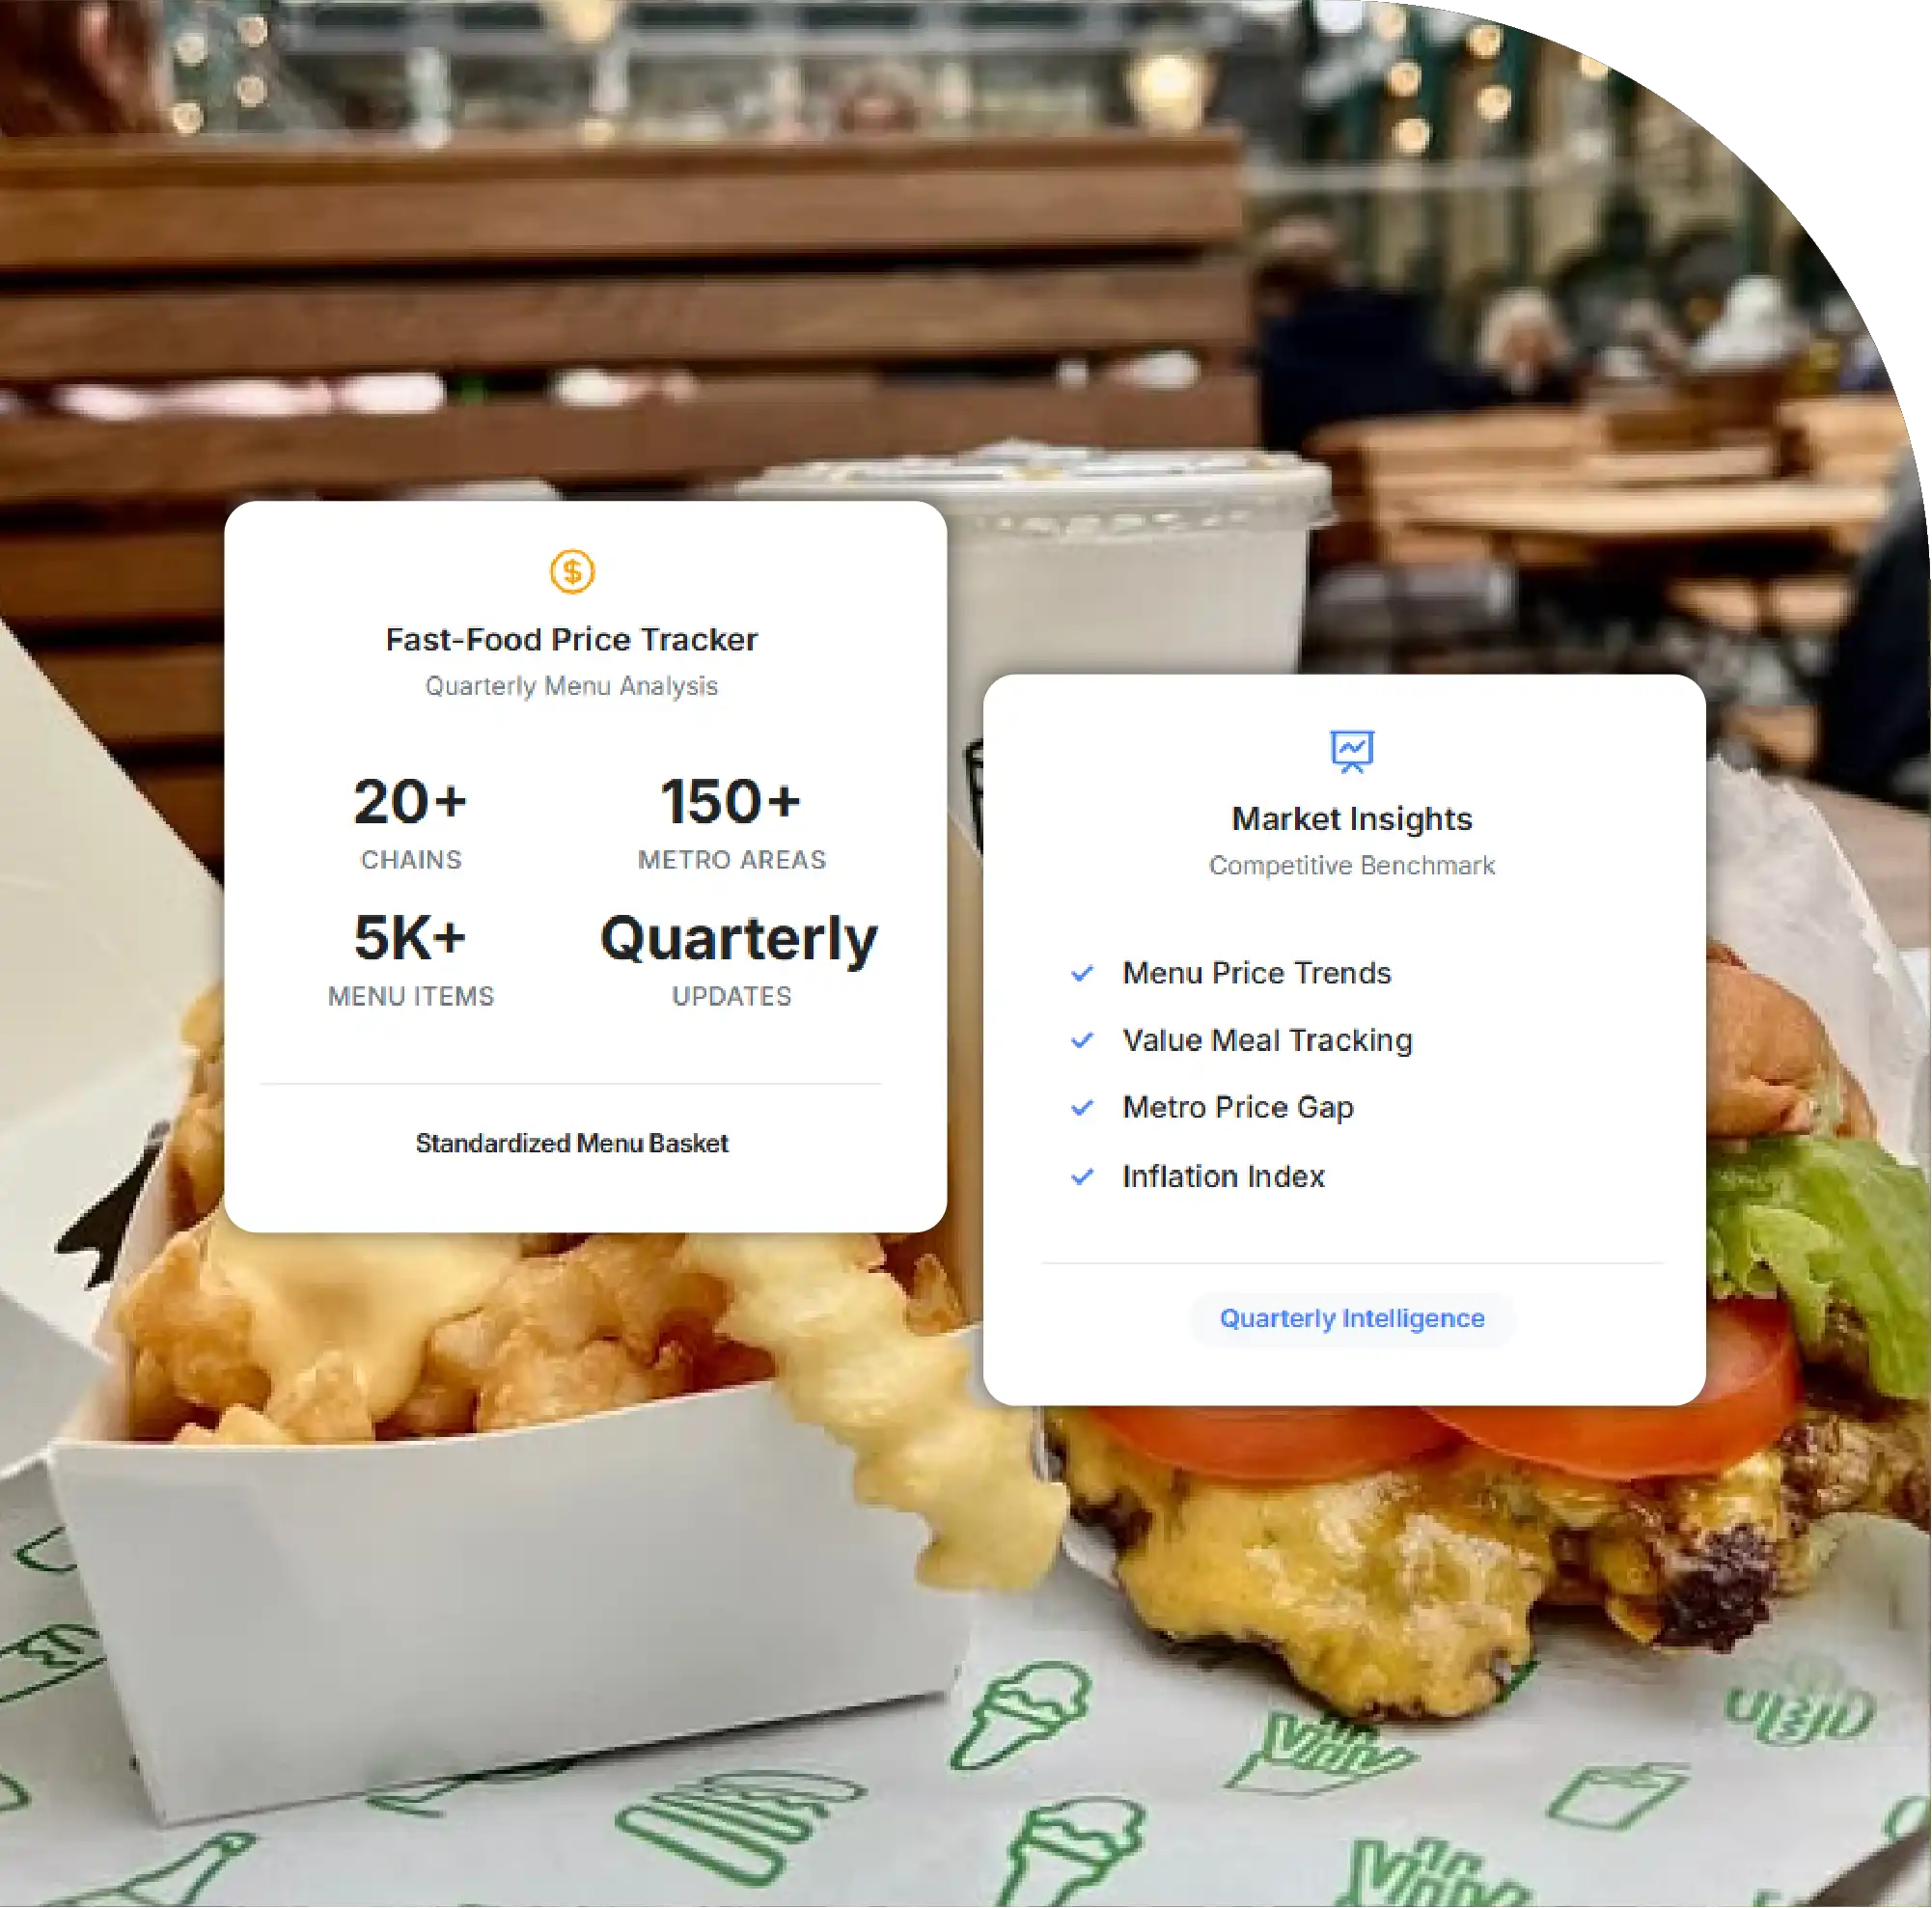
A fixed core-menu basket — flagship sandwich, medium fries, medium drink, signature combo — priced at 8 major chains across 12 US cities, and tracked every quarter.
$9.14
Average tracked menu item, up 5.8% since Q1 2025
+11.3%
Biggest riser: Chain A's core menu
+1.4%
Flattest: Chain H's core menu
28.6%
Same combo, cheapest vs priciest city
Tracked-basket price and change since the first tracked quarter. Same items, same sizes, every quarter.
Across 8 chains and 12 cities, the average tracked menu item now costs $9.14, up 5.8% since the Q1 2025 baseline. The steepest riser was Chain A at +11.3% on its tracked core menu; the flattest was Chain H at +1.4%.
| Chain | Tracked Basket, Q3 2026 | Q1 2025 Baseline | Change |
|---|---|---|---|
| Chain A | $16.85 | $15.14 | +11.3% |
| Chain B | $15.40 | $14.06 | +9.5% |
| Chain C | $17.20 | $15.90 | +8.2% |
| Chain D | $14.75 | $13.84 | +6.6% |
| Chain E | $13.90 | $13.19 | +5.4% |
| Chain F | $18.10 | $17.33 | +4.4% |
| Chain G | $12.60 | $12.25 | +2.9% |
| Chain H | $14.20 | $14.00 | +1.4% |
Identical basket, identical quarter — priced in 12 metros to show how far franchise pricing diverges.
The same tracked combo ranges from $11.20 in the cheapest metro to $14.40 in the priciest — a 28.6% spread on identical items.
The ten largest individual item increases in the tracked set. This is the table that gets screenshotted.
| # | Item | Chain | Old → New | Change |
|---|---|---|---|---|
| 1 | Signature combo, medium | Chain A | $9.99 → $12.29 | +23.0% |
| 2 | Chicken sandwich, spicy | Chain C | $5.49 → $6.59 | +20.0% |
| 3 | Medium fries | Chain B | $3.29 → $3.89 | +18.2% |
| 4 | Flagship burger | Chain A | $5.79 → $6.79 | +17.3% |
| 5 | Breakfast sandwich | Chain D | $4.19 → $4.89 | +16.7% |
| 6 | Medium soft drink | Chain B | $1.89 → $2.19 | +15.9% |
| 7 | Burrito, chicken | Chain F | $10.45 → $11.95 | +14.4% |
| 8 | 8-piece nuggets | Chain E | $4.99 → $5.69 | +14.0% |
| 9 | Footlong, classic | Chain G | $8.49 → $9.29 | +9.4% |
| 10 | Two-piece chicken meal | Chain H | $8.99 → $9.69 | +7.8% |
Our tracked index alongside official food inflation — cited and linked, never recalled from memory.
Our tracked fast-food basket is up 5.8% since the Q1 2025 baseline. The line below plots our index only.
Are advertised value tiers actually holding price while core menus climb?
Across the chains running a named value tier, tracked value items rose 2.1% against 6.4% on core menus — but two chains held the advertised price by shrinking portion or drink size, and one moved three items off the value tier entirely. Held price, smaller item: the value menu is holding its headline more than its value.
"Fast food got more expensive" is a chain-level story, not an industry one. The gap between the steepest and flattest chain (11.3% vs 1.4%) is wider than the industry average move.
Where you order matters as much as what you order. The same combo carries a 28.6% spread across tracked metros — franchise pricing, local costs and platform markups compound.
Watch the value tier's size, not its price. Advertised value prices held on most tracked items; portion and drink sizes did not.
Basket: fixed core-menu items per chain, defined by exact size and variant (flagship burger/sandwich, medium fries, medium drink, signature combo). Substitutions documented when an item leaves the menu.
Source & markup basis: [state one basis and hold it — chain-site prices or delivery-platform prices. Platform prices typically carry a markup; the two are never mixed in one series.]
Cities & sampling: 12 metros, 3 locations per chain per city, collected [dates].
Change basis: all percentages compare against the first tracked quarter (Q1 2025).
Promotions: [state whether limited-time promos are included or excluded — and keep it consistent across quarters].
Limitations: franchise pricing varies location to location, so chain figures are averages of sampled locations, not national list prices.
Update cadence: quarterly on this URL, with a changelog. Next update [month].
Questions
On our fixed core-menu basket — flagship sandwich, medium fries, medium drink and signature combo — Chain A rose most at +11.3% since the Q1 2025 baseline. Figures reflect our tracked basket at sampled locations, not national list prices.
Our tracking starts at Q1 2025, so we scope comparisons to that window: the average tracked item moved from $8.64 to $9.14, up 5.8%. We don't extend the series back beyond data we collected.
Franchise-level pricing freedom, local labor and rent costs, and delivery-platform markups. Our tracker shows a 28.6% spread on identical baskets between the cheapest and priciest tracked metro.
Quarterly, on this same URL, with a changelog entry for every refresh and any basket change. Next update [month].



