The Client
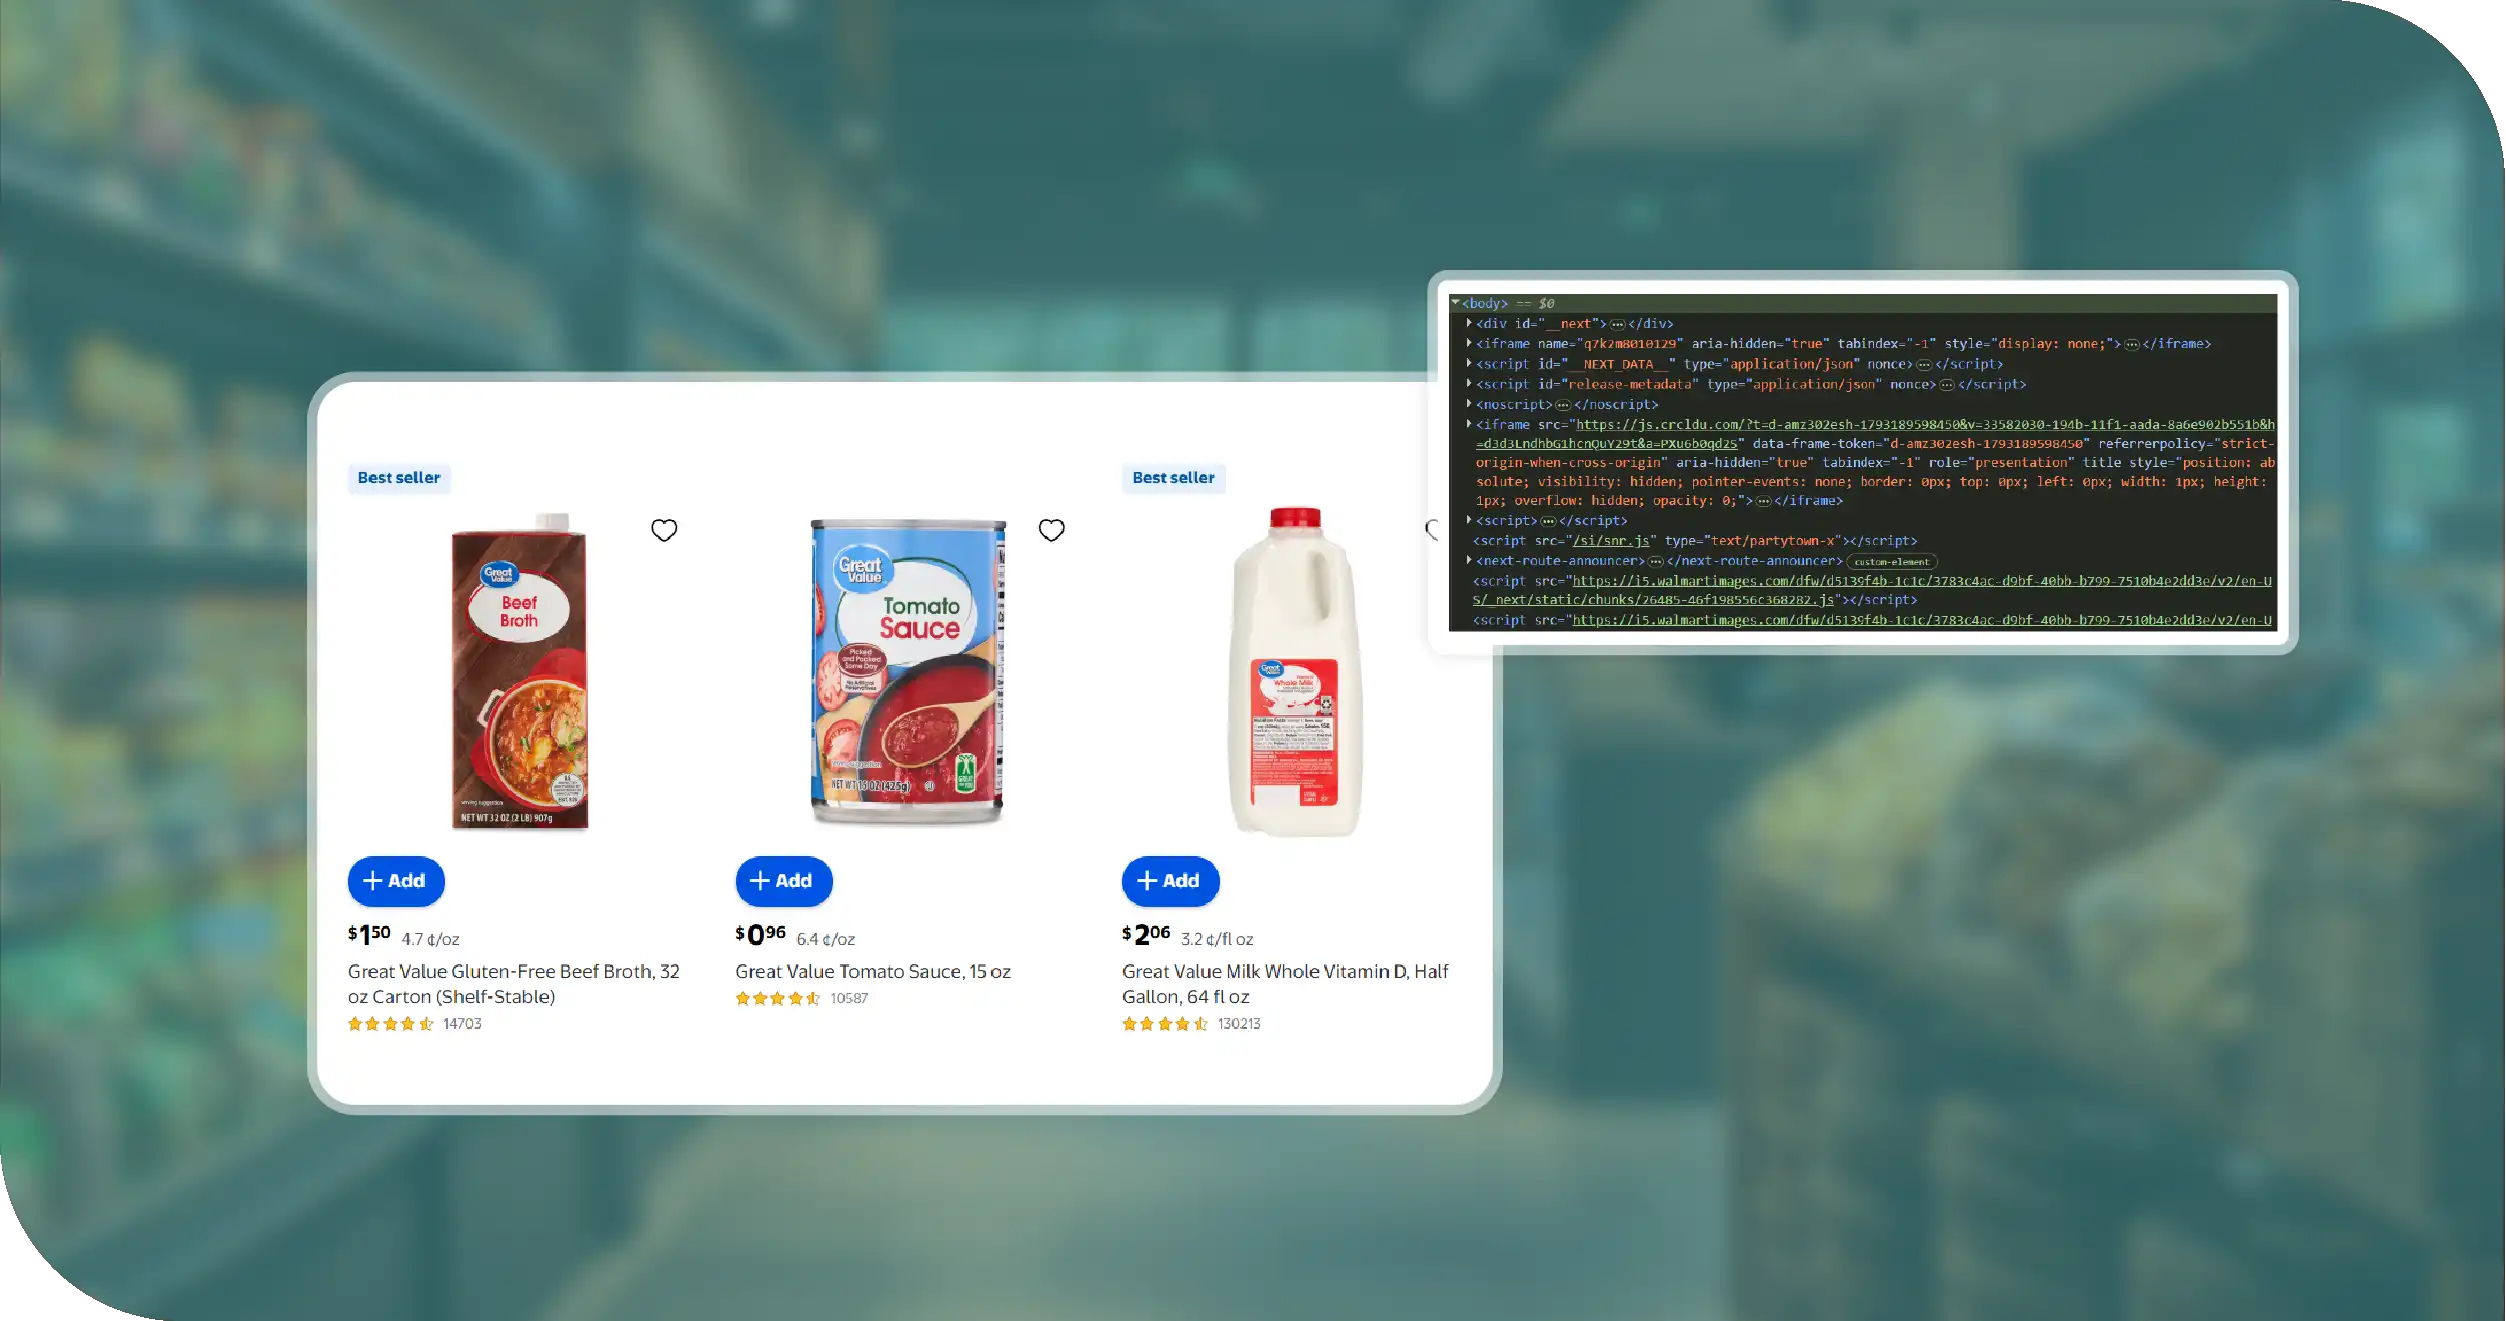
The client was a retail analytics and market intelligence company seeking a dependable way to understand Walmart's product availability, store-level pricing, and grocery inventory patterns. Its business users required structured information to compare products across selected locations, evaluate changing prices, and identify potential stock fluctuations. The company wanted to strengthen its Walmart Inventory Analytics capabilities by bringing product information, pricing records, and inventory indicators into a unified analytical environment.
Access to reliable Walmart Product Availability Data was essential for examining whether particular grocery and household products appeared available, unavailable, or subject to location-specific restrictions. The client also needed Walmart Real-Time Inventory Data collection workflows to capture frequent changes wherever publicly accessible information permitted. Its existing research processes involved fragmented sources and repetitive manual checks, making comparisons time-consuming. The client therefore sought a scalable data scraping partner capable of delivering organized records, consistent field structures, quality controls, and analysis-ready outputs that could support retail intelligence, reporting, and strategic planning.
Key Challenges
-
Inconsistent Store-Level Pricing
The client struggled to compare prices across Walmart locations because product prices, discounts, and promotional offers could vary by store, delivery address, and collection time. Real-Time Price Monitoring was needed to identify meaningful changes and improve the consistency of competitive pricing analysis. -
Product Availability Visibility
Identifying product availability across different locations presented difficulties because stock indicators could change frequently or appear differently across shopping experiences. The client needed a reliable Walmart Grocery Delivery Scraping API approach to capture accessible product and availability information consistently for comparison and analysis. -
Fragmented Data and Limited Scalability
The client lacked a centralized structure for analyzing product descriptions, prices, promotions, and availability signals together. Developing a standardized Walmart Grocery Delivery Dataset was necessary to reduce manual consolidation, improve historical comparisons, and support repeatable reporting across product categories and selected markets.
Key Solutions
-
Automated Product and Inventory Collection
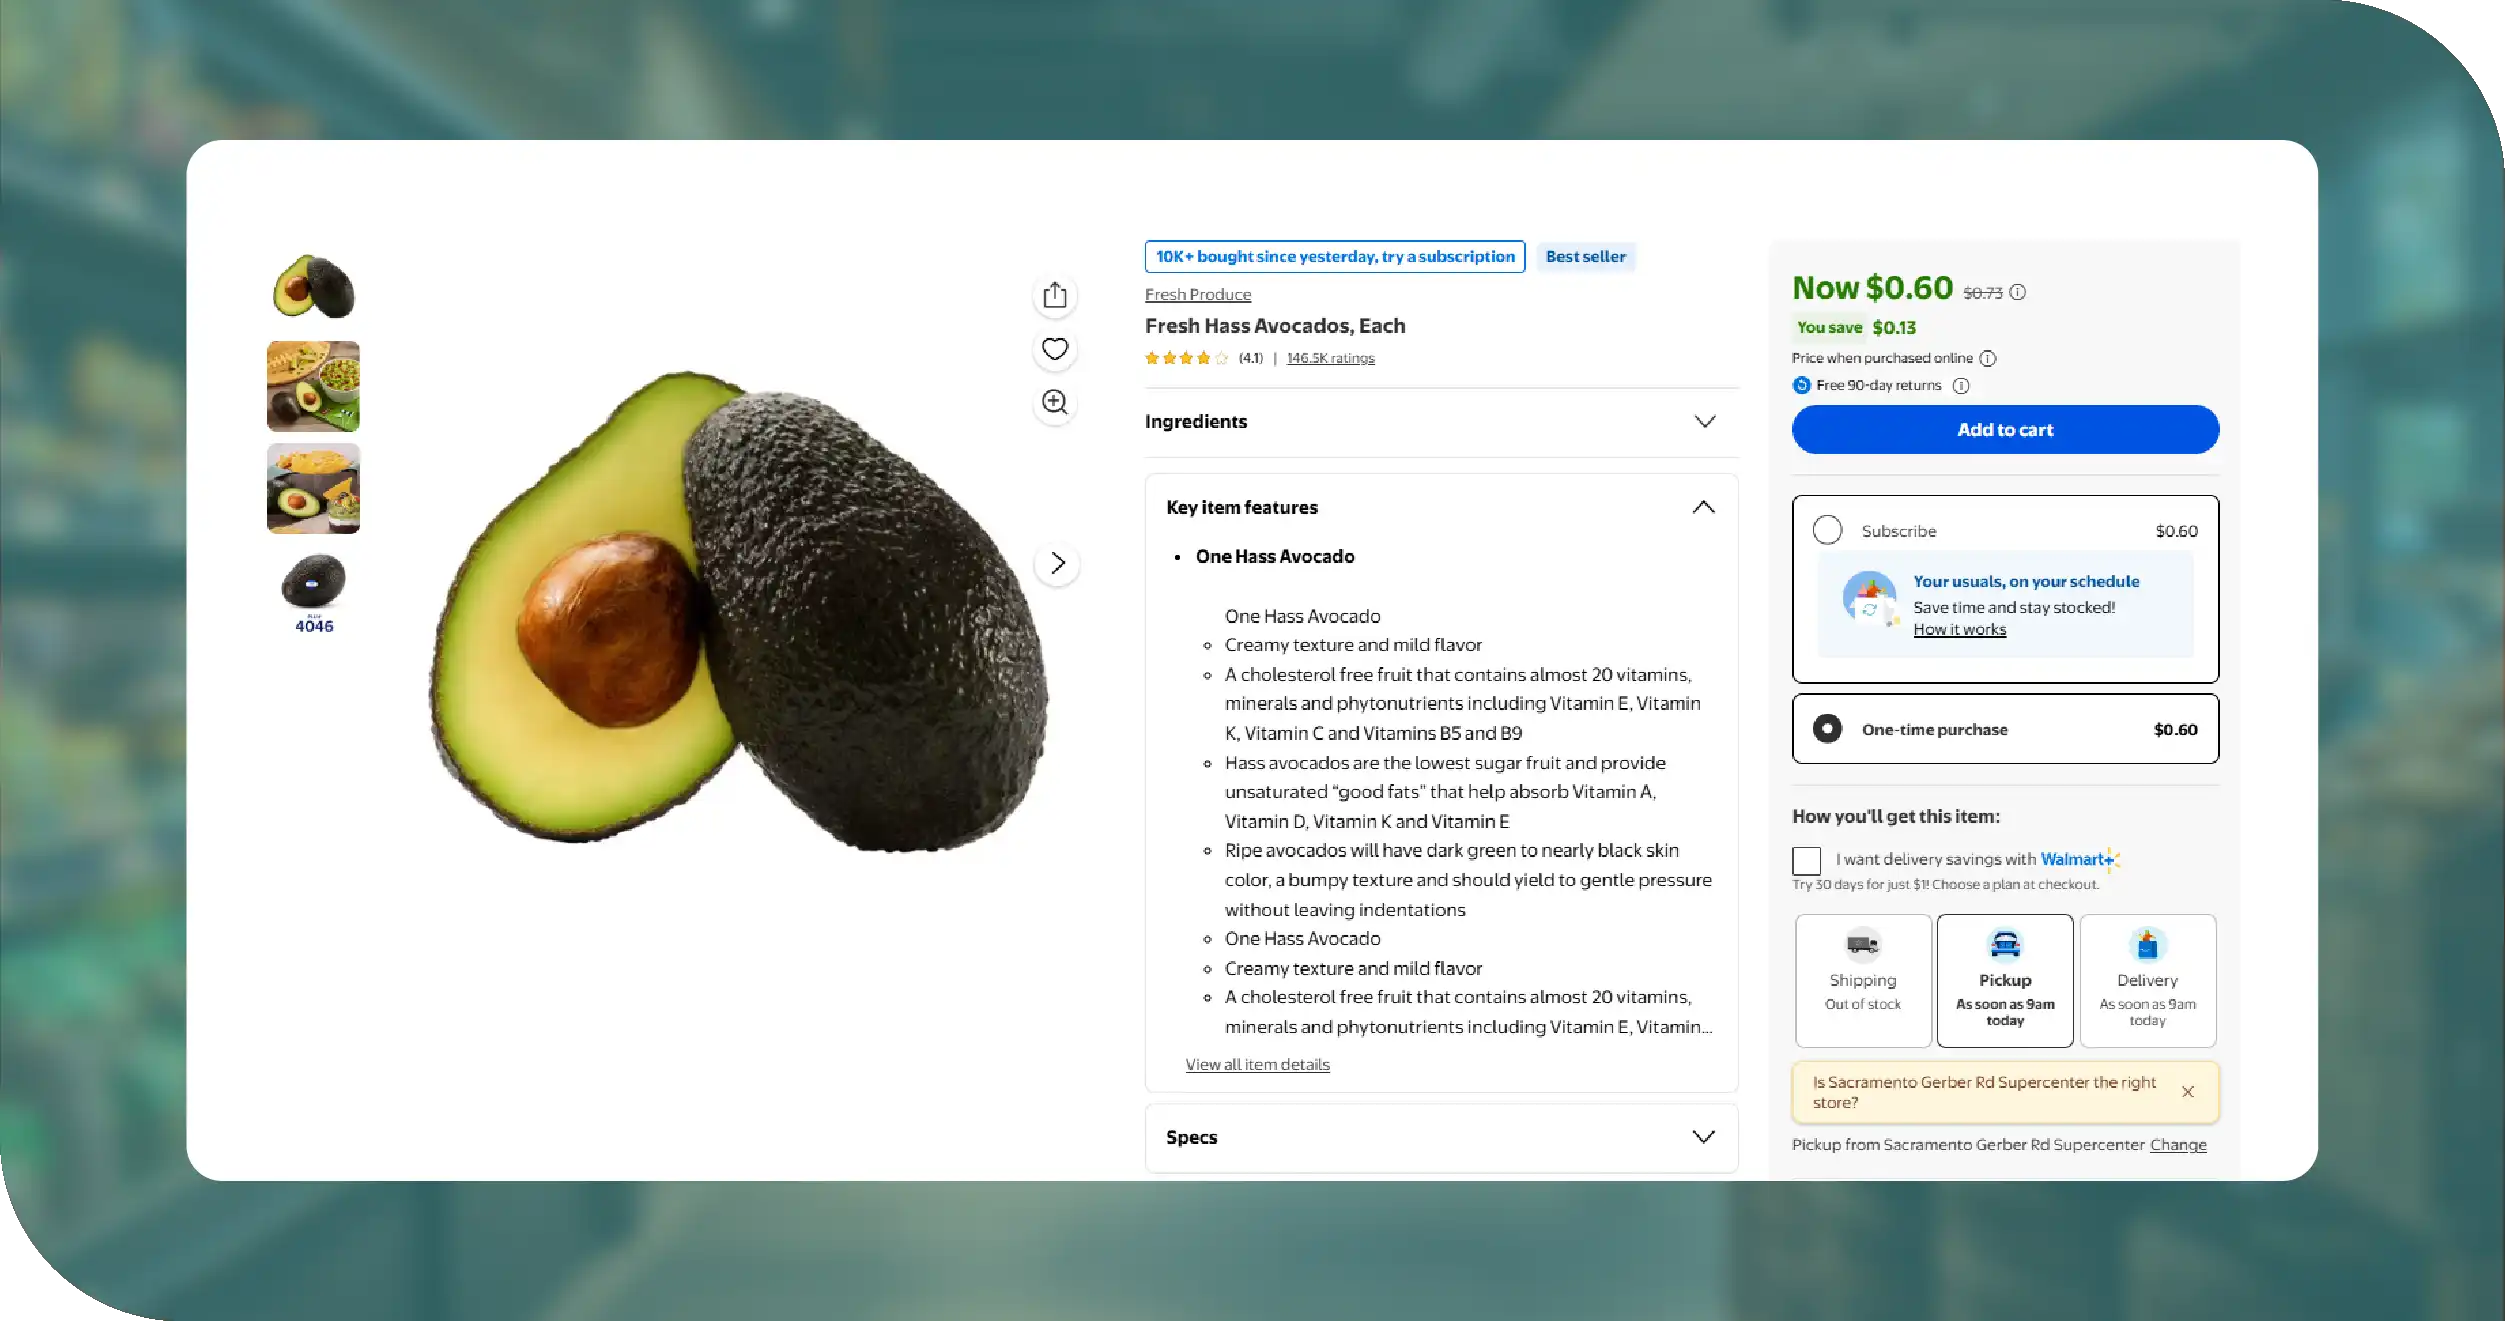
We developed an automated scraping workflow to collect publicly accessible Walmart product information, including product identifiers, titles, category details, listed prices, and displayed availability indicators. Scheduled extraction helped reduce repetitive research and established consistent records for downstream retail analysis. -
Price Normalization and Store Comparison
We standardized product names, identifiers, price fields, promotional indicators, and location references to support reliable comparisons. Validation checks helped identify missing fields, duplicate records, and inconsistent formats, enabling the client to evaluate pricing differences and monitor changes across supported store and delivery contexts. -
Structured Data Delivery and Reporting
We organized collected information into analysis-ready datasets suitable for spreadsheets, databases, dashboards, and business intelligence workflows. Configurable delivery schedules and repeatable processing enabled the client to review product movements, examine historical observations, and incorporate retail data into existing analytical systems.
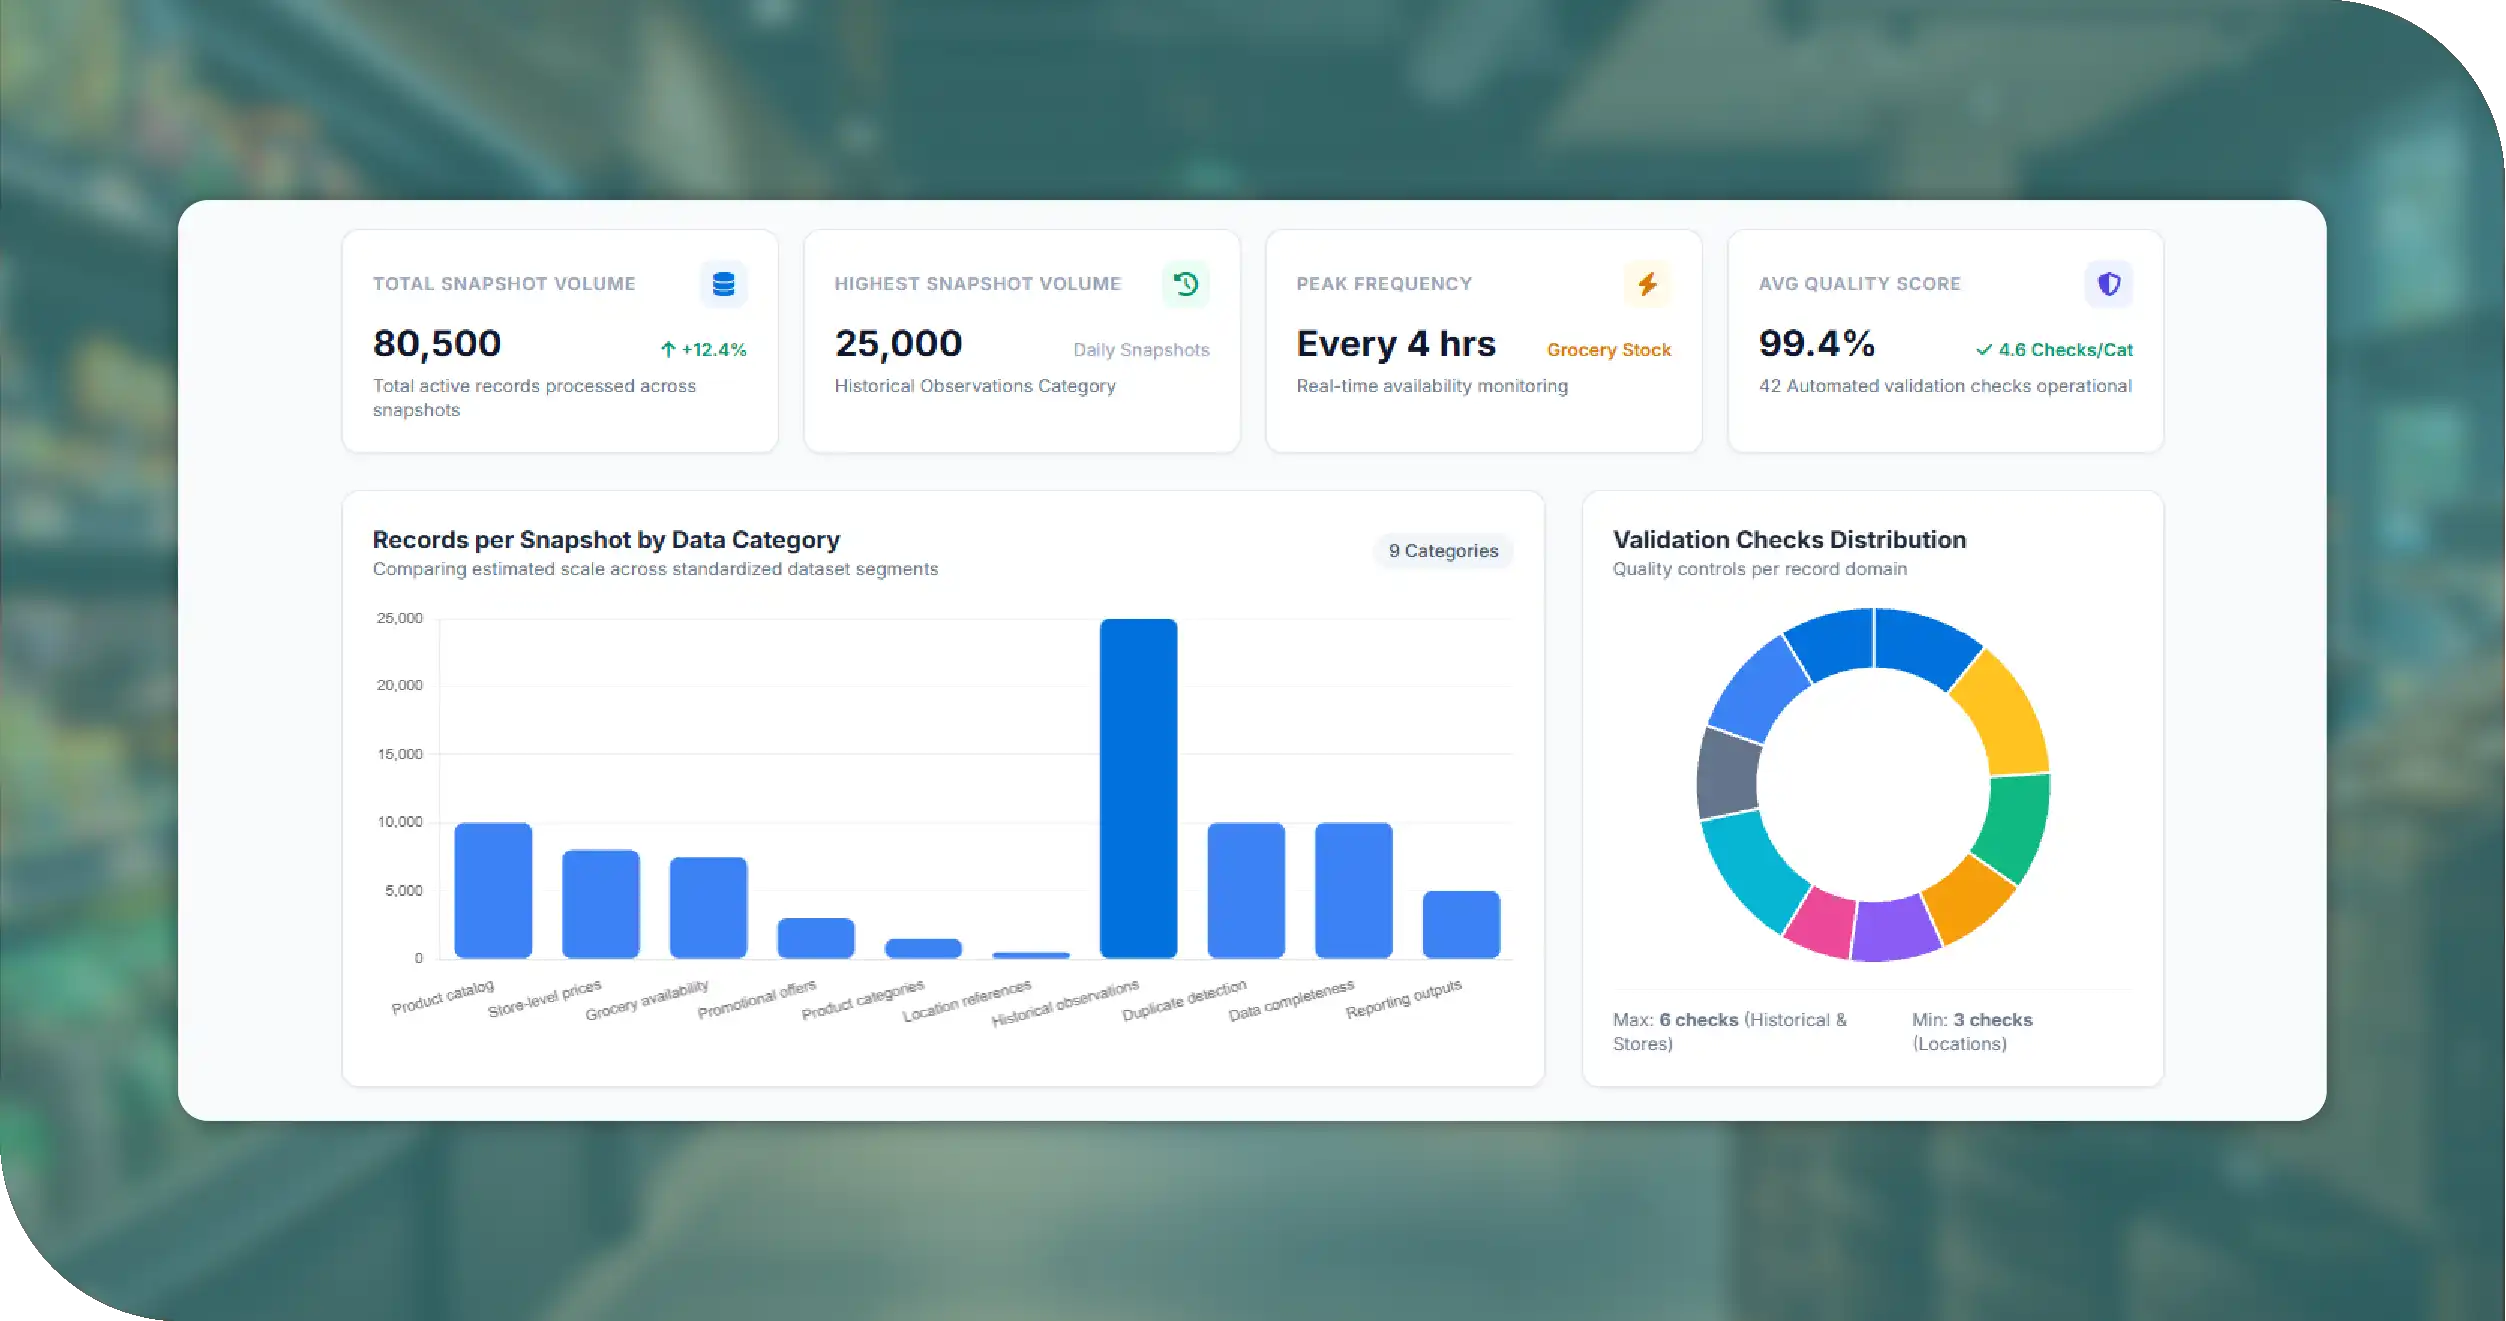
Detailed Data Collection and Analytics Table
The following table illustrates a proposed reporting structure for the engagement. Numerical values are illustrative planning examples, not verified Walmart inventory figures or measured project results.
| Data Category | Records per Snapshot | Fields per Record | Sample Frequency | Validation Checks | Primary Metric |
|---|---|---|---|---|---|
| Product catalog | 10,000 | 12 | Daily | 5 | Product coverage |
| Store-level prices | 8,000 | 10 | Every 6 hours | 6 | Price variation |
| Grocery availability | 7,500 | 9 | Every 4 hours | 5 | Availability rate |
| Promotional offers | 3,000 | 8 | Every 12 hours | 4 | Discount percentage |
| Product categories | 1,500 | 7 | Weekly | 4 | Category coverage |
| Location references | 500 | 6 | Weekly | 3 | Location mapping |
| Historical observations | 25,000 | 11 | Daily | 6 | Change frequency |
| Duplicate detection | 10,000 | 5 | Each processing run | 4 | Duplicate rate |
| Data completeness | 10,000 | 8 | Each processing run | 5 | Completeness rate |
| Reporting outputs | 5,000 | 10 | Daily | 4 | Report readiness |
Methodologies We Used
-
Source Identification and Field Mapping
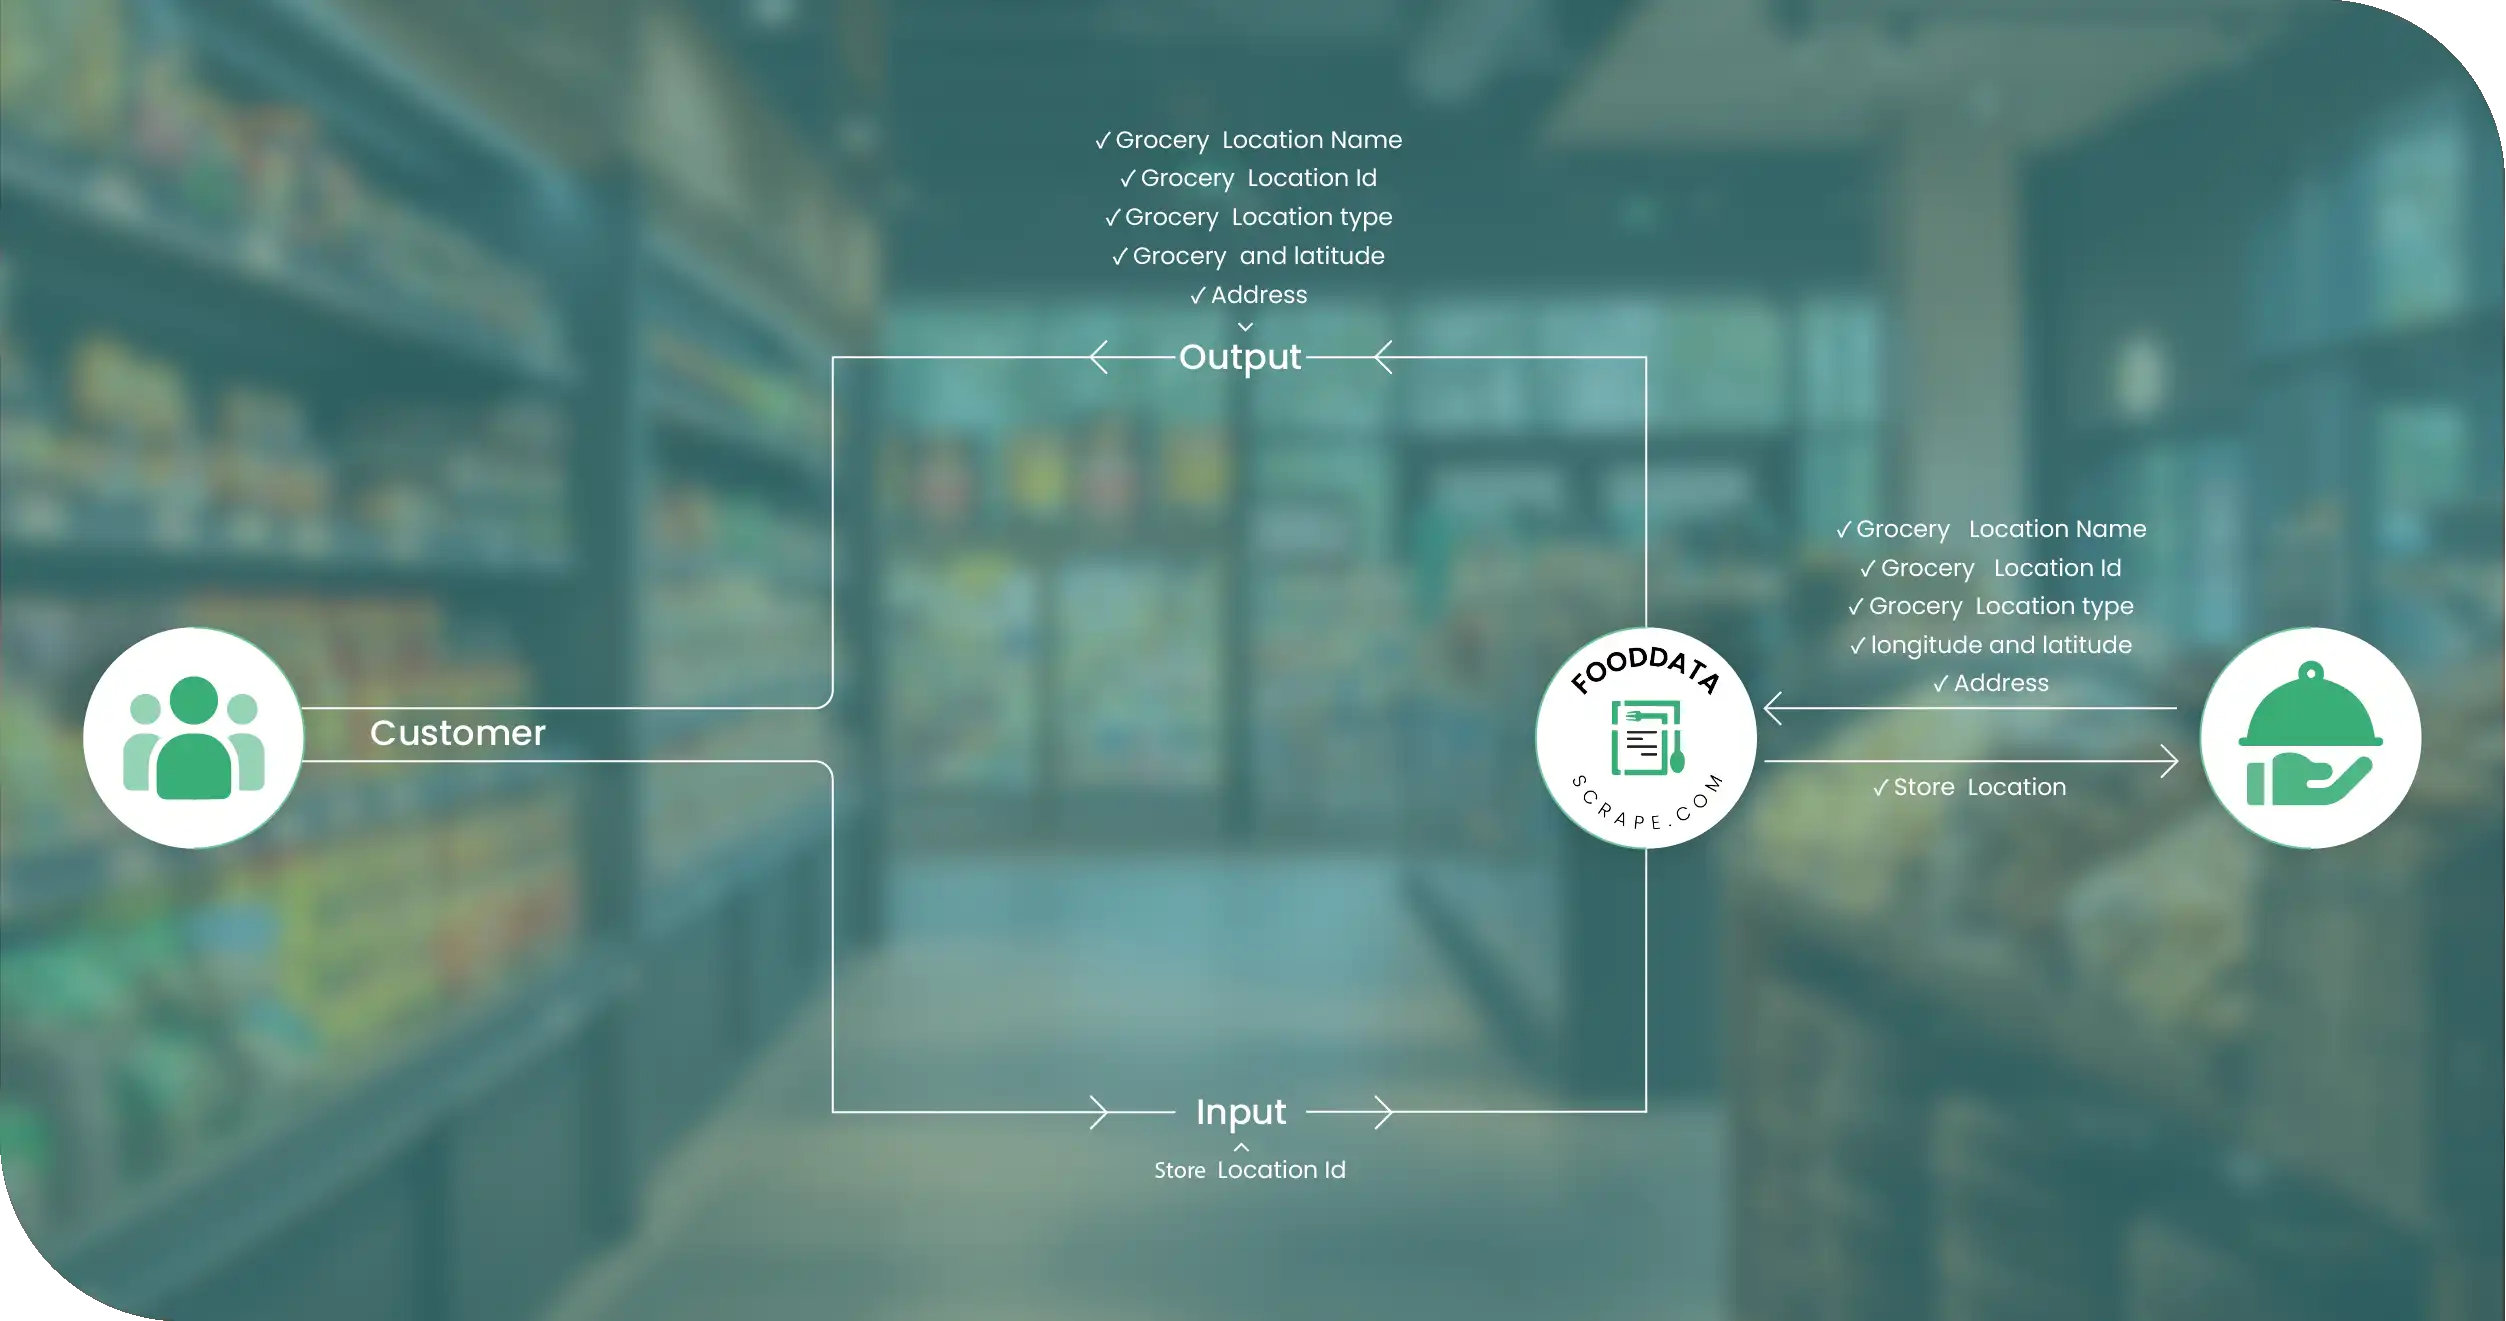
We identified relevant publicly accessible Walmart product pages and shopping interfaces, then mapped available information into predefined fields. This established a consistent extraction structure and helped align collection activities with the client's pricing, availability, and reporting requirements. -
Automated Data Extraction
We implemented automated collection workflows designed to capture relevant product attributes, displayed prices, promotional details, and availability indicators. Configurable execution schedules supported repeated observations while respecting applicable access restrictions, website terms, and technical limitations. -
Data Cleaning and Normalization
We standardized product identifiers, titles, category labels, price formats, timestamps, and location references. Cleaning procedures addressed missing values, inconsistent formatting, and duplicate observations, improving dataset usability and supporting more reliable comparisons across products and reporting periods. -
Quality Assurance and Validation
We introduced validation rules to examine required fields, record consistency, duplicate entries, and unexpected changes in extracted structures. Exception handling helped flag incomplete or inconsistent records for review, while monitoring supported the identification of extraction failures and source-layout changes. -
Dataset Integration and Reporting
We structured processed records for integration with analytical databases, spreadsheets, and dashboard environments. Historical observations enabled the client to compare available snapshots, evaluate pricing movements, and review availability patterns through repeatable reporting workflows tailored to business requirements.
Advantages of Collecting Data Using Food Data Scrape
-
Improved Retail Market Visibility
Food Data Scrape helps businesses consolidate publicly accessible retail information into structured datasets. Organized product, pricing, and availability records make it easier to examine market differences, identify changing conditions, and develop more informed retail monitoring strategies. -
Faster Competitive Price Analysis
Automated data collection reduces the need for repetitive manual price checks. Standardized observations help analysts compare selected products, evaluate promotional changes, and identify pricing differences across supported locations, allowing teams to conduct competitive research more efficiently. -
Better Inventory Trend Analysis
Repeated availability observations help businesses understand how displayed stock indicators change over time. By combining historical snapshots with product and location references, analysts can investigate potential availability patterns, prioritize products for review, and improve inventory-related reporting. -
Scalable Data Processing
Structured extraction workflows can accommodate expanding product categories, locations, and reporting requirements. Configurable schedules and standardized output formats help organizations manage larger volumes of retail information without relying entirely on manual research or inconsistent spreadsheet-based processes. -
Stronger Data-Driven Decisions
Clean, organized retail datasets provide a foundation for dashboards, forecasting experiments, category analysis, and operational reporting. Food Data Scrape helps businesses transform accessible online information into practical analytical resources that support planning, research, and ongoing market evaluation.
Client's Testimonial
"Our team needed a more systematic way to analyze Walmart product pricing and availability across selected markets. Previously, gathering information from different product pages required significant manual effort, and comparing records over time was difficult. The data scraping solution provided a more structured approach to collecting product details, displayed prices, promotional information, and availability indicators. We particularly appreciated the focus on data standardization, validation, and consistent reporting formats. These improvements helped our analysts organize retail information more efficiently and investigate market changes with greater clarity. The resulting datasets also created a stronger foundation for our internal dashboards and category research. Overall, the engagement demonstrated how automated data collection can simplify retail intelligence workflows and help our team make more informed decisions using organized, accessible market information."
—Head of Retail Analytics
Final Outcome
The project established a structured approach to collecting and organizing publicly accessible Walmart product, pricing, promotional, and availability information. By reducing dependence on repetitive manual research, the workflow created a more consistent foundation for comparing products and examining changes across selected locations and observation periods. Standardized records supported easier integration with reporting tools and analytical systems, while quality checks helped identify incomplete fields and inconsistent observations before downstream use. The client gained a framework for reviewing price movements, studying product availability indicators, and maintaining historical snapshots for retail research.
The collected data could also support AI Grocery Intelligence initiatives, including category insights, pricing trend analysis, and exploratory forecasting, subject to data quality and coverage. Actual improvements in accuracy, collection speed, and business performance would need to be established through measured project results and validated against the client's operational benchmarks.