

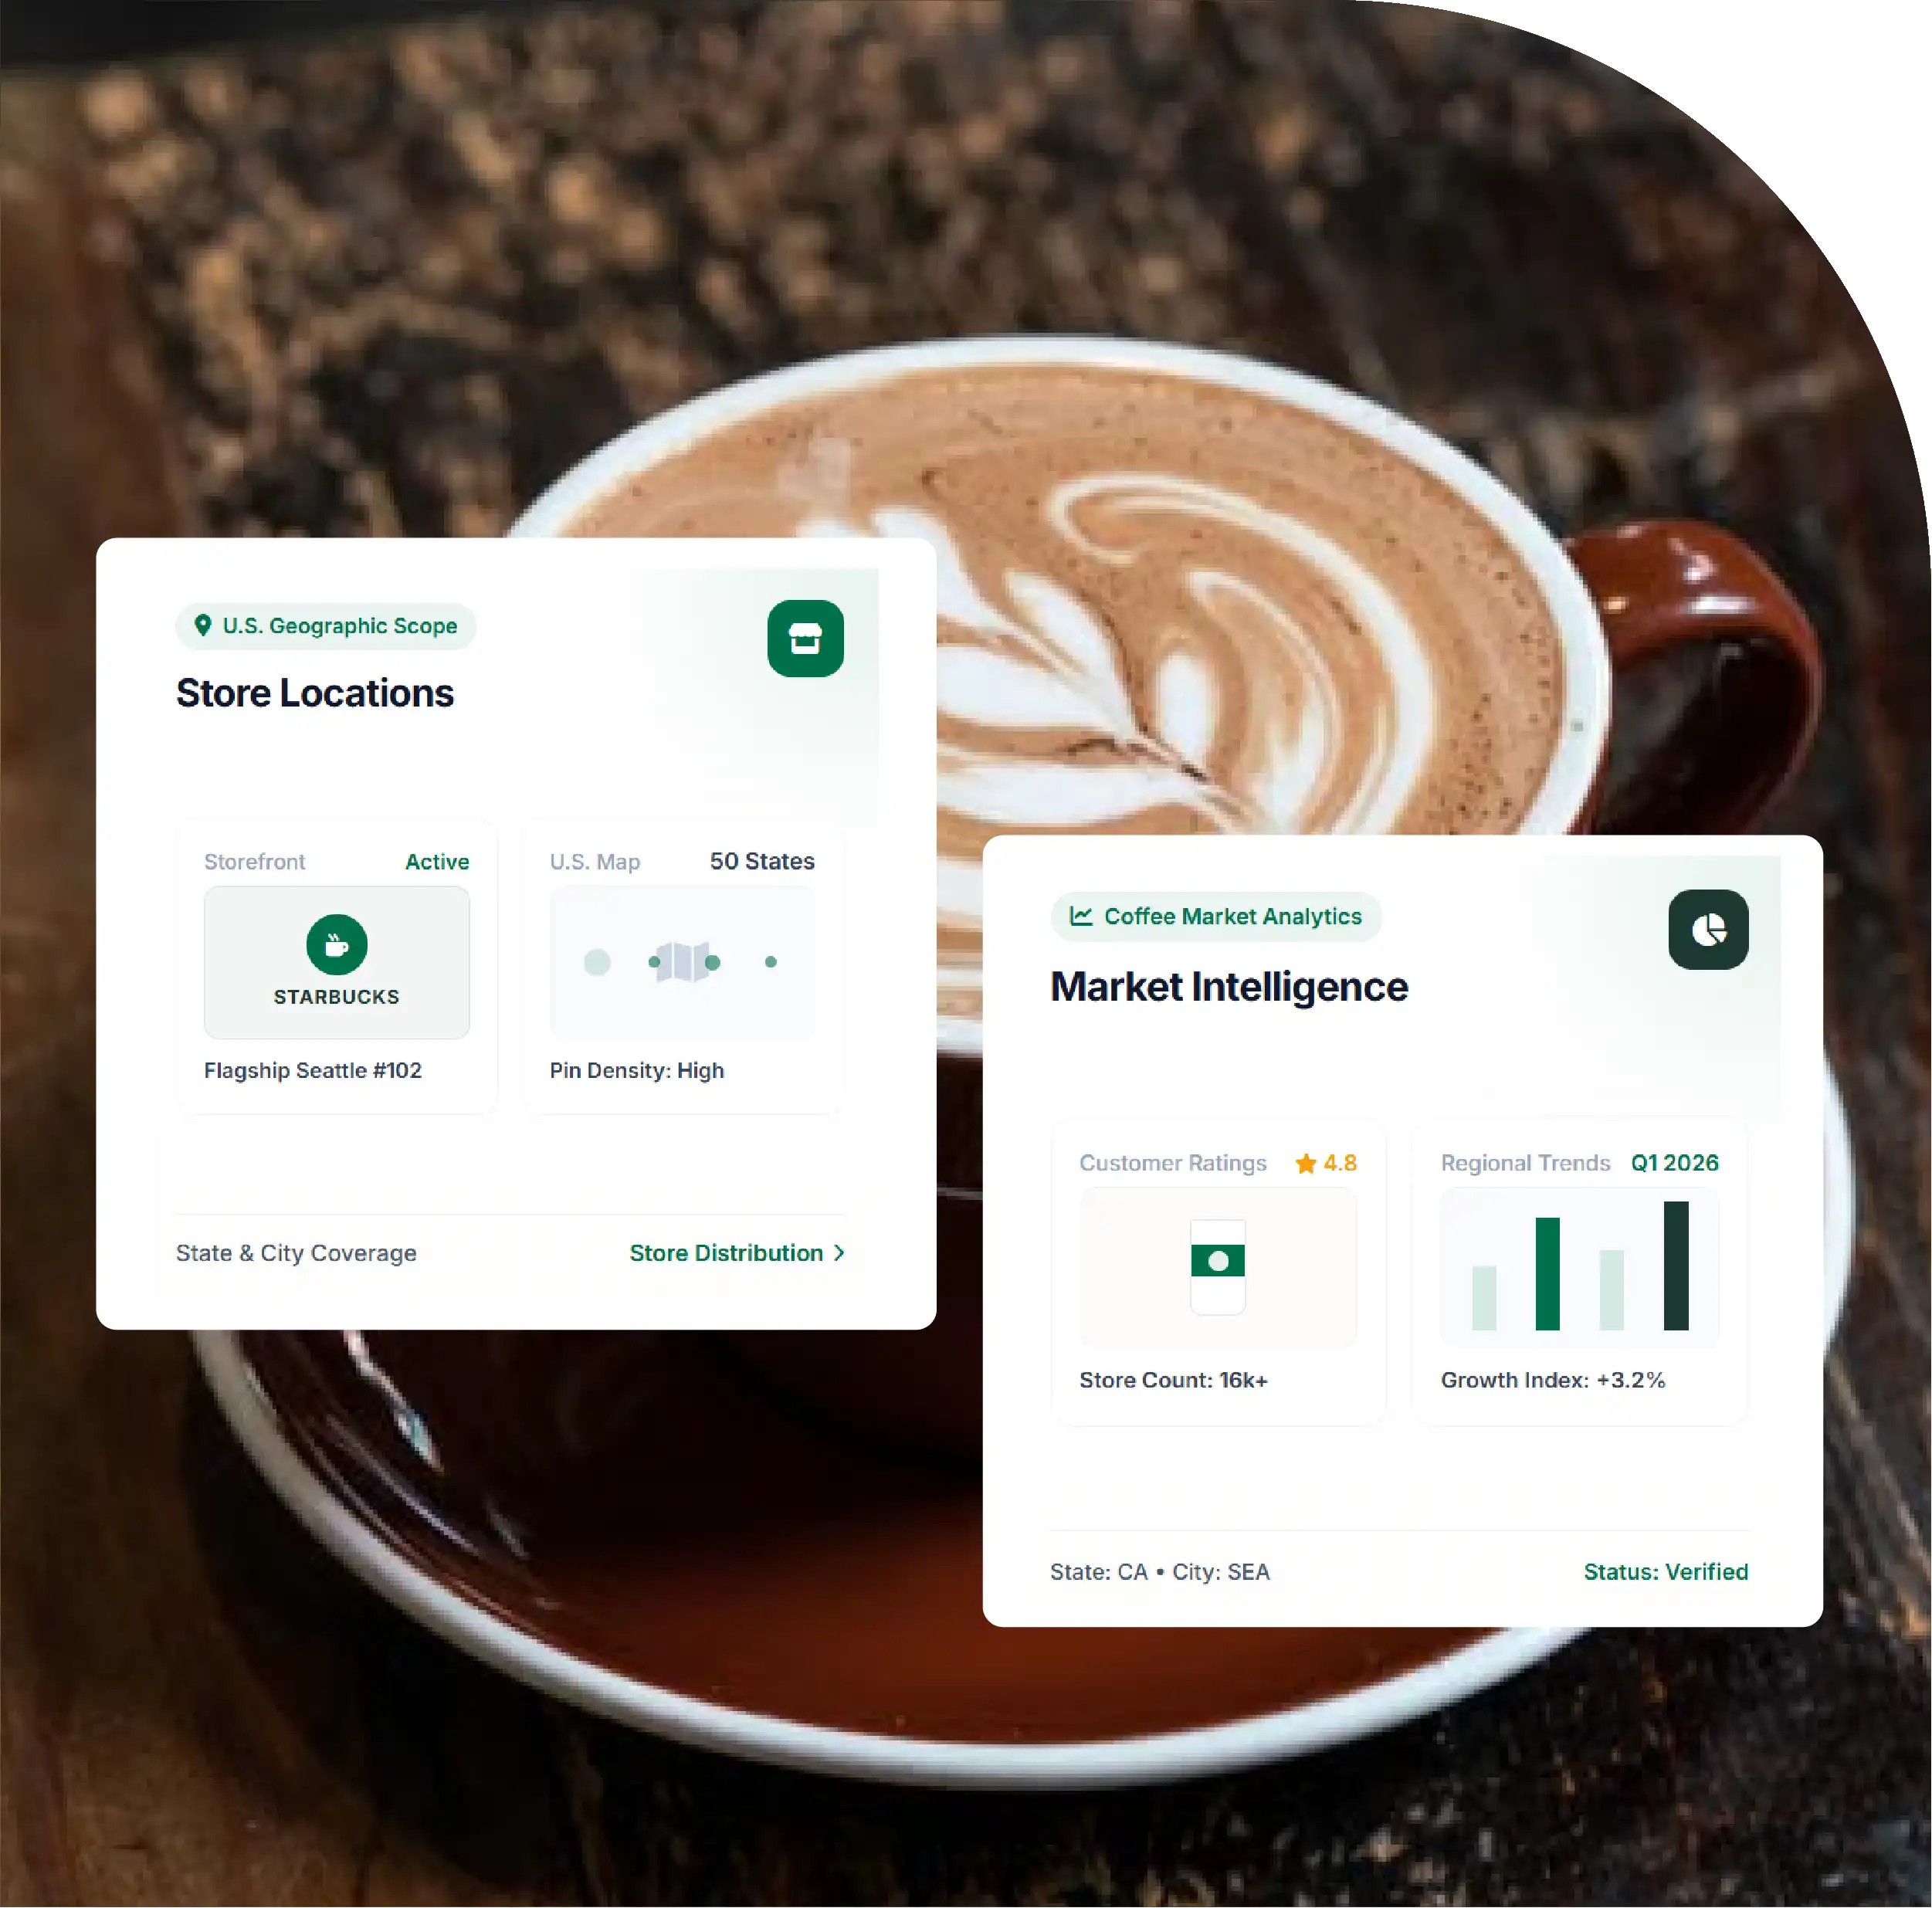
1. 16,909 Starbucks Locations: Starbucks operates 16,909 stores across 52 U.S. states and territories, providing extensive nationwide location coverage.
2. California Leads the Market: California has 3,053 Starbucks stores, representing approximately 18% of the total U.S. Starbucks network.
3. Major City Concentration: Las Vegas leads with 183 locations, followed by Chicago with 174, Houston with 159, and New York with 155.
4. Competitive Market Intelligence: Starbucks can be benchmarked against Subway, McDonald's, Dunkin, Taco Bell, and other major food-service chains using location-level datasets.
5. Rich Store-Level Data: Structured records can include store names, addresses, ZIP codes, phone numbers, latitude, longitude, ratings, and update dates for detailed market analysis.

The U.S. coffee market is highly competitive, making accurate store-level intelligence essential for brands, investors, retailers, franchise analysts, and market researchers. Web Scraping Starbucks Store Data USA -2026 provides a structured way to monitor Starbucks' nationwide footprint, geographic concentration, customer ratings, and competitive positioning.
Starbucks Store Location Data Scraping 2026 can help businesses build regularly refreshed datasets containing store names, addresses, cities, states, ZIP codes, phone numbers, coordinates, ratings, operating information, and update dates.
Scrape Starbucks US Store Data to understand where Starbucks has the strongest physical presence and how its store network compares with competing food and beverage chains. Based on the referenced August 24, 2026 dataset, Starbucks has 16,909 locations across the United States, covering 52 states and territories and 3,858 cities.
This report examines the Starbucks U.S. store network through a location-data and market-intelligence perspective, highlighting state concentration, city-level distribution, competitive comparisons, customer ratings, and the value of structured store datasets.
As of August 24, 2026, Starbucks operates 16,909 stores across the United States. California represents the largest concentration, with 3,053 locations, accounting for approximately 18% of the national store network.
Texas follows with 1,491 stores, while Florida has 941. Together, these three states represent more than 5,400 Starbucks locations, demonstrating how strongly the company's footprint is concentrated in major population centers and high-consumption markets.
The dataset spans 52 states and territories, while four U.S. territories—Guam, U.S. Virgin Islands, Northern Mariana Islands, and American Samoa—have no Starbucks locations in the referenced dataset.
For businesses, this geographic distribution is more than a store count. It provides a foundation for studying market saturation, expansion opportunities, competitor density, consumer accessibility, and regional retail performance.
Starbucks Store Location Data Extraction transforms publicly available location information into structured records that can be analyzed at national, state, city, or individual-store levels.
A comprehensive dataset can contain fields such as:
Geocoded coordinates are particularly useful because they allow analysts to visualize Starbucks density on maps and combine store records with demographic, transportation, real-estate, or competitor datasets.
The referenced dataset was last updated on August 24, 2026, providing a useful snapshot of the Starbucks network for 2026 market analysis.
California's 3,053 stores make it the dominant Starbucks market in the United States. The state has approximately one Starbucks location for every 12,891 people based on the referenced population figures.
Texas has 1,491 locations and one store for approximately every 21,268 people. Florida ranks third with 941 locations and approximately one Starbucks for every 24,934 residents.
The difference between absolute store count and population-per-store is important. A state can have many Starbucks locations while still having substantial room for additional stores depending on population density, urbanization, retail traffic, income, and competitive conditions.
| Rank | State / Territory | Starbucks Stores | Share of U.S. Network | Population | Population per Store |
|---|---|---|---|---|---|
| 1 | California | 3,053 | 18% | 39.35M | 12.89K |
| 2 | Texas | 1,491 | 9% | 31.71M | 21.27K |
| 3 | Florida | 941 | 6% | 23.46M | 24.93K |
| 4 | New York | 721 | 4% | 20.00M | 27.74K |
| 5 | Illinois | 710 | 4% | 12.72M | 17.91K |
| 6 | Washington | 647 | 4% | 8.00M | 12.37K |
| 7 | Arizona | 601 | 4% | 7.62M | 12.69K |
| 8 | Ohio | 523 | 3% | 11.90M | 22.75K |
| 9 | North Carolina | 517 | 3% | 11.20M | 21.66K |
| 10 | Virginia | 507 | 3% | 8.88M | 17.52K |
The state-level dataset reveals several interesting patterns. Washington, for example, has 647 Starbucks stores despite a population of approximately 8 million, resulting in one store for every 12,370 people. Arizona also shows a relatively high store density at approximately one location per 12,690 people.
Such metrics can be used to identify markets with comparatively high or low Starbucks penetration.
City-level analysis provides another layer of insight. Large metropolitan markets naturally support substantial numbers of coffee outlets because of population concentration, office districts, tourism, transportation hubs, universities, shopping centers, and dense commercial activity.
Las Vegas leads the referenced city rankings with 183 Starbucks locations, followed by Chicago with 174 and Houston with 159.
New York City has 155 locations, while Los Angeles has 137. San Diego and Phoenix also exceed 100 locations.
Starbucks US Market Intelligence becomes significantly more valuable when state-level information is combined with city-level data. Analysts can identify clusters, compare urban markets, and assess how Starbucks' physical presence varies across major U.S. cities.
| Rank | City | State | Starbucks Locations | Approx. Share of 16,909 Stores | Market Observation |
|---|---|---|---|---|---|
| 1 | Las Vegas | Nevada | 183 | 1.08% | High tourism and hospitality concentration |
| 2 | Chicago | Illinois | 174 | 1.03% | Dense metropolitan and commercial market |
| 3 | Houston | Texas | 159 | 0.94% | Large population and broad urban footprint |
| 4 | New York | New York | 155 | 0.92% | Major business, tourism, and retail market |
| 5 | Los Angeles | California | 137 | 0.81% | Extensive metropolitan consumer market |
| 6 | San Diego | California | 119 | 0.70% | Strong coastal and urban demand |
| 7 | Phoenix | Arizona | 118 | 0.70% | Large and expanding metropolitan market |
| 8 | Dallas | Texas | 92 | 0.54% | Major business and retail hub |
| 9 | San Antonio | Texas | 85 | 0.50% | Large population and growing metro area |
| 10 | Miami | Florida | 82 | 0.49% | Tourism, hospitality, and high-density retail market |
City-level records can also support proximity analysis. For example, businesses can calculate the distance between Starbucks stores and competing coffee chains, grocery stores, shopping centers, offices, hotels, universities, or transportation locations.
Competitive benchmarking shows how Starbucks compares with major U.S. food-service brands.
The referenced data lists Subway with 20,122 locations, making it larger by total location count than Starbucks. McDonald's has 13,882 locations, while Hunt Brothers Pizza has 11,541. Dunkin has 10,135 and Taco Bell has 8,248.
Interestingly, Starbucks has a broader geographic presence than some competitors despite having fewer total locations. The dataset shows Starbucks across 52 states and territories, while some competing chains have narrower geographic coverage.
This demonstrates why competitive analysis should not rely solely on location totals. Geographic reach, city penetration, store density, and population coverage can provide additional insights.
Store-location datasets can also be enriched with customer sentiment indicators.
Across the referenced Starbucks locations, the average rating is 4.03 based on more than 4.73 million customer reviews. The dataset reports a high customer satisfaction rating of 78.17% and poor customer feedback of 13.13%.
Individual store ratings can vary significantly.
For example, a Seattle Starbucks at 1124 Pike St is listed with a 4.6 rating from 13,913 reviews, while a Plano, Texas location at 7600 Windrose Ave has a 4.6 rating from 1,023 reviews.
On the lower end, certain locations have ratings below 3.0. A New York location at 45 West 4th Street is listed at 2.6, while a location in Howe, Indiana is listed at 2.5.
For analysts, this creates opportunities to investigate the relationship between store location, review volume, ratings, surrounding competition, and market characteristics.
Extract Starbucks Retail Store Location Data into Excel, CSV, JSON, or other structured formats to create reusable datasets for business intelligence applications.
A standardized Starbucks database can support:
For example, an analyst could combine Starbucks coordinates with population data to calculate stores per 100,000 residents. Another organization could compare Starbucks locations with Dunkin, McDonald's, or other coffee and food-service brands to identify underserved markets.
Manual collection becomes difficult when thousands of locations must be reviewed repeatedly. Store addresses can change, businesses can open or close, contact details can be updated, and ratings can fluctuate.
Automated Food Data Scraping in the USA enables businesses to establish repeatable workflows for collecting and refreshing large volumes of location information.
A structured scraping process can collect records, normalize addresses, validate geographic fields, remove duplicates, and prepare the resulting information for analytical systems.
The greatest value comes from creating a historical dataset rather than performing a one-time extraction. Comparing snapshots over time can reveal geographic expansion, market consolidation, store closures, and changing competitive intensity.
Starbucks location intelligence can serve multiple industries.
Retail and real estate companies can use store density to evaluate potential commercial locations.
Investment researchers can monitor Starbucks' geographic footprint and compare market exposure with competitors.
Food and beverage companies can benchmark their own physical presence against Starbucks and other major chains.
Market research firms can incorporate Starbucks records into broader U.S. restaurant and beverage datasets.
Location intelligence platforms can combine Starbucks data with demographic, mobility, commercial, and competitor information to produce market-level scoring models.
The dataset can also support interactive dashboards where users filter stores by state, city, ZIP code, rating, or geographic coordinates.
A scalable workflow typically begins with source discovery and automated extraction. The collected records are then standardized into consistent fields.
Address normalization is particularly important because the same location may appear with variations in street formatting, abbreviations, or business naming.
Geocoding and validation provide another quality layer. Latitude and longitude enable accurate mapping and proximity calculations, while duplicate detection helps maintain a clean database.
Finally, scheduled refreshes can create a continuously updated Starbucks intelligence platform instead of a static spreadsheet.
The referenced August 24, 2026 data shows 16,909 Starbucks stores across the United States, with California leading at 3,053 locations, followed by Texas at 1,491 and Florida at 941. At the city level, Las Vegas, Chicago, Houston, New York, and Los Angeles represent some of the largest Starbucks concentrations.
Data Scraping for Starbucks in the U.S can transform these individual store records into actionable intelligence for market sizing, competitor benchmarking, retail expansion, location planning, and geographic analysis.
Coffee & Beverage Data Scraping can further expand this intelligence by combining Starbucks information with competing coffee chains, restaurants, grocery retailers, delivery platforms, and beverage businesses.
A broader Liquor & Beverage Dataset can similarly help organizations analyze beverage-market distribution across multiple categories, creating a more comprehensive view of the U.S. food and beverage ecosystem.
Ultimately, a regularly refreshed Starbucks store dataset is not simply a directory of locations. It is a foundation for location intelligence, competitive research, market analysis, and data-driven retail decision-making in 2026.
If you are seeking for a reliable data scraping services, Food Data Scrape is at your service. We hold prominence in AI Restaurant Intelligence and Mobile Restaurant App Scraping with impeccable data analysis for strategic decision-making. Unlock richer grocery intelligence with Real Time Price Monitoring to understand consumer preferences, product innovation, and emerging market opportunities.



