
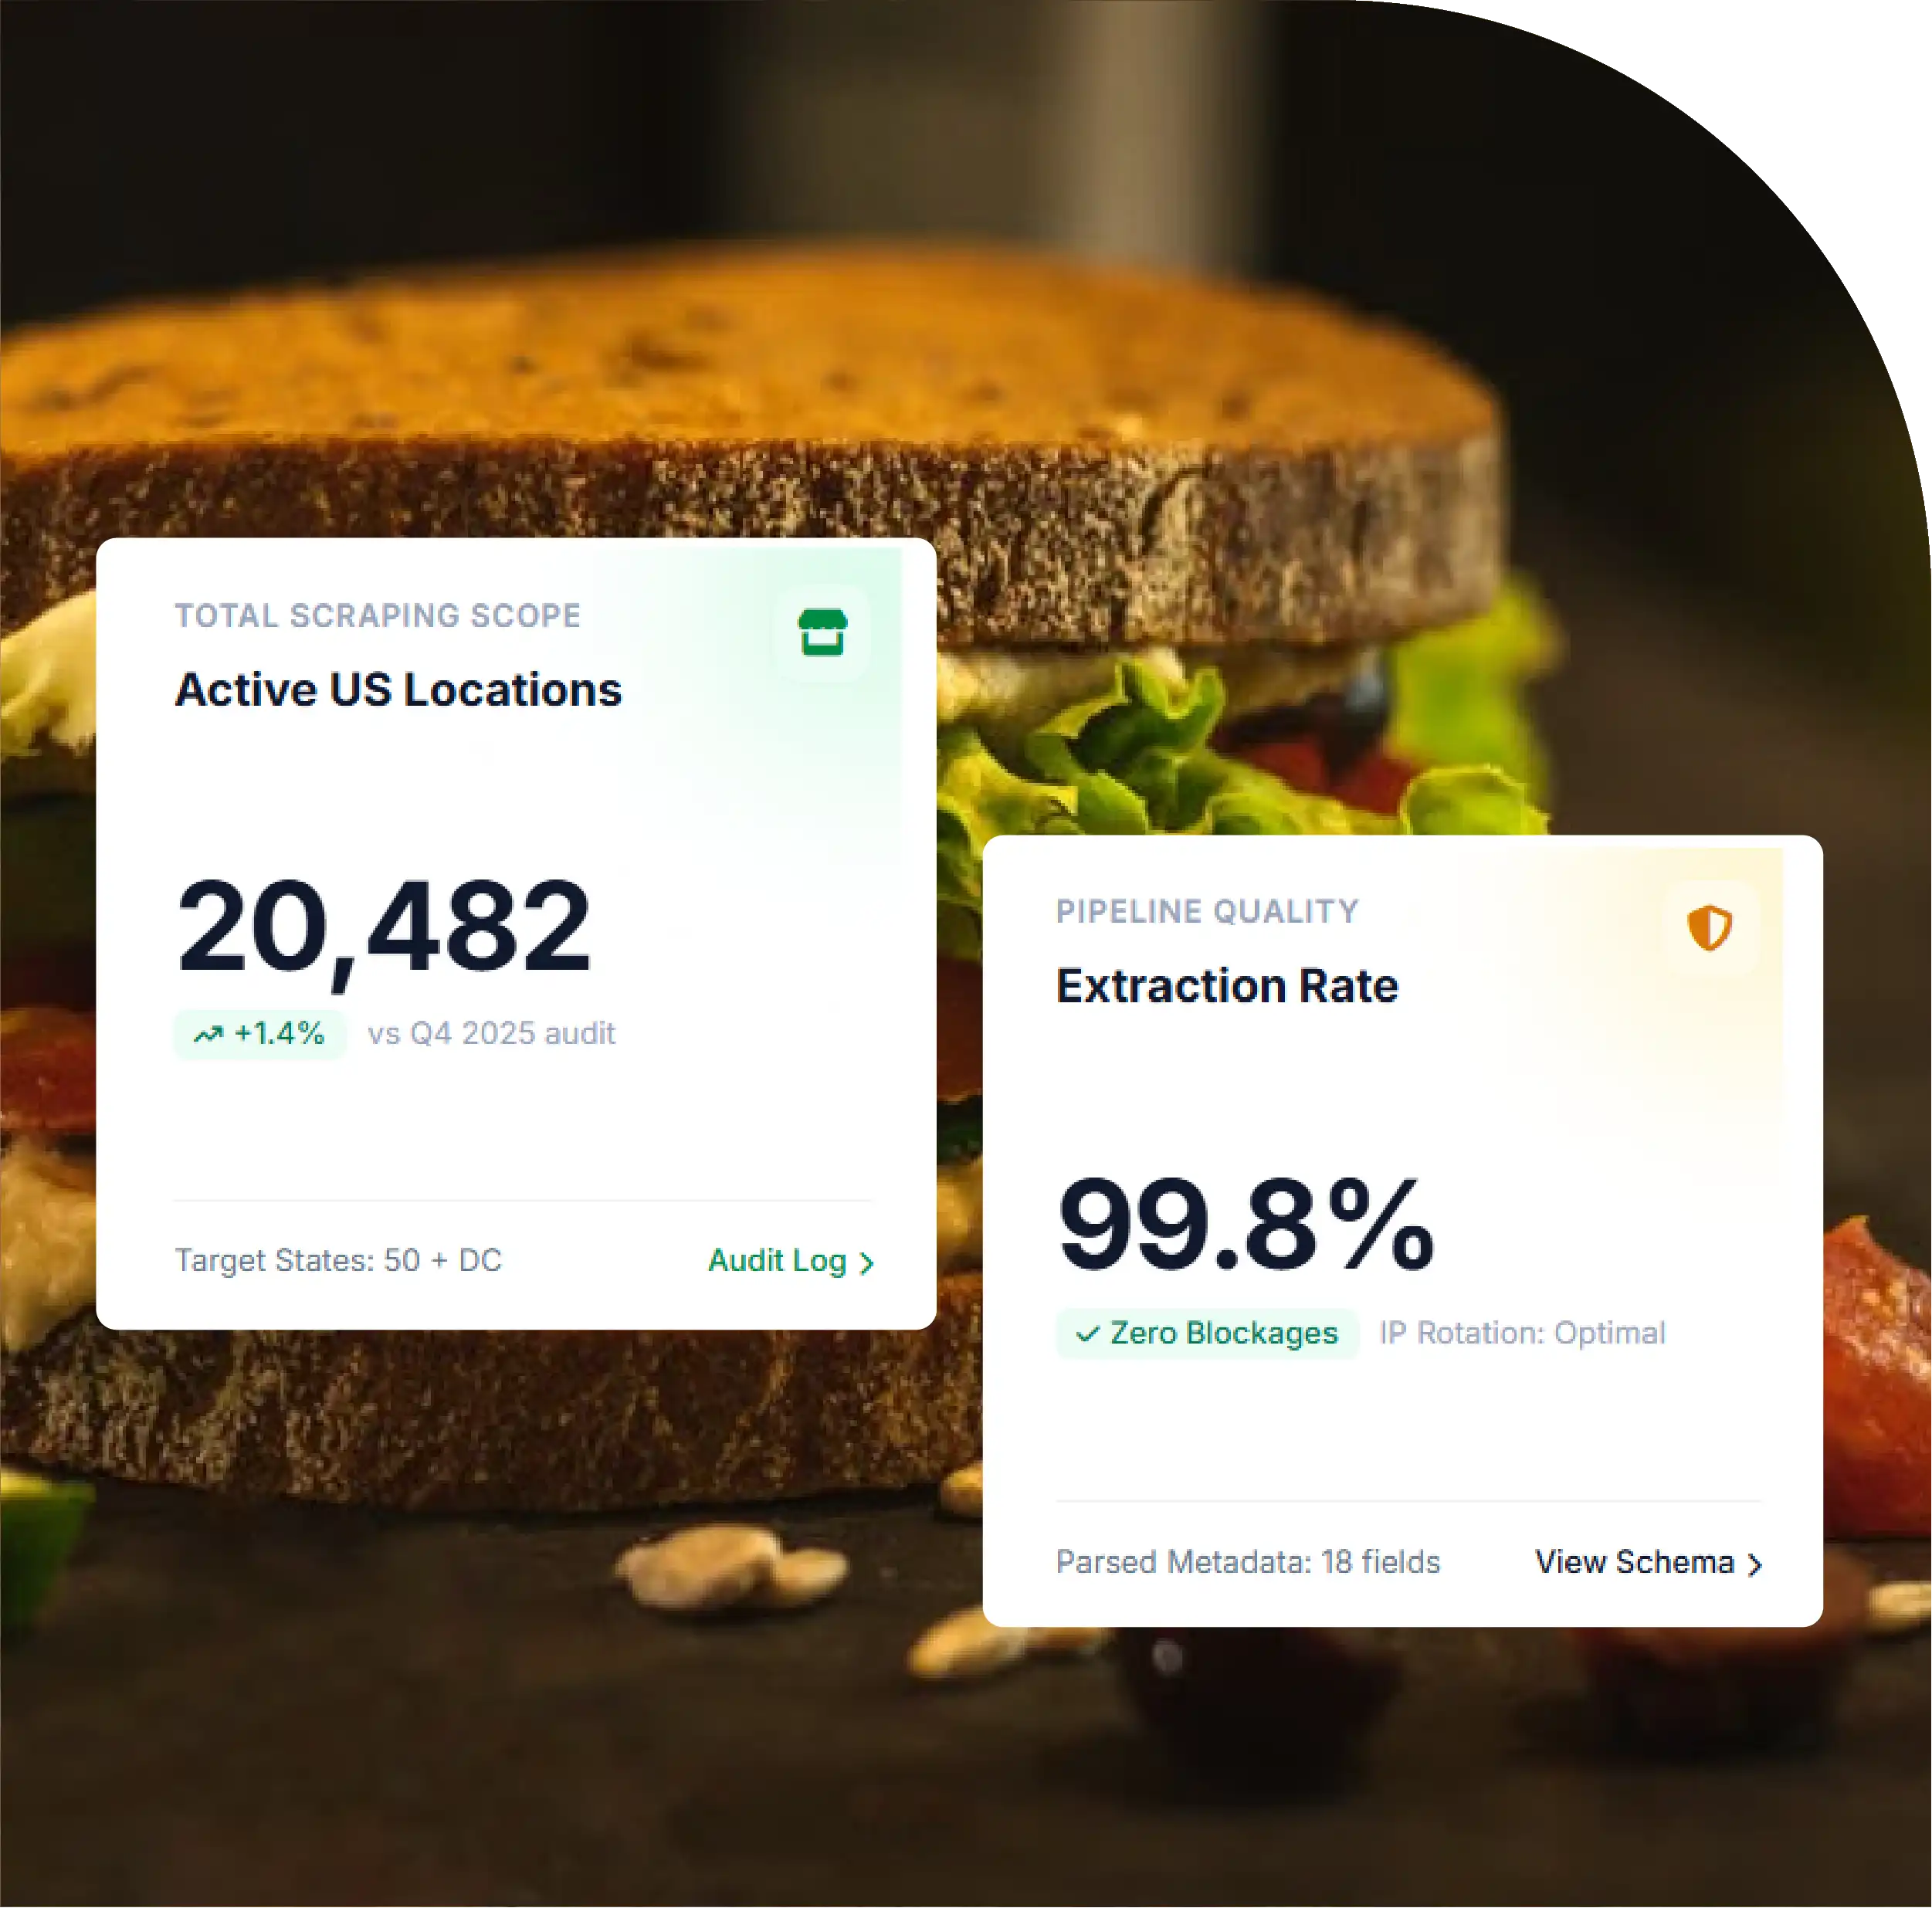
Store Scale: Subway operates 20,122 U.S. locations across 51 territories.
State Leader: California leads nationally with 1,953 Subway locations.
City Leader: Houston records the highest city total, reaching 201.
Market Coverage: Subway locations span 6,594 cities across America.
Competitive Position: Subway exceeds listed competitors in total locations.

The U.S. quick-service restaurant market is highly competitive, geographically diverse, and constantly changing. For brands, franchise operators, investors, location planners, delivery platforms, and market researchers, understanding where restaurant outlets operate can reveal important patterns in market penetration, consumer accessibility, and competitive intensity.
Web Scraping Subway stores Data USA -2026 provides a structured way to monitor Subway's nationwide footprint, including store locations, addresses, cities, states, phone numbers, geographic coordinates, and other location-level attributes. Based on the supplied August 31, 2026 dataset, Subway has 20,122 stores across 51 states and territories and 6,594 cities in the United States.
Subway Store Locations Data Scraping In USA can help transform scattered restaurant-location information into a standardized dataset suitable for geographic analysis, competitor benchmarking, territory planning, and restaurant intelligence.
Scrape Subway Store Locations In USA to further support businesses that need regularly refreshed location data rather than one-time snapshots. With accurate and structured records, analysts can identify high-density markets, compare state-level penetration, and examine Subway's presence against competing restaurant chains.
The August 31, 2026 snapshot indicates 20,122 Subway locations across the United States. The network spans 51 states and territories and reaches 6,594 cities, demonstrating the brand's extensive geographic distribution.
California leads the country with 1,953 Subway stores, representing approximately 10% of the total U.S. network. Texas follows with 1,825 locations, while Florida has 1,146 stores.
Together, these three states account for 4,924 locations, representing roughly 24.5% of all Subway stores covered in the dataset. This concentration makes these markets particularly important for competitive analysis, franchise planning, and location intelligence.
| State | Subway Stores | Share of U.S. Network | Population | Population per Store |
|---|---|---|---|---|
| California | 1,953 | 10% | 39.35M | 20.15K |
| Texas | 1,825 | 9% | 31.71M | 17.38K |
| Florida | 1,146 | 6% | 23.46M | 20.47K |
| Ohio | 926 | 5% | 11.90M | 12.85K |
| Illinois | 891 | 4% | 12.72M | 14.28K |
| New York | 738 | 4% | 20.00M | 27.10K |
| Michigan | 727 | 4% | 10.13M | 13.93K |
| Georgia | 692 | 3% | 11.30M | 16.33K |
| North Carolina | 655 | 3% | 11.20M | 17.10K |
| Pennsylvania | 613 | 3% | 13.06M | 21.30K |
This distribution highlights an important characteristic of restaurant networks: the largest number of outlets does not necessarily correspond to the lowest population-per-store ratio.
Store counts become more meaningful when combined with population information. Ohio, for example, has 926 Subway stores and approximately 11.90 million residents, resulting in about one Subway location for every 12,850 people.
Michigan records 727 stores and approximately 10.13 million residents, producing a ratio of roughly 13,930 people per store. Georgia has 692 stores and a population of 11.30 million, resulting in approximately 16,330 people per store.
By contrast, New York has 738 locations but a population-per-store ratio of approximately 27,100. This illustrates why restaurant intelligence should examine both absolute location counts and market density.
A location dataset can therefore help analysts answer questions such as:
The city-level data provides another layer of market intelligence. Houston leads the supplied ranking with 201 Subway locations, followed by Chicago with 183 and San Antonio with 115.
| City | State | Subway Locations |
|---|---|---|
| Houston | Texas | 201 |
| Chicago | Illinois | 183 |
| San Antonio | Texas | 115 |
| Los Angeles | California | 102 |
| Las Vegas | Nevada | 90 |
| Miami | Florida | 87 |
| Indianapolis | Indiana | 71 |
| Phoenix | Arizona | 67 |
| Baltimore | Maryland | 64 |
| New York | New York | 64 |
Houston and San Antonio together contribute 316 locations in the supplied top-city dataset, showing the importance of Texas to Subway's national footprint.
City-level information is especially valuable for businesses conducting territory analysis. Rather than treating an entire state as one market, analysts can identify individual metropolitan areas with unusually high restaurant concentrations.
A well-structured restaurant-location scraping project can capture much more than a store name. The supplied sample demonstrates the breadth of fields that can be incorporated into a location database.
Typical fields include:
| Data Field | Example Application |
|---|---|
| Restaurant Name | Brand and outlet identification |
| Street Address | Location mapping |
| City | Market segmentation |
| State | Regional analysis |
| ZIP Code | Local demographic analysis |
| Phone Number | Business contact intelligence |
| Latitude | Geographic visualization |
| Longitude | Distance and proximity analysis |
| Full Address | Standardized location records |
| Country | Market classification |
| Last Updated Date | Data freshness monitoring |
| Opening Hours | Operational analysis |
The presence of latitude and longitude is particularly valuable because it enables geospatial analysis, proximity calculations, territory mapping, and visualization of restaurant clusters.
Restaurant location intelligence becomes more powerful when Subway is evaluated alongside competitors.
According to the supplied comparison, Subway has 20,122 locations, compared with 16,909 Starbucks locations, 13,882 McDonald's locations, 11,541 Hunt Brothers Pizza locations, 10,135 Dunkin locations, and 8,248 Taco Bell locations.
| Brand | Locations | States | Cities |
|---|---|---|---|
| Subway | 20,122 | 51 | 6,594 |
| Starbucks | 16,909 | 52 | 3,858 |
| McDonald's | 13,882 | 54 | 5,041 |
| Hunt Brothers Pizza | 11,541 | 36 | 4,808 |
| Dunkin | 10,135 | 44 | 3,452 |
| Taco Bell | 8,248 | 51 | 3,655 |
The comparison indicates that Subway has a broader location footprint than each of the listed competitors in terms of total stores. However, the number of states and cities covered varies considerably between brands.
This is where Subway US Restaurant Data Scraping becomes strategically useful. A standardized competitor dataset allows analysts to compare location density, geographic overlap, market penetration, and expansion patterns.
Raw restaurant records become significantly more valuable when they are transformed into analytical indicators.
For example, businesses can calculate:
This makes Subway US Market Data Scraping relevant for franchise consultants, restaurant investors, food delivery companies, real-estate analysts, and competitive intelligence teams.
A structured restaurant-location dataset can support several commercial use cases.
Franchise Expansion: Potential franchisees can evaluate existing store concentrations and identify markets where demand and competitive conditions may justify additional locations.
Real Estate Analysis: Commercial real-estate teams can combine Subway locations with demographic, traffic, income, and competitor data to evaluate restaurant-oriented properties.
Competitive Benchmarking: Restaurant brands can compare their geographic footprint with Subway and other QSR chains to understand market coverage.
Delivery Market Analysis: Food delivery companies can identify restaurant clusters and estimate potential serviceable markets around high-density Subway territories.
Investment Research: Investors can evaluate restaurant network scale, geographic concentration, and market exposure using standardized location datasets.
Local Market Planning: Marketing teams can segment campaigns by state, city, ZIP code, or geographic radius around restaurant locations.
A one-time dataset provides a snapshot, but recurring collection can create a much stronger intelligence system.
A continuously maintained Subway Store Intelligence Data repository can track changes in store addresses, operating information, geographic coverage, and market presence over time.
For example, analysts could maintain monthly or quarterly snapshots and compare:
Historical comparisons can help identify whether Subway is expanding into new markets, consolidating particular territories, or maintaining stable coverage.
The U.S. restaurant sector generates large volumes of location, menu, pricing, availability, review, and delivery information. Collecting this information manually is time-consuming and difficult to maintain at scale.
Food Data Scraping in the USA enables businesses to organize restaurant information into machine-readable datasets that can be connected with business intelligence platforms, dashboards, GIS tools, and analytics systems.
The resulting data can support restaurant benchmarking, market research, competitive intelligence, location planning, and automated reporting.
A standardized Subway Store Dataset can also be integrated with demographic datasets, competitor databases, real-estate information, delivery coverage, and consumer-demand indicators to produce more comprehensive market models.
The supplied 2026 dataset highlights several important findings:
The 2026 Subway location dataset demonstrates how restaurant location information can become a powerful source of market intelligence when organized, standardized, and analyzed systematically. Store counts by state and city reveal geographic concentration, while population-per-store ratios provide additional context for evaluating market penetration.
Modern restaurant intelligence goes beyond simply counting outlets. Businesses can combine location data with menus, pricing, reviews, delivery availability, demographics, competitors, and geographic information to create comprehensive market models.
A recurring Subway Food Delivery Scraping API can further support applications that require structured restaurant and delivery information in real time or at regular intervals.
AI Restaurant Intelligence can then transform large-scale restaurant datasets into automated insights, helping businesses identify trends, opportunities, competitive gaps, and changing market conditions.
Finally, Food Data Scraping Services for Restaurants can help restaurant brands, franchise operators, investors, delivery platforms, and market researchers build scalable datasets for location intelligence, competitive benchmarking, expansion planning, and ongoing U.S. restaurant market analysis.
If you are seeking for a reliable data scraping services, Food Data Scrape is at your service. We hold prominence in Food Data Aggregator and Mobile Restaurant App Scraping with impeccable data analysis for strategic decision-making.