Introduction
Grocery retailers across the United States compete aggressively through weekly promotions, seasonal discounts, limited-time offers, loyalty rewards, and private-label pricing strategies. Supermarket chains publish weekly circulars and digital flyers to inform customers about discounted products, attract store traffic, and increase basket sizes. For grocery retailers, consumer brands, market researchers, and pricing analysts, these promotional materials provide valuable insights into changing market conditions and competitor behavior.
Weekly ad circular data scraping enables businesses to collect promotional information from digital flyers, weekly advertisements, retailer websites, and online grocery platforms systematically. Instead of manually reviewing hundreds of advertisements, companies can gather structured information about product names, regular prices, promotional prices, discount percentages, offer validity, product sizes, and participating locations.
Businesses can Scrape US Grocery Circular Promotion Data to understand how competing retailers position their offers across regions and product categories. Similarly, Weekly Grocery Circular Data Scraping helps identify recurring discount patterns, seasonal campaigns, and differences in promotional strategies between national supermarket chains and regional grocery operators.
By converting scattered promotional information into organized datasets, businesses can compare offers, identify pricing opportunities, optimize marketing campaigns, and develop stronger competitive strategies. This approach transforms weekly grocery advertisements from simple customer-facing promotions into actionable commercial intelligence.
Weekly grocery circulars are promotional publications that retailers update regularly, typically featuring selected products at discounted prices for a defined period. These circulars may appear as downloadable PDFs, interactive digital flyers, website listings, mobile app promotions, or location-specific advertisements.
Scraping these materials involves collecting relevant information and converting it into structured, machine-readable records. Depending on the retailer and source format, the process may involve extracting text, interpreting product images, identifying prices, normalizing product information, and associating promotions with the correct stores and dates.
For example, a grocery circular might advertise a 12-ounce cereal box for $2.99 instead of its usual $4.49. A structured record could capture the product, brand, package size, regular price, promotional price, discount percentage, retailer, location, and expiration date.
When these records are collected consistently across multiple grocery chains, businesses can build a comprehensive view of promotional activity across the US grocery market.
Why Tracking Sale Prices Across US Grocery Chains Matters
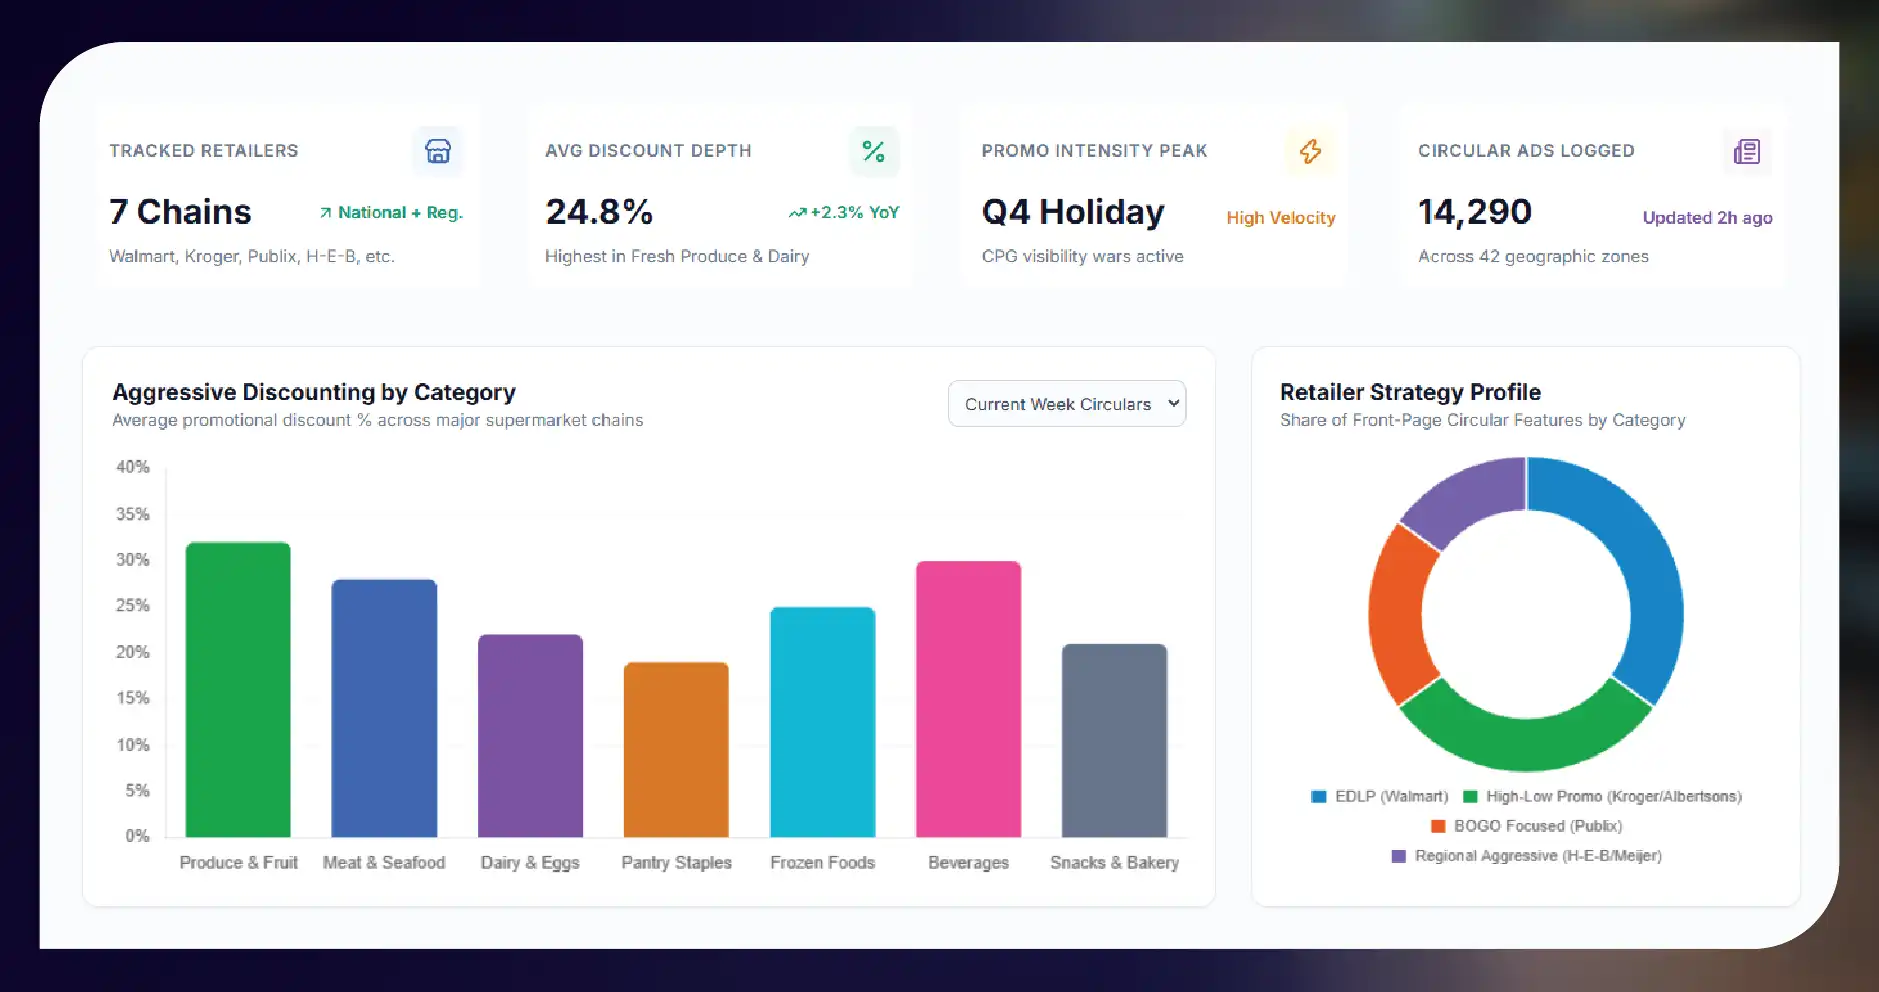
The American grocery industry includes national supermarket operators, regional grocery chains, warehouse clubs, discount grocers, and specialty food retailers. Each business uses different promotional strategies depending on its customer base, regional competition, supply arrangements, and merchandising priorities.
Retailers such as Walmart, Kroger, Albertsons, Publix, Safeway, Meijer, and H-E-B may promote similar products differently across locations and shopping periods. Their advertisements can reveal which categories receive aggressive discounts, how brands compete for visibility, and when promotional intensity increases.
Tracking these differences offers several business advantages.
First, grocery retailers can benchmark their promotional prices against competitors and identify products where their offers are less attractive. Second, consumer packaged goods manufacturers can evaluate how retailers promote their brands and whether advertised discounts vary significantly by region. Third, market researchers can examine promotional cycles to understand how price competition changes throughout the year.
Circular analysis also supports assortment planning, category management, and campaign evaluation. Instead of relying on isolated observations, businesses can compare historical records and identify recurring trends that influence commercial decisions.
Key Data Points Extracted From Grocery Circulars
Effective promotional analysis depends on collecting more than product prices. A comprehensive dataset should capture the context surrounding each offer so that comparisons remain meaningful.
Essential promotional attributes
- Product information: Product name, brand, category, flavor, variant, package size, and barcode when available.
- Pricing information: Regular price, promotional price, unit price, discount percentage, and multi-buy requirements.
- Retailer information: Grocery chain, store identifier, city, state, ZIP code, and applicable market.
- Promotion details: Offer description, loyalty membership requirements, coupon conditions, and purchase limits.
- Time information: Circular publication date, promotion start date, expiration date, and collection timestamp.
- Source information: Original webpage, flyer URL, document reference, and extraction status.
Collecting these attributes allows businesses to distinguish between a standard discount, a member-exclusive offer, and a conditional promotion such as buying three products to receive a reduced price.
These distinctions are important because two offers that appear similar may have different eligibility requirements or effective costs.
How Grocery Circular Scraping Works
A structured extraction workflow makes promotional data easier to maintain, validate, and analyze over time.
1. Identify relevant grocery sources
The process begins by identifying official retailer websites, digital circulars, weekly advertisements, and publicly accessible promotional pages. Businesses select grocery chains, product categories, and geographic markets relevant to their objectives.
Location-specific sources deserve particular attention because the same retailer may publish different promotions for stores operating in different states or metropolitan areas.
2. Collect circular and flyer information
The extraction system retrieves accessible promotional content from the selected sources. Depending on the website, information may be available in HTML, embedded data, PDFs, or image-based flyers.
Supermarket Flyer Data Extraction helps organize these different formats into consistent records. Optical character recognition and image-processing techniques may support the extraction of product descriptions and prices when circulars contain text embedded in images.
3. Standardize products and prices
Retailers frequently describe similar products differently. One circular might list a product by its brand and package size, while another uses a shortened name or promotional description.
Data normalization helps match equivalent products, standardize units, and calculate comparable unit prices. For example, comparing two different package sizes using price per ounce can reveal which offer provides better value.
4. Validate promotional details
Automated checks can identify missing prices, inconsistent dates, duplicate listings, unexpected discount percentages, and incorrectly parsed product sizes.
Validation is especially important for multi-buy offers and loyalty discounts, where the advertised price may depend on specific purchasing conditions.
5. Store and analyze the results
After validation, records can be delivered through CSV files, Excel spreadsheets, JSON feeds, databases, or business intelligence systems. Historical storage enables analysts to compare current promotions against previous weeks and identify meaningful pricing changes.
Comparing Promotional Strategies Across Leading Grocery Chains
A multi-retailer dataset helps businesses examine differences in pricing tactics, promotional frequency, and product-category emphasis.
| Grocery chain | Promotional signals to track | Potential business application |
|---|---|---|
| Walmart | Everyday prices, rollback offers, advertised discounts | Competitive price benchmarking |
| Kroger | Weekly specials, digital coupons, loyalty offers | Promotion effectiveness analysis |
| Albertsons | Weekly deals, member pricing, category discounts | Regional campaign comparisons |
| Publix | BOGO offers, weekly specials, featured products | Multi-buy promotion analysis |
| Safeway | Club prices, digital discounts, weekly offers | Loyalty promotion benchmarking |
| Meijer | Weekly advertisements, category-specific discounts | Regional assortment comparisons |
| H-E-B | Weekly specials, private-label offers, local promotions | Regional competitive intelligence |
| Aldi | Special buys, private-label offers, rotating promotions | Discount retail benchmarking |
These are suggested monitoring categories, not verified current offers. Actual promotional formats, availability, and eligibility vary by retailer, store, and week.
A structured comparison helps analysts determine whether retailers compete primarily through lower shelf prices, temporary discounts, loyalty incentives, or larger-value multi-buy promotions.
For instance, a manufacturer could evaluate how frequently its products appear in advertised promotions across different chains. A grocery retailer could investigate whether competing stores repeatedly discount essential categories such as dairy, fresh produce, packaged snacks, or beverages.
Measuring Discounts and Understanding Promotional Value
A promotional price becomes more useful when analysts can compare it against a consistent reference price.
The basic discount calculation is:
Discount %=Regular Price−Sale PriceRegular Price×100\text{Discount \%} = \frac{\text{Regular Price}-\text{Sale Price}} {\text{Regular Price}}\times100Discount %=Regular PriceRegular Price−Sale Price×100
For example, if a product's reference price is $5.00 and its advertised sale price is $3.50, the discount is 30%.
However, reference prices must be interpreted carefully. A regular price displayed in a circular may not represent the product's historical selling price. Businesses should retain the source price, applicable conditions, and observation dates rather than assuming every advertised discount represents an equivalent saving.
US Grocery Sale Price Monitoring enables analysts to compare advertised prices over time, identify recurring discounts, and investigate how promotional depth differs between retailers.
Unit-price analysis adds another layer of insight. Comparing price per ounce, pound, liter, or individual item makes it easier to assess products with different package sizes.
For conditional offers, the system should also calculate the effective price only when the required purchase quantity or membership conditions are satisfied.
Turning Promotional Records Into Grocery Pricing Intelligence
A well-maintained dataset supports more advanced analytical applications beyond basic price comparisons.
Grocery Pricing Intelligence Data can help retailers understand the competitive environment, recognize pricing patterns, and identify categories where their offers may need adjustment.
Common analytical applications include:
- Competitor benchmarking: Compare equivalent products across chains and geographic markets.
- Promotional frequency analysis: Identify how often products or brands appear in weekly advertisements.
- Discount depth analysis: Measure advertised discounts by retailer, product category, and season.
- Regional price intelligence: Examine differences between metropolitan areas, states, and store clusters.
- Brand performance research: Evaluate promotional visibility and price positioning across retailers.
- Category planning: Identify categories experiencing frequent discounting or intense promotional competition.
- Campaign evaluation: Compare promotional schedules and advertised prices before, during, and after campaigns.
Businesses can also use historical information to distinguish recurring seasonal promotions from unusual price changes. For example, a surge in advertised discounts around major holidays may reflect planned seasonal merchandising rather than a permanent reduction in product prices.
Using AI and Automation to Improve Grocery Promotion Analysis
Artificial intelligence can strengthen the interpretation of large promotional datasets, especially when information comes from different layouts and formats.
Machine learning and document-processing models can help identify product names, classify grocery categories, interpret promotional descriptions, and flag potentially incorrect price records. Entity-matching techniques can connect different descriptions of the same product, while anomaly detection can highlight unexpected price movements for review.
Extract Grocery Sale Price Data workflows to incorporate these capabilities to reduce repetitive processing and improve consistency across large collections of circulars.
Automation can also help prioritize monitoring activities. For example, businesses may focus on high-volume categories, frequently promoted brands, or products with substantial observed price changes.
AI-generated insights should remain grounded in validated source records. Product matching, discount calculations, and predictions require quality checks because OCR errors, misleading reference prices, changing package sizes, and incomplete promotional conditions can distort results.
Combining automated extraction with human review for ambiguous records creates a more reliable foundation for commercial decision-making.
Building Real-Time and Historical Grocery Price Monitoring Systems
Weekly circulars are inherently time-bound, so businesses need a collection schedule that captures promotions before they expire.
Real-Time Price Monitoring can support frequent checks of accessible retailer pages and newly published promotions. However, actual update speed depends on source availability, publication schedules, website restrictions, and the collection frequency.
Historical tracking is equally important. A current snapshot shows which prices are advertised today, while a historical dataset reveals whether those prices are typical, unusually low, or part of a recurring promotional cycle.
A practical monitoring system should include source discovery, scheduled collection, data validation, historical storage, change detection, and alert generation.
For example, a retailer could receive an alert when a tracked competitor advertises a substantial discount on a key product category. A manufacturer could monitor when its products appear in circulars across multiple markets.
Responsible collection practices should respect applicable laws, website terms, access controls, and rate limits. Businesses should also distinguish publicly advertised prices from actual checkout prices, which may vary because of taxes, membership conditions, availability, and store-specific rules.
How to Visualize Grocery Promotion Data
A centralized dashboard helps business users interpret promotional information without manually reviewing individual circulars.
A Grocery Dashboard can present key indicators such as average advertised sale price, median discount percentage, promotion count, number of monitored retailers, and the distribution of offers across product categories.
Useful dashboard views include retailer-versus-retailer price comparisons, weekly discount trends, regional promotional maps, brand-level promotion frequency, and products with the largest observed price changes.
Filters for retailer, product category, brand, location, package size, and promotion dates help analysts investigate specific questions quickly.
For example, a category manager could compare advertised cereal prices across several retailers over eight weeks. A regional marketing team could examine whether beverage promotions are more frequent in selected markets during summer.
Dashboards should display data collection dates, source coverage, promotion conditions, and product-matching confidence where appropriate. These details help users understand the limitations of each comparison and avoid treating incomplete observations as definitive market-wide results.
Business Benefits of Grocery Circular Promotion Scraping
The commercial value of circular extraction comes from making promotional information consistent, searchable, and available for repeated analysis.
Web Scraping Price data for Grocery helps organizations replace fragmented manual research with repeatable data collection workflows, supporting faster competitor comparisons and more structured reporting.
The key benefits include:
- Improved price transparency: Compare advertised prices across multiple retailers and locations.
- Reduced manual effort: Automate repetitive collection and formatting tasks.
- Better promotional planning: Identify discount patterns and competitor campaign timing.
- Stronger category management: Evaluate price positioning across products and grocery departments.
- Enhanced regional analysis: Understand differences between local and national promotional strategies.
- Historical trend visibility: Track recurring offers and changes in advertised prices.
- More informed decisions: Give merchandising, pricing, and marketing teams access to consistent records.
The value of these benefits depends on source coverage, extraction accuracy, data freshness, and the quality of product matching. Reliable data management is therefore just as important as collection volume.
How Food Data Scrape Can Help You?
1. Automated Circular Collection
Food Data Scrape can help businesses collect publicly available grocery circulars and promotional listings from selected US retailers, reducing manual research while organizing product details, advertised prices, discounts, and promotion validity into structured datasets.
2. Cross-Retailer Price Benchmarking
Our solutions can standardize comparable product records across grocery chains, helping businesses analyze advertised prices, promotional depth, package sizes, and regional variations to understand competitor positioning and identify potential pricing opportunities.
3. Historical Promotion Tracking
Food Data Scrape can support scheduled data collection and historical storage, allowing analysts to evaluate recurring discounts, seasonal campaigns, brand visibility, and changes in promotional frequency across selected grocery categories and markets.
4. Customized Datasets and Dashboards
Businesses can receive organized datasets in suitable formats and connect them to reporting systems or dashboards. Filters for retailers, products, locations, and dates make promotional information easier to explore and interpret.
5. Scalable Grocery Intelligence
Food Data Scrape can help organizations develop repeatable monitoring workflows that combine data validation, product matching, price comparisons, and analytical reporting, supporting informed decisions across grocery pricing, merchandising, and promotional planning.
Conclusion
Weekly grocery circulars provide valuable evidence of how retailers compete for consumer attention through discounts, loyalty offers, seasonal campaigns, and category-specific promotions. Systematically collecting this information helps businesses move beyond isolated advertisements and develop a more consistent understanding of the US grocery pricing landscape.
A structured scraping strategy combines product identification, price extraction, promotion validation, geographic mapping, and historical analysis. These capabilities support competitive benchmarking, category management, brand monitoring, and promotional planning while reducing the effort required for repetitive manual research.
With reliable Grocery Store Datasets, businesses can compare advertised offers across retailers, examine changes over time, and identify meaningful patterns across product categories and geographic markets. Investing in Grocery Data Scraping in the USA can strengthen the availability of structured promotional information for pricing analysts, consumer brands, retailers, and market researchers.
Combining accurate extraction with AI Grocery Intelligence can further support product matching, anomaly detection, promotional classification, and analytical reporting. Ultimately, the strongest results come from maintaining high-quality data, documenting promotional conditions, and translating verified observations into practical business decisions.
Are you in need of high-class scraping services? Food Data Scrape should be your first point of call. We are undoubtedly the best in Food Data Aggregator and Mobile Grocery App Scraping service and we render impeccable data insights and analytics for strategic decision-making. With a legacy of excellence as our backbone, we help companies become data-driven, fueling their development. Please take advantage of our tailored solutions that will add value to your business. Contact us today to unlock the value of your data.