
Introduction
Quebec's grocery market is highly competitive, with retailers continuously updating weekly flyers, promotional offers, loyalty incentives, seasonal discounts, and multi-buy deals to attract price-conscious shoppers. For brands, retailers, suppliers, and market analysts, manually reviewing these changes across multiple grocery chains can quickly become inefficient. Weekly Grocery Flyer Data Scraping In Quebec provides a structured way to capture changing promotions, product prices, pack sizes, discounts, and flyer details from major grocery retailers operating across the province. Through automated Grocery Flyer Price Data Extraction, businesses can transform scattered promotional information into organized datasets for comparison and analysis. Meanwhile, Weekly Grocery Discount Data Tracking in Quebec helps identify recurring promotions, aggressive price reductions, retailer-specific strategies, and changing consumer-value propositions throughout the year.
Understanding Quebec's Weekly Grocery Flyer Landscape
Weekly grocery flyers are an important source of pricing and promotional intelligence in Quebec. Retailers use them to showcase discounted products, limited-time offers, loyalty pricing, seasonal campaigns, and category-specific promotions. Flyers may cover fresh produce, dairy, meat, bakery products, beverages, packaged foods, frozen products, household essentials, and personal-care categories.
The promotional environment can change substantially from one week to another. A product that receives a significant discount this week may return to its regular price the following week, while another product may enter a multi-week promotional cycle. Tracking these movements over time creates a historical pricing record that is considerably more useful than viewing individual flyers independently.
Automated collection makes it possible to organize information such as product name, brand, category, regular price, promotional price, discount percentage, unit size, promotional period, loyalty requirements, and offer type. This structured approach allows businesses to examine both individual products and broader market movements.
Why Weekly Discount Tracking Matters?
Price-conscious consumers are increasingly attentive to grocery promotions, especially when household food budgets are under pressure. Retailers therefore compete not only through everyday pricing but also through weekly promotional strategies.
A weekly tracking system can reveal which retailers consistently discount particular categories and which rely on deeper short-term promotions. It can also identify products that repeatedly appear in flyers, helping businesses understand promotional frequency and pricing patterns.
For suppliers and consumer brands, this intelligence can provide visibility into how their products are positioned against competing brands. If one retailer repeatedly promotes a competing product at a lower price, the information can help commercial teams evaluate promotional positioning and market competitiveness.
For retailers, historical flyer information can support decisions around promotional planning, assortment management, category pricing, and competitive benchmarking.
Building Structured Flyer Pricing Datasets
The value of flyer monitoring depends heavily on the quality and consistency of the collected data. Raw promotional information needs to be standardized before it can support reliable comparisons.
A comprehensive dataset can contain:
- Retailer and store information
- Product name and brand
- Product category and subcategory
- Regular price
- Promotional price
- Discount percentage
- Package or unit size
- Price per unit
- Flyer start and end dates
- Promotion type
- Loyalty-card requirements
- Multi-buy conditions
- Featured placement
- Seasonal or campaign indicators
Standardization is particularly important when retailers describe similar offers differently. One promotion may appear as a percentage discount, another as a fixed-dollar reduction, while another may use a "buy more, save more" structure. Converting these offers into consistent fields enables meaningful cross-retailer comparisons.
Comparing Promotional Strategies Across Retailers
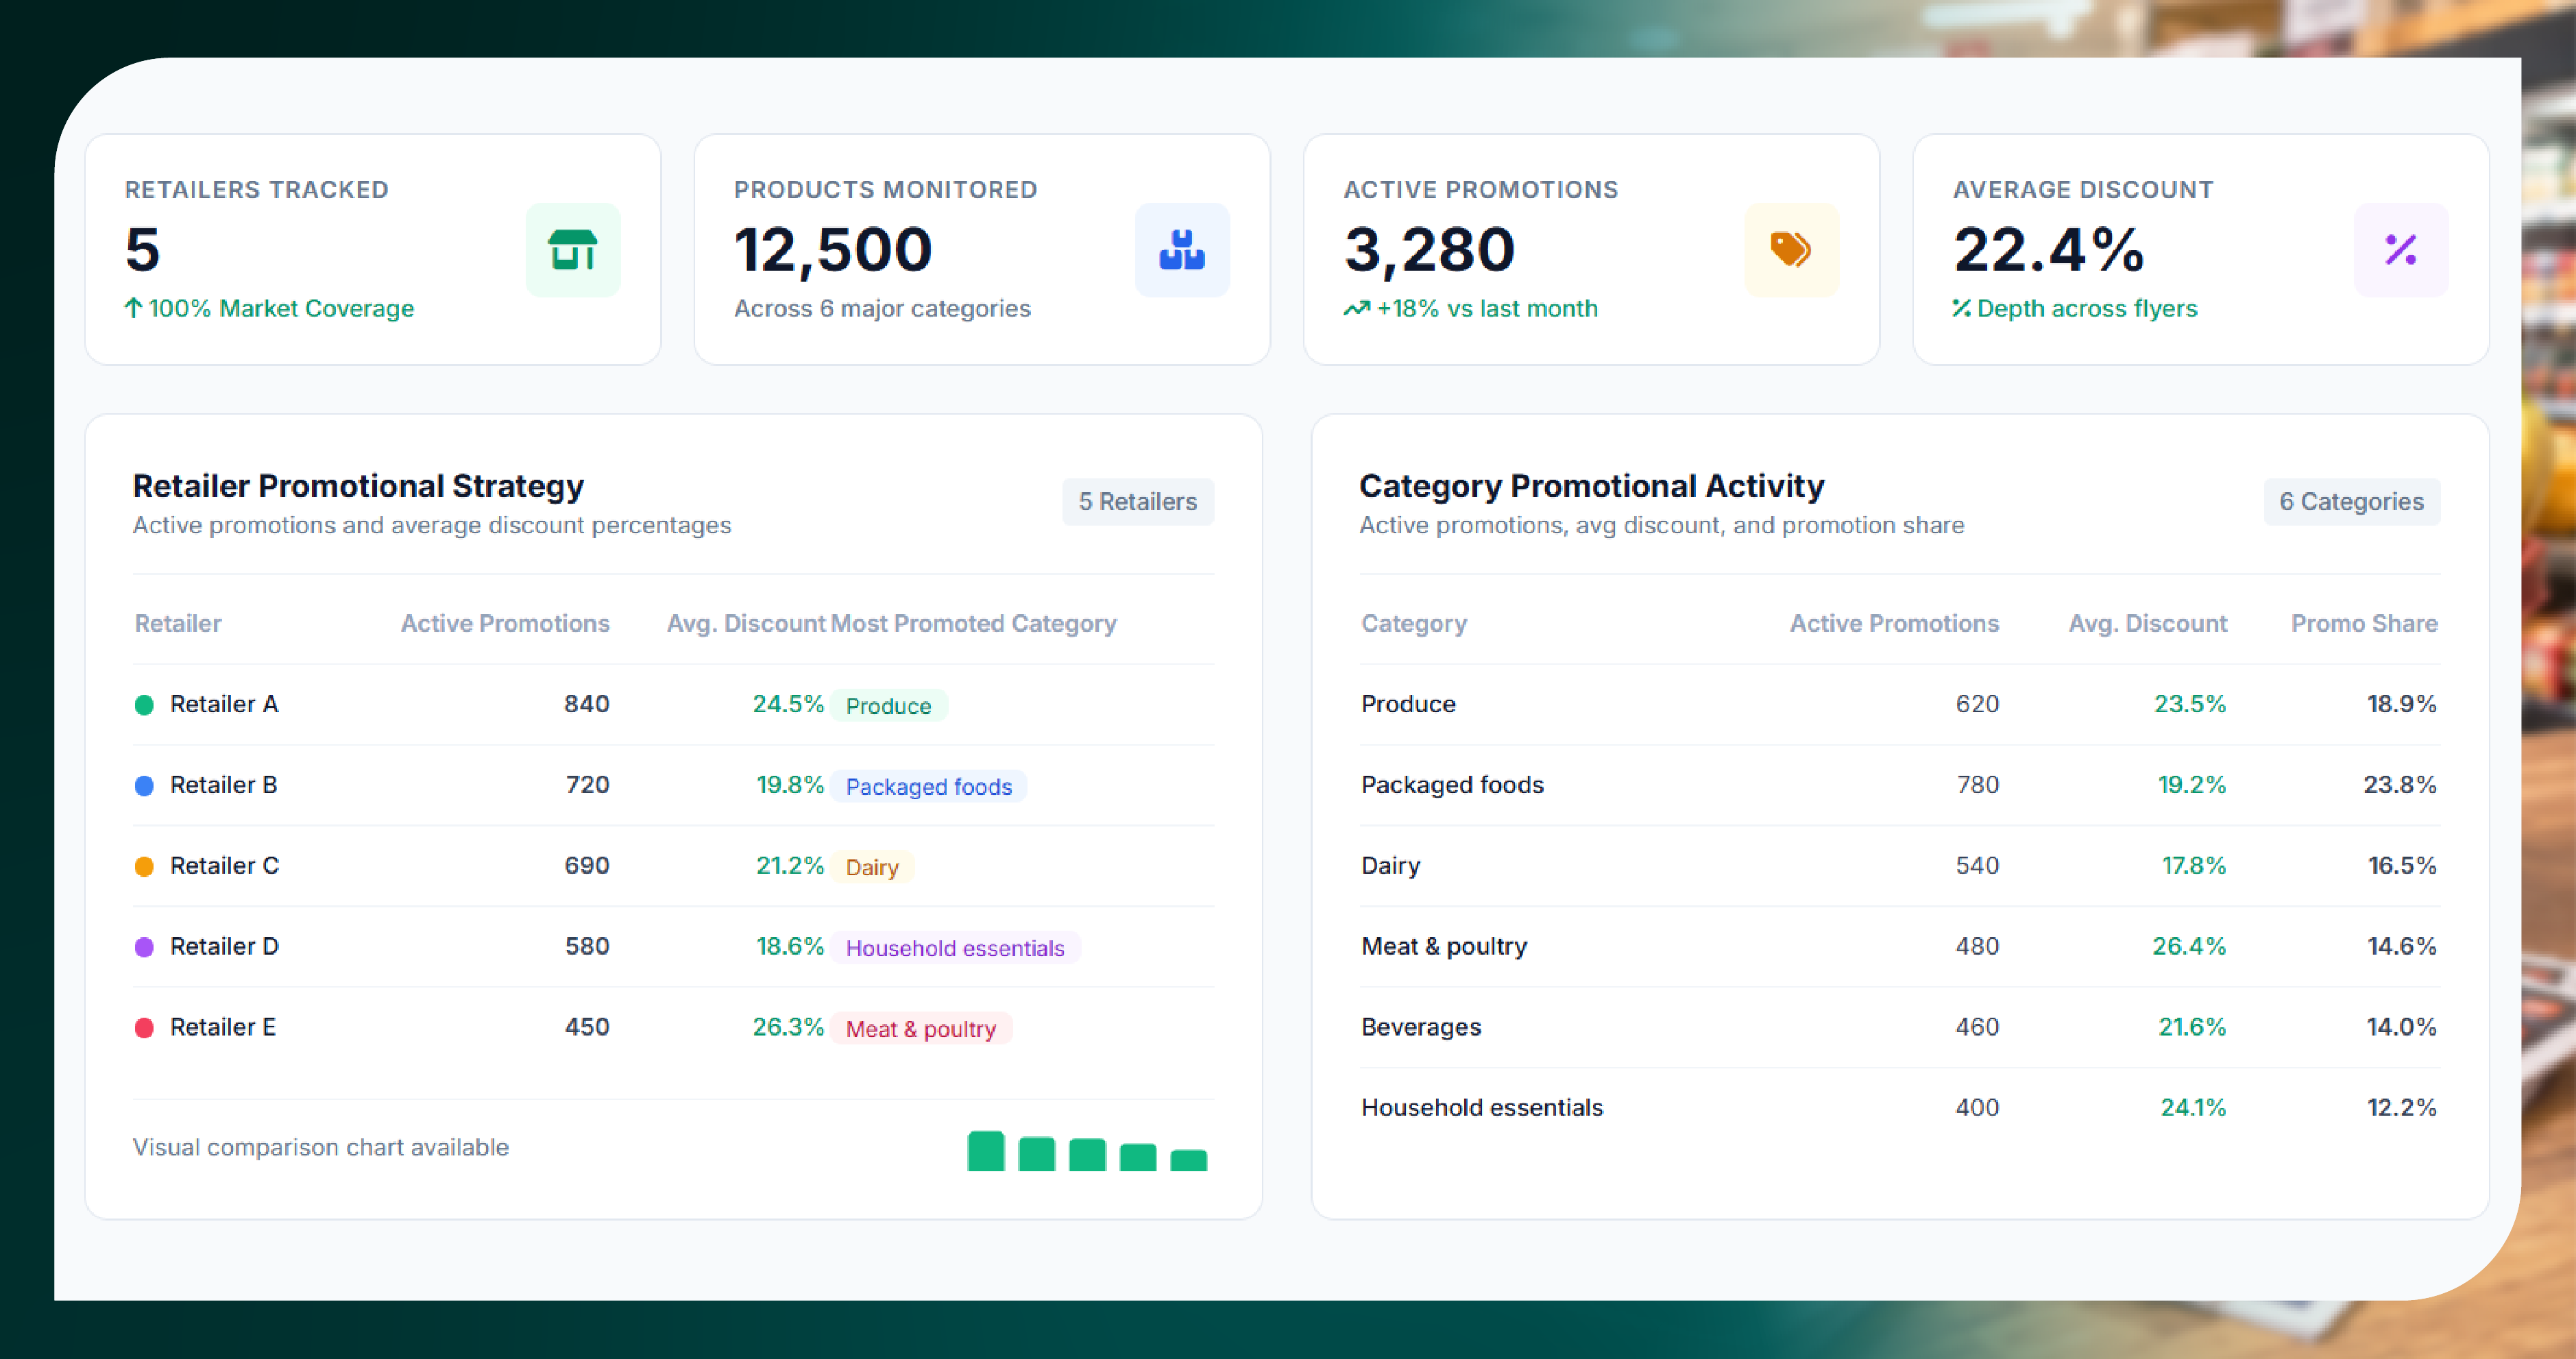
One of the strongest applications of flyer intelligence is retailer-to-retailer benchmarking. Businesses can compare how frequently products are discounted, how deep the discounts are, and which categories receive the greatest promotional attention.
For example, a weekly dataset may show that one retailer focuses heavily on produce promotions while another emphasizes packaged foods and household essentials. A third retailer might use loyalty-exclusive prices more frequently. These differences can help explain how grocery chains attempt to attract and retain specific shopper segments.
Price comparisons can also be performed at the SKU level. Tracking identical or comparable products across retailers makes it easier to calculate price gaps, identify the lowest promotional price, and monitor whether competitive differences are increasing or narrowing.
Over several months, this becomes valuable Quebec Grocery Market Intelligence, enabling businesses to understand not only current prices but also the direction and frequency of promotional activity.
Identifying High-Impact Grocery Deals
Not every flyer promotion has the same commercial significance. Some discounts are small and routine, while others represent major temporary price reductions designed to generate traffic.
Automated systems can Extract Supermarket Deal Data and classify promotions based on discount depth, category, product type, promotional frequency, and campaign duration. This makes it easier to identify high-impact deals without manually examining hundreds of products every week.
For example, analysts can isolate promotions offering discounts above 20%, products appearing in multiple consecutive flyers, or categories experiencing an unusual increase in promotional activity.
Such analysis can also identify promotional gaps. If one retailer aggressively discounts a category while competitors maintain stable prices, the difference may represent a strategic opportunity for another retailer or supplier.
Monitoring Seasonal and Holiday Promotions
Quebec grocery promotions are strongly influenced by seasonal events, holidays, weather patterns, and consumer purchasing cycles. Promotional activity can increase around major holidays and seasonal shopping periods.
Products associated with summer grilling, back-to-school shopping, Thanksgiving, holiday entertaining, winter comfort foods, and other seasonal occasions may receive increased flyer exposure.
Historical datasets allow analysts to compare current promotions with previous years. Businesses can determine when promotional activity typically begins, how discount depth changes during peak periods, and which products repeatedly become promotional leaders.
This historical perspective can improve promotional planning and make seasonal pricing decisions more data-driven.
Measuring Discount Depth and Promotional Frequency
Two important metrics in weekly flyer analysis are discount depth and promotional frequency.
Discount depth measures how far the promotional price moves below the regular price. A simple calculation can be represented as:
Discount Percentage = ((Regular Price − Promotional Price) / Regular Price) × 100
Promotional frequency measures how often a particular product, brand, or category appears in promotional campaigns over a defined period.
Together, these metrics provide a richer picture of pricing behavior. A product may have a modest discount but appear in flyers every few weeks, while another may have a much deeper discount but only appear during major seasonal campaigns.
Analyzing both dimensions helps businesses distinguish regular promotional products from strategically timed price events.
Turning Flyer Data Into Competitive Insights
Raw flyer data becomes significantly more valuable when transformed into dashboards and analytical views. Businesses can monitor average promotional prices, discount percentages, category-level trends, retailer rankings, and weekly changes through centralized reporting environments.
A dashboard could show the number of promotions recorded each week, average discount depth by retailer, products with the largest price reductions, and categories experiencing the greatest promotional activity.
Historical comparisons can reveal whether promotional intensity is increasing or decreasing. A retailer that consistently increases the number of discounted SKUs may be adopting a more aggressive promotional strategy, while declining flyer activity could indicate a shift toward everyday-low-price positioning.
Turn weekly grocery flyer data into actionable pricing intelligence with Food Data Scrape. Get accurate, structured, and timely grocery discount data to strengthen competitive analysis and smarter pricing decisions.
AI-Powered Analysis of Grocery Promotions
Large-scale flyer datasets can contain thousands of products and promotional records. Reviewing these datasets manually can make it difficult to identify subtle patterns.
AI-driven analysis can help classify products, detect unusual price movements, identify recurring promotional patterns, and highlight significant changes between weeks. Grocery Discount Data Scraping Quebec can therefore become more than a collection process when integrated with analytical models and automated reporting.
AI Grocery Intelligence can support faster interpretation of promotional data by identifying anomalies, ranking significant discounts, grouping comparable products, and surfacing emerging pricing patterns.
For example, an AI-assisted system could flag a product whose promotional price is substantially lower than its historical average or identify a category where multiple retailers simultaneously increased discount activity.
Supporting Better Business Decisions
Weekly flyer intelligence can support several commercial functions simultaneously.
- Retail pricing teams can benchmark promotional prices and identify competitive gaps.
- Consumer brands can monitor how frequently their products and competing products are promoted.
- Suppliers can analyze retailer promotional behavior and assess category-level competition.
- Market researchers can use historical datasets to identify long-term pricing and promotional trends.
- E-commerce teams can compare promotional strategies across online and offline grocery channels.
The same underlying dataset can therefore serve multiple departments, reducing duplicated research and improving access to consistent market information.
From Weekly Flyers to Long-Term Market Intelligence
The greatest value comes from maintaining flyer data continuously rather than conducting isolated weekly checks. Once multiple weeks, months, or years of information are accumulated, businesses can build a historical promotional database.
This enables analysis of price volatility, promotional calendars, discount cycles, retailer positioning, brand competitiveness, and category trends.
A long-term dataset can answer questions such as which products are discounted most frequently, which categories experience the deepest promotions, how promotional pricing changes seasonally, and which retailers consistently offer competitive prices.
The result is a transition from basic flyer monitoring to strategic grocery intelligence.
How Food Data Scrape Can Help You?
1. Automated Flyer Data Collection
Food Data Scrape can collect weekly grocery flyers, product details, promotional prices, discounts, pack sizes, and offer periods, reducing manual research while maintaining consistent, structured datasets.
2. Competitive Price Monitoring
Track grocery prices and promotions across leading Quebec retailers to identify price differences, promotional strategies, discount trends, and competitive opportunities with regularly refreshed market intelligence.
3. Discount Trend Analysis
Analyze historical promotional data to identify frequently discounted products, discount depth, seasonal offers, recurring deals, and category-level pricing patterns for stronger promotional planning and benchmarking.
4. Customized Grocery Datasets
Receive structured grocery datasets tailored to specific products, categories, retailers, locations, pricing attributes, and promotional requirements, making the information easier to integrate into analytics platforms.
5. Actionable Market Intelligence
Transform collected flyer and pricing information into actionable insights that help retailers, brands, suppliers, and analysts understand market movements, optimize pricing strategies, and improve competitive decision-making.
Conclusion
Quebec's grocery sector demands continuous visibility into pricing and promotional activity. Weekly flyer monitoring provides businesses with the foundation needed to understand changing discounts, competitive positioning, product-level price movements, and retailer promotional strategies. With automated Grocery Data Scraping Services, organizations can maintain scalable datasets covering weekly promotions and historical pricing movements across grocery retailers.
Combining these datasets with Real-Time Price Monitoring creates a broader pricing intelligence framework capable of connecting flyer promotions with changing market prices. When historical records are enriched with Grocery Discount Analysis Data, businesses can evaluate discount depth, promotional frequency, category behavior, and retailer competitiveness with greater precision.
Ultimately, weekly flyer data is more than a collection of advertisements. When systematically captured, standardized, and analyzed, it becomes a powerful source of competitive intelligence that can help retailers, brands, suppliers, and analysts make faster and more informed decisions in Quebec's evolving grocery market.
Are you in need of high-class scraping services? Food Data Scrape should be your first point of call. We are undoubtedly the best in Food Data Aggregator and Mobile Grocery App Scraping service and we render impeccable data insights and analytics for strategic decision-making. With a legacy of excellence as our backbone, we help companies become data-driven, fueling their development. Please take advantage of our tailored solutions that will add value to your business. Contact us today to unlock the value of your data.
Get a Free Food Data Sample in 48 Hours.
Tell us your platforms, target markets and required fields — we'll map exactly what's possible with food data scraping, recommend the right approach, and send a working sample so you can verify quality before any commitment.
Request a strategy call
Thanks — our data team will reach out within 48 hours with your sample.



