
Background: The Market Before Amazon Went "Now"
Quick commerce in India began as a niche 10–15 minute grocery-delivery model and became mainstream in roughly three years. By early 2026 the category was large and growing fast:
| Metric | Figure | Source |
|---|---|---|
| Market size (end 2025) | ~$11.5 Bn (₹95,500 Cr) | Datum Intelligence, via Reuters |
| YoY growth | ~75% | Datum Intelligence |
| Daily orders (industry) | ~7.8 million/day (Jan 2026) | Redseer |
| Dark stores operating | 6,000+ across India | Bernstein |
| Projected market (2029–30) | ~$13–30 Bn (varies by definition) | ResearchAndMarkets, others |
Before mid-2025, the field was effectively a three-horse race:
- Blinkit (Eternal / formerly Zomato) — the runaway leader at ~46–50% share.
- Swiggy Instamart — strong #2 at ~24–27%.
- Zepto — independent challenger at ~21–22%.
These three commanded 85%+ of the market. Then the incumbents arrived.
The Trigger: Amazon Now Goes Big (June 2026)
During his June 2026 India visit, Andy Jassy visited a Mumbai micro-fulfilment centre and set out an aggressive plan:
- 300+ cities targeted for Amazon Now.
- ~$300M / ₹2,800 Cr committed for 2026, on top of ₹2,000 Cr spent in 2025.
- 100+ new Urban Fulfilment Centres, deliberately stocking beyond grocery — apparel, electronics, jewellery, furniture, luggage.
- A supply-chain push connecting 16,000+ farmers to consumers, with ~70% of fresh produce sourced within 200 km of delivery.
At the same time, Flipkart Minutes was reportedly adding ~100 dark stores a month, on track for ~1,200 stores and 130+ cities. BigBasket Now leaned on Tata sourcing muscle, and JioMart scaled its own express play.
The result: the "war" narrowed to roughly six top-tier players, with Amazon Now and Flipkart Minutes each crossing 500+ dark stores and squeezing pure-play startups.
The Real Battleground: Price, Discount & Availability
The differentiator is no longer "10 minutes." Every serious player delivers fast. The war is now fought on three data-rich fronts:
- Price — the same 1L milk, 1kg atta, or branded shampoo is listed at different prices across platforms, and those prices move with demand, time of day, and promo cycles.
- Discount depth & coupons — platform-funded vs brand-funded discounts shift constantly as each player buys market share.
- Availability & assortment — which SKUs are in stock in which pincode, and which platform has an item a rival has run out of.
Analysts already forecast diverging average order values (e.g. Blinkit ~₹709 vs Instamart ~₹619 in 2026), and category expansion into pharmacy, beauty, and electronics — meaning the SKU universe to monitor is exploding.
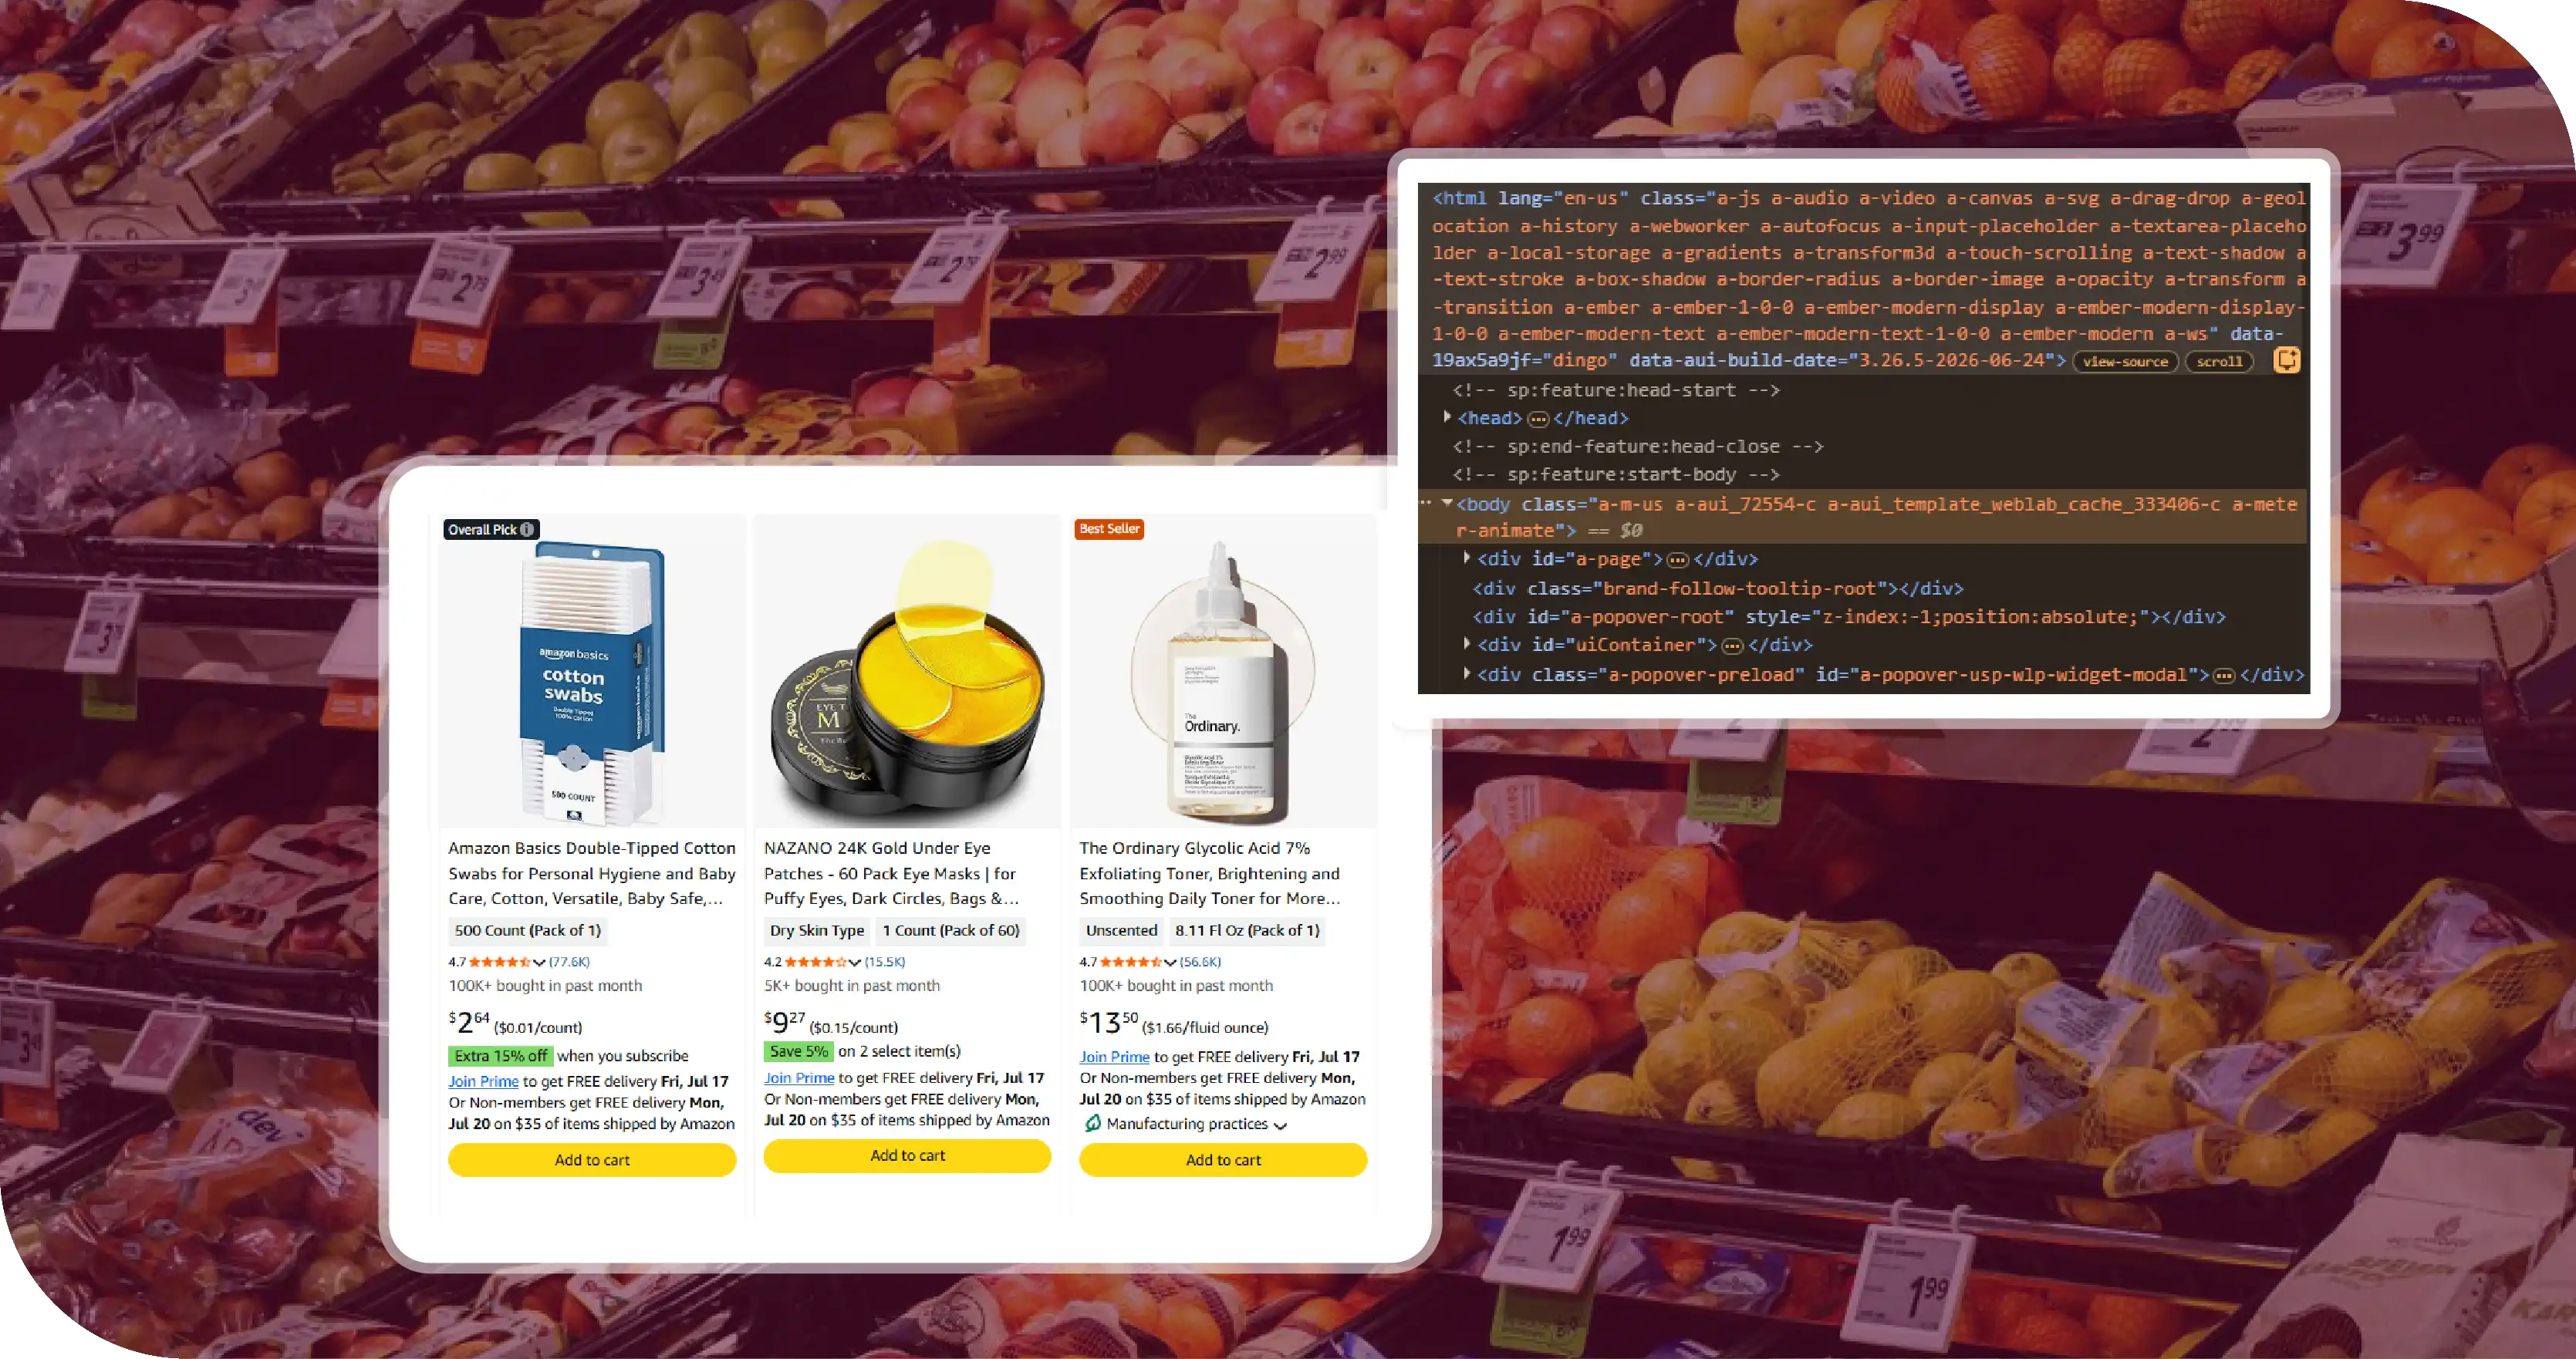
The problem: this data is scattered across 6+ apps, is pincode-specific, changes multiple times a day, and is never published in one place.
The Challenge
Different stakeholders feel the same pain:
- FMCG / D2C brands need to know if their MRP and promo compliance is holding across platforms, and whether a distributor is undercutting them in specific pincodes.
- Sellers & aggregators need competitive price benchmarks to set their own listings.
- Category managers at the platforms themselves need to watch rivals' pricing in near-real-time.
- Analysts, investors & consultants need clean panel data to model share, AOV, and promo intensity.
Manual checking — opening six apps, changing pincodes, screenshotting prices — does not scale past a handful of SKUs. It is stale the moment it's collected.
The Solution: A Multi-Platform Food & Grocery Scraping Pipeline
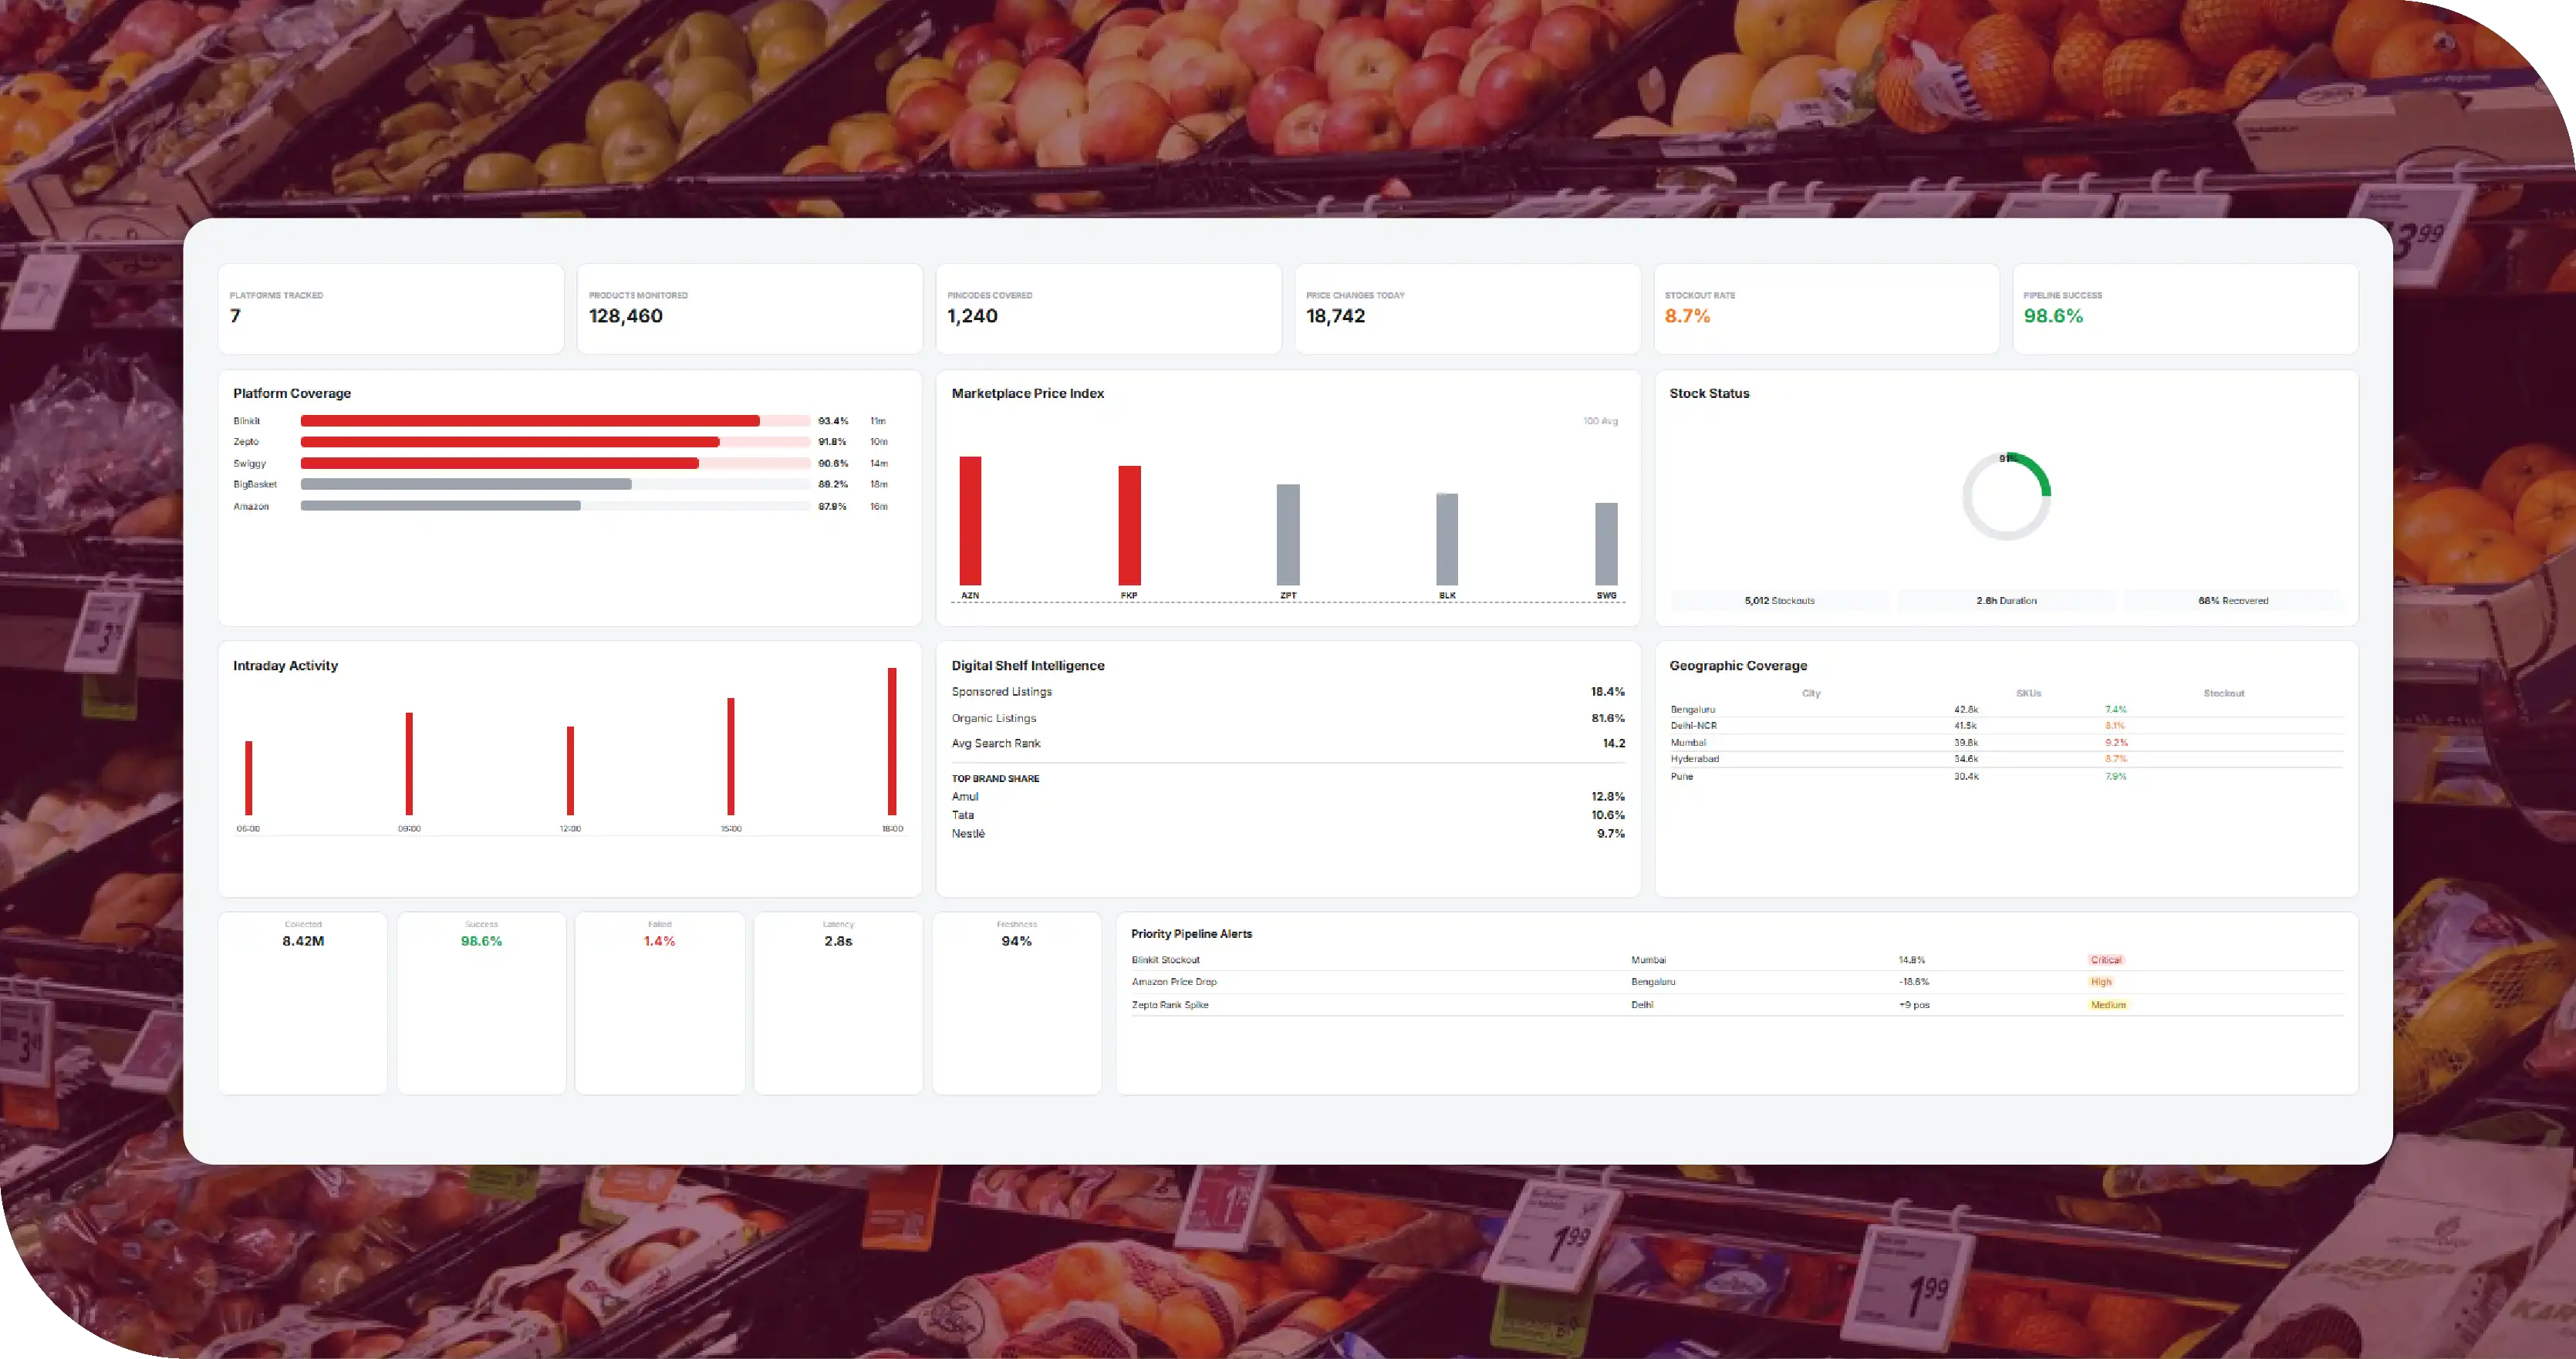
This is where a structured data-scraping operation becomes the core infrastructure. A well-designed pipeline captures, on a schedule:
Entities to extract per platform, per pincode:
- Product name, brand, pack size, category
- Selling price, MRP, discount %, coupon/offer text
- In-stock / out-of-stock status
- Delivery ETA and delivery/handling fees
- Ranking / position on category and search pages
- Sponsored vs organic placement (ad intelligence)
Coverage dimensions:
- Platforms: Blinkit, Swiggy Instamart, Zepto, Amazon Now, Flipkart Minutes, BigBasket Now, JioMart
- Geography: multiple pincodes per city, across metro + tier-2/3
- Time: multiple snapshots per day to catch intraday repricing
Delivery formats:
- Clean CSV/JSON/Parquet feeds
- Dashboards for price-gap and stockout alerts
- API for ingestion into a client's BI stack
What the Data Unlocks (Use Cases)
| Use case | Who it's for | What the scraped data provides |
|---|---|---|
| Price war monitoring | Brands, analysts | Live cross-platform price index per SKU/pincode |
| MAP / MRP compliance | FMCG & D2C brands | Alerts when a platform breaches agreed pricing |
| Assortment & share-of-shelf | Brands, category teams | Which SKUs each platform stocks, and where |
| Stockout intelligence | Brands, sellers | Where a competitor is out of stock (demand capture) |
| Promo & discount tracking | Marketing, revenue teams | Depth and timing of each platform's offers |
| Dark-store expansion signals | Investors, strategy | New pincodes going live = expansion proxy |
| Search & ad rank monitoring | Retail media teams | Sponsored placement and keyword visibility |
Why the Timing Matters
The Amazon Now expansion is not a one-off headline — it is a structural shift:
- More players = more price volatility. Six funded competitors discounting to win share means prices are the least stable they've ever been.
- Category expansion = a bigger SKU universe. As q-commerce moves beyond groceries into beauty, pharmacy, and electronics, the monitoring surface grows.
- Tier-2/3 rollout = geographic explosion. Data now has to be captured across hundreds of cities and thousands of pincodes, not just eight metros.
- Unit economics under scrutiny. With most players still loss-making outside top cities, pricing discipline is a board-level topic — and that runs on data.
In short: the price war is a data war. The platforms that can see the whole board win; the brands that can measure it protect their margins.
Conclusion
Amazon Now's push to 300+ cities didn't just add another logo to the grocery-delivery map — it made continuous, multi-platform price and availability intelligence a non-negotiable requirement for anyone selling, buying, or analysing in Indian q-commerce.
For a food-data-scraping operation, this is the clearest possible market signal: the demand for clean, real-time, pincode-level grocery price and assortment data is scaling exactly as fast as the price war itself.



