

474 Locations: Cava operates 474 restaurants across the United States.
Texas Leadership: Texas leads nationwide with 72 Cava restaurant locations.
30 Markets: Cava locations span 30 states and territories nationwide.
321 Cities: Restaurants are distributed across 321 cities nationally.
Leading Cities: New York leads individual cities with 13 locations.

The Number of Cava locations in the USA in 2026 has reached 474 locations, demonstrating the restaurant brand's substantial footprint across the U.S. market as of May 12, 2026. These locations span 30 states and territories and 321 cities, creating a geographically distributed network across major metropolitan and suburban markets.
For businesses studying restaurant expansion, geographic saturation, and competitive positioning, Cava Restaurant Locations Data Scraping In USA provides a structured way to monitor store counts, addresses, geographic coordinates, phone numbers, and market coverage. Similarly, CAVA Store Location Data Extraction In USA can support territory planning, competitor benchmarking, franchise analysis, and location-based market research.
The data indicates that Texas has the largest Cava presence, with 72 locations, representing approximately 15% of the U.S. total. California follows with 45 locations, while Florida has 43. Virginia, North Carolina, Georgia, Maryland, New York, Massachusetts, and Pennsylvania also feature prominently among the leading markets.
This distribution provides an important foundation for understanding Cava's U.S. restaurant network. By examining state-level concentration, city-level density, population coverage, and individual restaurant attributes, businesses can identify expansion patterns and competitive opportunities.
Cava Restaurant Locations Data Scraping In USA can capture detailed restaurant-level information including store names, street addresses, cities, states, ZIP codes, phone numbers, latitude, longitude, country, and update dates.
CAVA Store Location Data Extraction In USA enables organizations to transform dispersed restaurant-location information into structured datasets suitable for geographic analysis, visualization, market intelligence, and business development.
Number of Cava locations in the USA in 2026 therefore represents more than a simple store-count metric. It provides a measurable indicator of geographic reach and enables researchers to investigate where Cava is concentrated, where it remains absent, and how its restaurant network is distributed across the country.
Cava had 474 U.S. locations in the May 12, 2026 dataset. The restaurants were distributed across 30 states and territories, while 26 states and territories had no recorded Cava locations.
The concentration of locations is particularly notable in Texas. With 72 restaurants, Texas alone accounts for approximately 15% of the national footprint. California contributes 45 locations, Florida 43, and Virginia 36.
These four markets collectively account for 196 locations, or approximately 41.4% of the total network. This indicates that Cava's footprint is not evenly distributed across the country. Instead, a significant share of locations is concentrated in selected regional markets.
| Rank | State / Territory | Cava Locations | Share of U.S. Locations | Population (M) | Population per Location | Approx. Locations per 1M People | Market Coverage Index* |
|---|---|---|---|---|---|---|---|
| 1 | Texas | 72 | 15.2% | 29.00 | 402,722 | 2.48 | 100 |
| 2 | California | 45 | 9.5% | 39.51 | 878,044 | 1.14 | 46 |
| 3 | Florida | 43 | 9.1% | 21.48 | 499,488 | 2.00 | 81 |
| 4 | Virginia | 36 | 7.6% | 8.54 | 237,111 | 4.22 | 170 |
| 5 | North Carolina | 30 | 6.3% | 10.49 | 349,667 | 2.86 | 115 |
| 6 | Georgia | 27 | 5.7% | 10.62 | 393,333 | 2.54 | 102 |
| 7 | Maryland | 26 | 5.5% | 6.05 | 232,692 | 4.30 | 173 |
| 8 | New York | 20 | 4.2% | 19.45 | 972,500 | 1.03 | 42 |
| 9 | Massachusetts | 20 | 4.2% | 6.89 | 344,500 | 2.90 | 117 |
| 10 | Pennsylvania | 15 | 3.2% | 12.80 | 853,333 | 1.17 | 47 |
| 11 | Other States/Territories | 140 | 29.5% | — | — | — | — |
| Total | United States | 474 | 100% | — | — | — | — |
*Market Coverage Index is a comparative calculation using Texas as the reference value of 100 based on locations per million residents.
The figures reveal different patterns between absolute store counts and population-adjusted density. Texas leads in total locations, while Maryland and Virginia have considerably more locations per million residents based on the supplied population figures.
California illustrates another important pattern. Despite having the country's largest state population among the listed markets, its 45 Cava restaurants translate into approximately 1.14 locations per million residents. New York and Pennsylvania similarly have comparatively low location density.
Cava's 474 locations are spread across 321 cities, suggesting a broad metropolitan and suburban strategy rather than concentration in only a handful of urban centers.
New York leads the city-level list with 13 locations, followed by Charlotte with nine. Atlanta and Houston each have eight, while Washington, D.C., has seven. Dallas has seven, and San Antonio, Austin, and Denver each have six.
| Rank | City | State / Territory | Locations | Share of Total | Estimated Position in Network | Location Density Group | Regional Market |
|---|---|---|---|---|---|---|---|
| 1 | New York | New York | 13 | 2.74% | 1 | Very High | Northeast |
| 2 | Charlotte | North Carolina | 9 | 1.90% | 2 | High | Southeast |
| 3 | Atlanta | Georgia | 8 | 1.69% | 3 | High | Southeast |
| 4 | Houston | Texas | 8 | 1.69% | 3 | High | South |
| 5 | Washington | District of Columbia | 7 | 1.48% | 5 | High | Mid-Atlantic |
| 6 | Dallas | Texas | 7 | 1.48% | 5 | High | South |
| 7 | San Antonio | Texas | 6 | 1.27% | 7 | Moderate | South |
| 8 | Austin | Texas | 6 | 1.27% | 7 | Moderate | South |
| 9 | Denver | Colorado | 6 | 1.27% | 7 | Moderate | Mountain |
| 10 | Los Angeles | California | 5 | 1.05% | 10 | Moderate | West |
| Top 10 Total | 75 | 15.82% | — | — | — | — | All U.S. |
| All U.S. Cities | 474 | 100% | — | — | — | — | — |
The top 10 cities collectively represent 75 locations, or approximately 15.8% of the entire U.S. network. This indicates that while Cava has strong clusters in leading metropolitan areas, most locations are distributed beyond these ten cities.
Texas is especially notable at the city level. Houston, Dallas, San Antonio, and Austin together account for 27 locations, reinforcing the state's position as the company's largest state market.
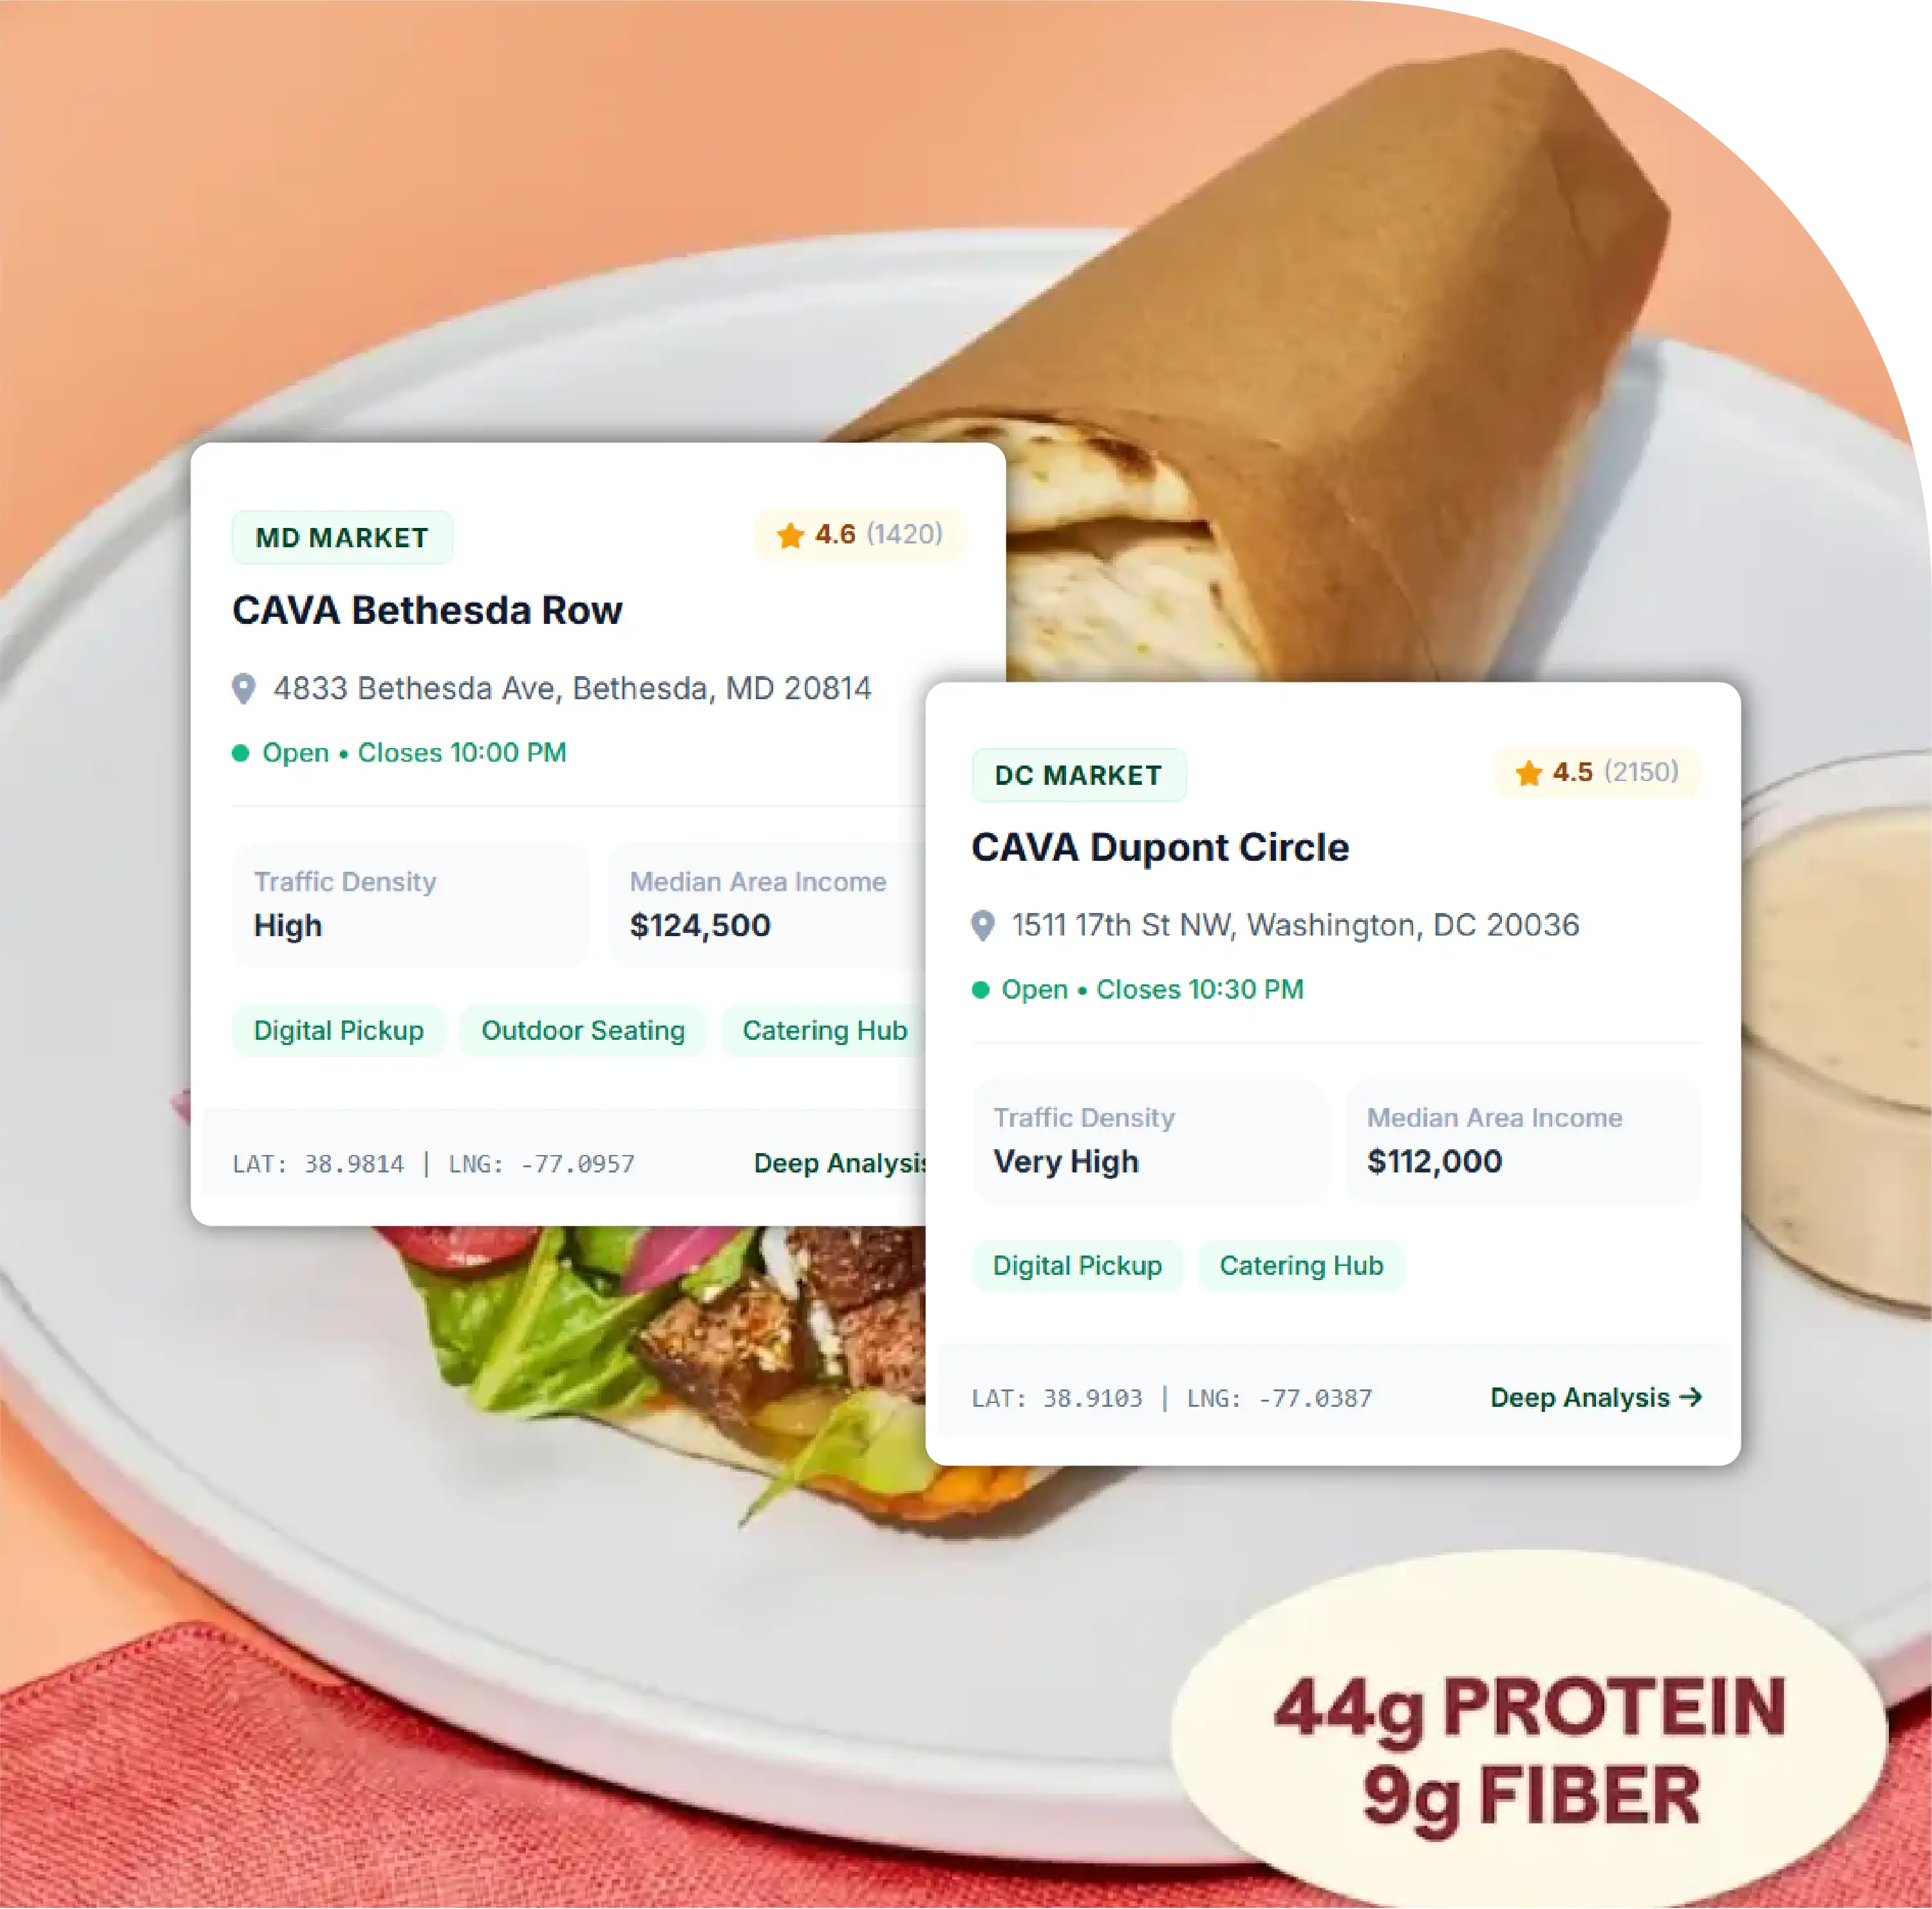
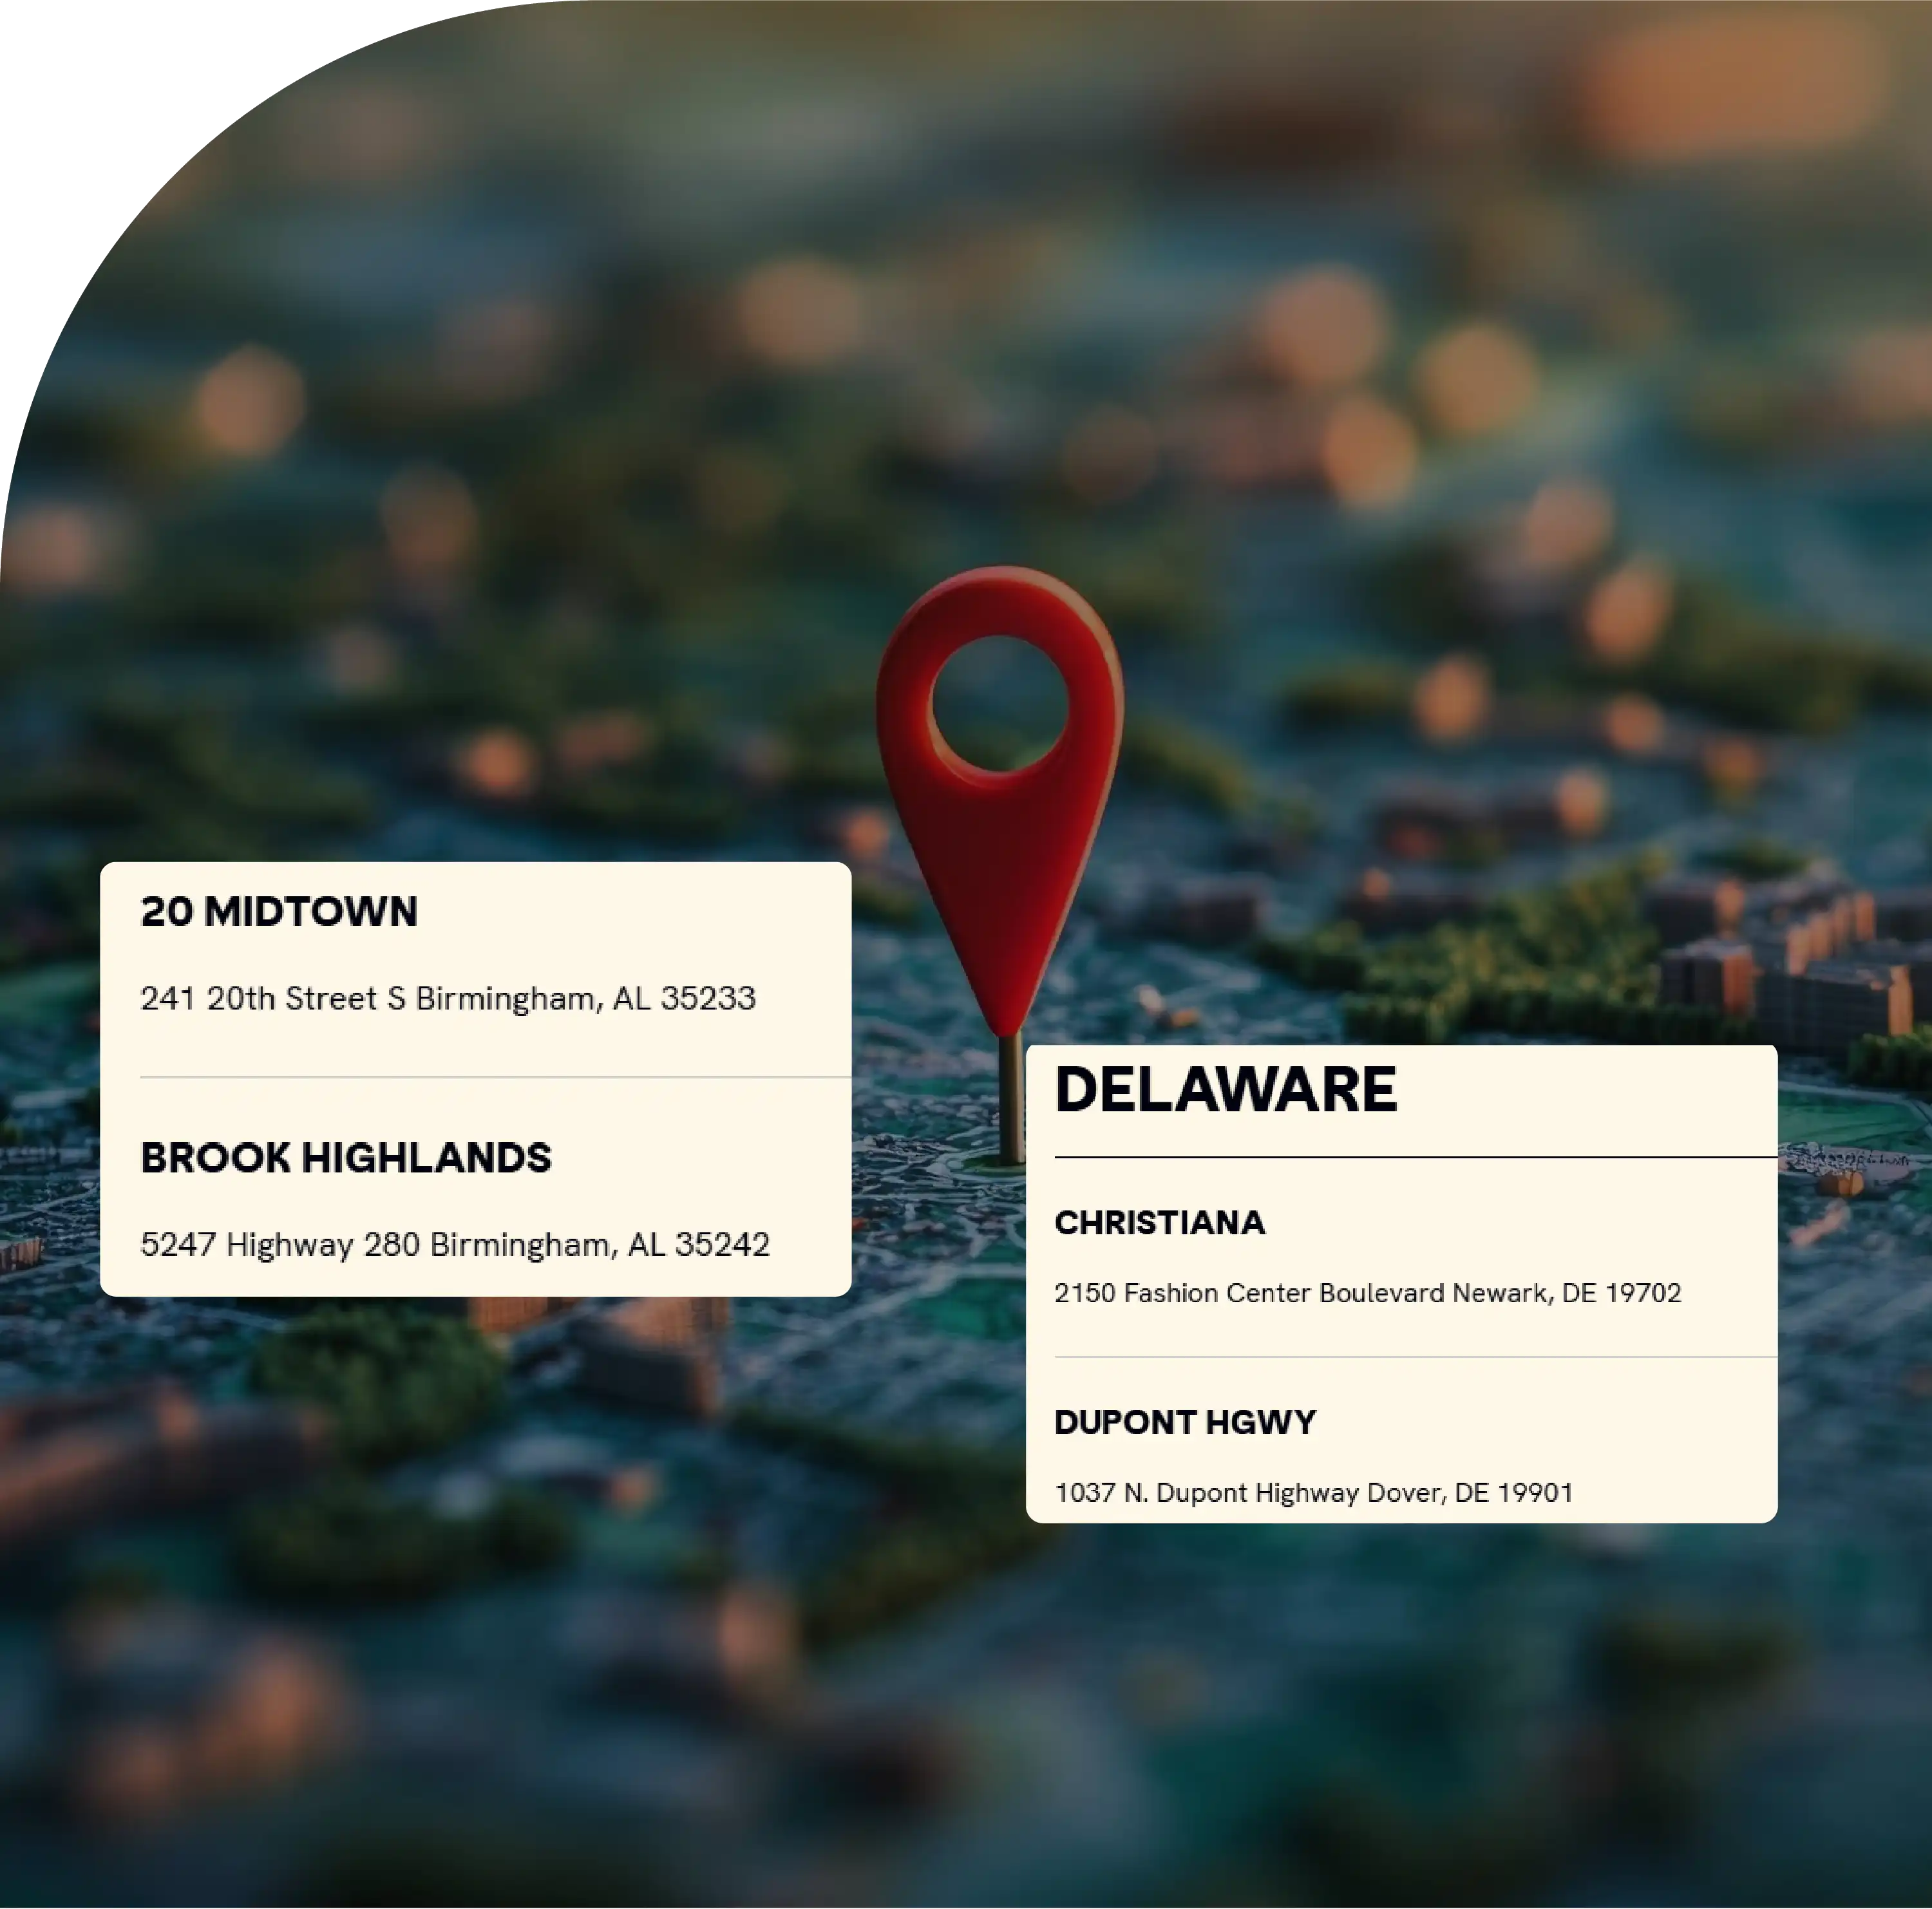
A location database becomes considerably more valuable when it moves beyond store counts. Individual records can contain restaurant names, addresses, ZIP codes, telephone numbers, geographic coordinates, countries, and update dates.
For example, the dataset includes locations such as Plano, Kyle Crossing, Texas Medical Center, Shops At Waldorf, Ramsey, Westlake, Champions Park 2, Lovers Lane, West Lake Hills, and a Boston location on Boylston Street.
The availability of latitude and longitude makes the dataset suitable for spatial analysis. Businesses can map restaurants, calculate distances between competing locations, identify clusters, and examine potential white-space markets.
Extract CAVA Restaurant Location Data to help organizations standardize location records and create continuously updated datasets for market research, territory planning, and business intelligence.
CAVA Restaurant Competitive Data Scraping can extend this analysis by comparing Cava locations against competing restaurant brands, including store density, geographic overlap, market entry patterns, and metropolitan concentration.
CAVA Restaurant Market Intelligence can combine location information with pricing, menus, customer reviews, promotions, operating hours, and other restaurant attributes to create a broader market perspective.
Food Data Scraping in the USA can further connect restaurant-location intelligence with grocery, food-delivery, menu, pricing, and consumer-market datasets across U.S. markets.
The 2026 dataset highlights several important characteristics of Cava's U.S. footprint.
First, geographic expansion is highly concentrated. Texas, California, Florida, and Virginia together account for nearly half of the locations among the listed leading markets.
Second, population size does not automatically correspond to restaurant count. California has 45 locations compared with Texas's 72, despite California having a substantially larger population in the supplied figures.
Third, metropolitan markets play a central role. New York, Charlotte, Atlanta, Houston, Dallas, Washington, San Antonio, Austin, Denver, and Los Angeles collectively form an important portion of the network.
Fourth, the absence of Cava locations in 26 states and territories identifies areas where the brand had no recorded locations in this dataset as of May 12, 2026. These markets can be monitored over time to identify changes in geographic coverage.
Finally, location-level records provide the foundation for longitudinal tracking. By comparing datasets from different dates, analysts can identify newly opened restaurants, closed locations, market expansions, and changes in regional concentration.
Location intelligence becomes more powerful when combined with additional restaurant datasets.
Restaurant Menu Data Scraping Services can capture menu items, categories, prices, descriptions, nutritional information, and other menu attributes, allowing businesses to analyze Cava's product assortment alongside its geographic footprint.
AI Restaurant Intelligence can then help organize large volumes of restaurant information into structured insights covering locations, menus, pricing, competitors, promotions, and market changes.
For restaurant operators, investors, technology companies, delivery platforms, and market researchers, this combined approach can provide a more comprehensive understanding of restaurant markets than store counts alone.
Cava's 474 U.S. locations as of May 12, 2026 demonstrate a substantial restaurant network spanning 30 states and territories and 321 cities. Texas leads with 72 locations, followed by California with 45 and Florida with 43. The concentration across major metropolitan markets provides useful insight into Cava's geographic footprint and regional market penetration.
Location-level datasets can support expansion analysis, competitor benchmarking, geographic mapping, territory planning, and longitudinal restaurant tracking. When combined with menu, pricing, review, and competitor information, restaurant-location datasets can become a broader intelligence resource.
Cuisine-wise Menu Data can complement location intelligence by showing how menu categories, dishes, prices, and cuisines vary across markets and competitors.
Food Data Scraping Services can integrate restaurant locations with broader food-market datasets covering menus, prices, delivery platforms, grocery products, and competitive offerings.
Scrape Restaurant API Data to further support automated access to structured restaurant information for dashboards, analytics platforms, research databases, and ongoing market-monitoring systems.
Overall, the May 2026 location snapshot establishes a detailed baseline for tracking Cava's U.S. restaurant network and measuring how its geographic presence develops across states, cities, and individual markets.
If you are seeking for a reliable data scraping services, Food Data Scrape is at your service. We hold prominence in Food Data Aggregator and Mobile Restaurant App Scraping with impeccable data analysis for strategic decision-making.



