
The Client
The client was a growing food-tech and restaurant investment company focused on identifying emerging opportunities within the rapidly expanding virtual restaurant ecosystem. Its team evaluated new concepts, delivery markets, and competitive positioning to determine where cloud-based food businesses could scale effectively.
The company wanted deeper visibility into marketplace activity because conventional restaurant research often overlooked delivery-only brands and shared-kitchen operations. Its objective was to strengthen cloud kitchen discovery using delivery marketplace analytics and uncover promising concepts across multiple locations.
The client also needed a reliable framework for cloud kitchens cloud kitchen benchmarking to compare menus, pricing, ratings, promotions, cuisine categories, delivery coverage, and brand presence against competing operators.
Another important requirement was identifying hidden or duplicate virtual concepts through ghost brand detection analytics. By combining marketplace data with structured competitive analysis, the client aimed to discover market gaps, evaluate competitor density, improve investment decisions, and identify scalable opportunities for future cloud kitchen launches. This data-led approach provided greater market transparency and reduced dependence on fragmented manual research.
Key Challenges
-
Invisible Brand Networks
The client found it difficult to identify relationships between seemingly independent delivery brands. Multiple virtual restaurants could share kitchens, menus, ownership patterns, or operating hours, making virtual restaurant benchmarking platform development challenging without deeper brand-level data relationships and entity matching. -
Marketplace Blind Spots
Delivery platforms presented different structures, naming conventions, category labels, and geographic coverage. The client needed Cloud Kitchen Data Scraping that could capture comparable information despite these inconsistencies, while detecting newly launched concepts, removed listings, changing menus, and evolving competitive positions. -
Operational Footprint Discovery
Many delivery-only businesses operated without prominent physical storefronts, making their real operating footprint difficult to understand. The challenge was to Map every dark store & dark kitchen accurately, connect multiple brands to shared locations, and reveal underserved areas for expansion opportunities.
Key Solutions
-
Unified Marketplace Intelligence
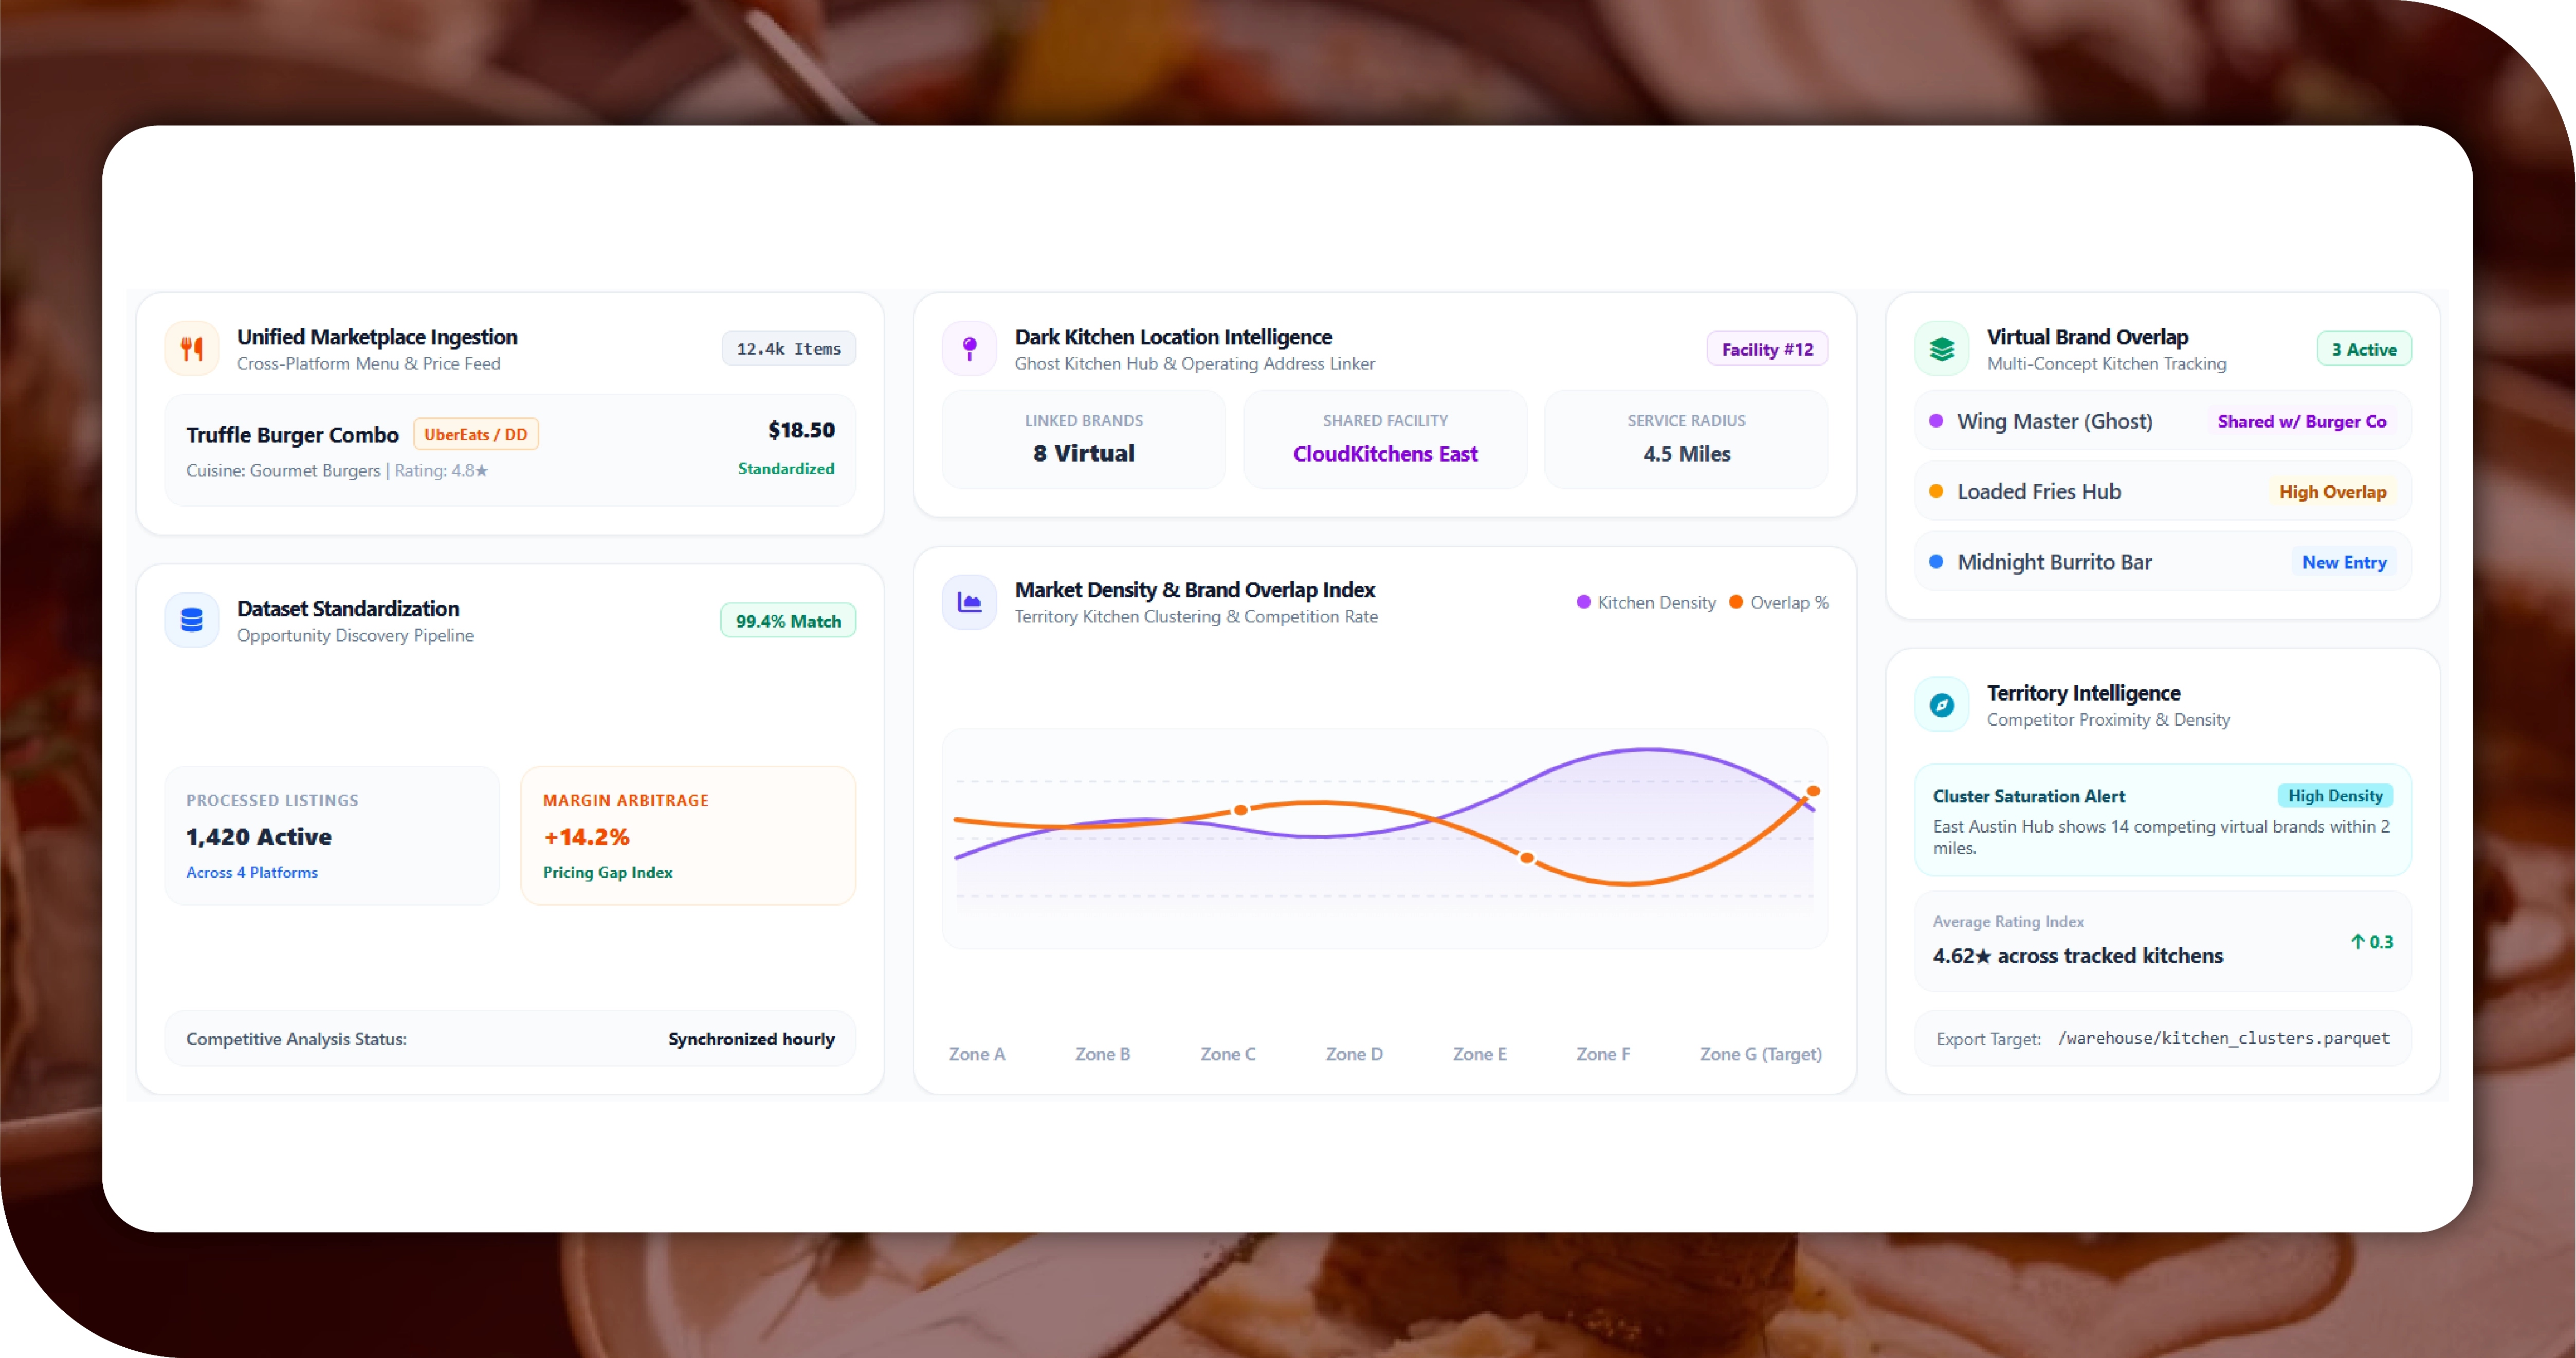
We developed a structured collection framework that consolidated restaurant listings, menus, prices, ratings, locations, cuisines, and brand information from multiple delivery marketplaces. Our Food Data Scraping Services transformed fragmented marketplace records into standardized datasets suitable for competitive analysis and opportunity discovery. -
Dark Kitchen Mapping
We created a location intelligence layer connecting delivery-only brands with operating addresses, shared facilities, service zones, and nearby competitors. Through Cloud & Dark Kitchen Tracking, the client could identify kitchen clusters, uncover overlapping virtual brands, and understand market density across targeted territories. -
Competitive Discovery Engine
We implemented recurring data collection and entity-matching workflows to identify new brands, menu changes, pricing movements, promotions, and emerging concepts. Historical snapshots enabled the client to compare market evolution, detect whitespace opportunities, and continuously evaluate cloud kitchen performance against competitors.
Solution Performance Snapshot
| Metric | Before Solution | After Solution | Improvement | Records Processed | Markets Covered | Brands Identified | Kitchen Locations | Update Frequency |
|---|---|---|---|---|---|---|---|---|
| Restaurant Listings | 18,500 | 42,800 | 131% | 42,800 | 12 | 8,450 | 3,180 | Weekly |
| Menu Records | 76,000 | 185,000 | 143% | 185,000 | 12 | 8,450 | 3,180 | Daily |
| Price Points | 31,200 | 96,500 | 209% | 96,500 | 12 | 8,450 | 3,180 | Daily |
| Virtual Brands | 1,150 | 4,620 | 301% | 4,620 | 12 | 4,620 | 2,740 | Weekly |
| Kitchen Locations | 680 | 3,180 | 368% | 3,180 | 12 | 8,450 | 3,180 | Monthly |
| Cuisine Categories | 42 | 118 | 181% | 118 | 12 | 8,450 | 3,180 | Weekly |
| Promotional Records | 8,900 | 27,600 | 210% | 27,600 | 12 | 8,450 | 3,180 | Daily |
| Rating Records | 22,400 | 74,300 | 232% | 74,300 | 12 | 8,450 | 3,180 | Weekly |
| Delivery Zones | 1,800 | 6,250 | 247% | 6,250 | 12 | 8,450 | 3,180 | Weekly |
Methodologies Used
-
Marketplace Discovery
We systematically collected restaurant and virtual brand information from multiple delivery marketplaces, capturing listings, menus, pricing, ratings, cuisines, promotions, service areas, and operating details. This created a broad dataset for identifying emerging concepts, competitor movements, and market opportunities across targeted locations. -
Entity Resolution
We matched brands appearing under different names, menu structures, or marketplace listings to identify related operations. Name normalization, menu similarity, location matching, and attribute comparison helped distinguish unique businesses from duplicate listings, shared facilities, and connected virtual restaurant concepts. -
Geographic Intelligence
We analyzed restaurant coordinates, delivery zones, neighborhood coverage, and proximity patterns to understand kitchen distribution. Geographic clustering helped reveal concentrated operating areas, underserved territories, competitive hotspots, and potential expansion locations while providing a clearer picture of the local delivery ecosystem. -
Historical Monitoring
We maintained recurring snapshots of marketplace information to track changes over time. Comparing historical and current records helped identify newly launched brands, discontinued concepts, menu modifications, price movements, promotional changes, rating shifts, and evolving competitive strategies across monitored markets. -
Data Validation
We applied automated validation and quality checks to improve dataset consistency and reliability. Missing values, duplicate records, inconsistent categories, abnormal pricing, outdated listings, and location discrepancies were systematically reviewed, corrected, and standardized before the information was delivered for analysis.
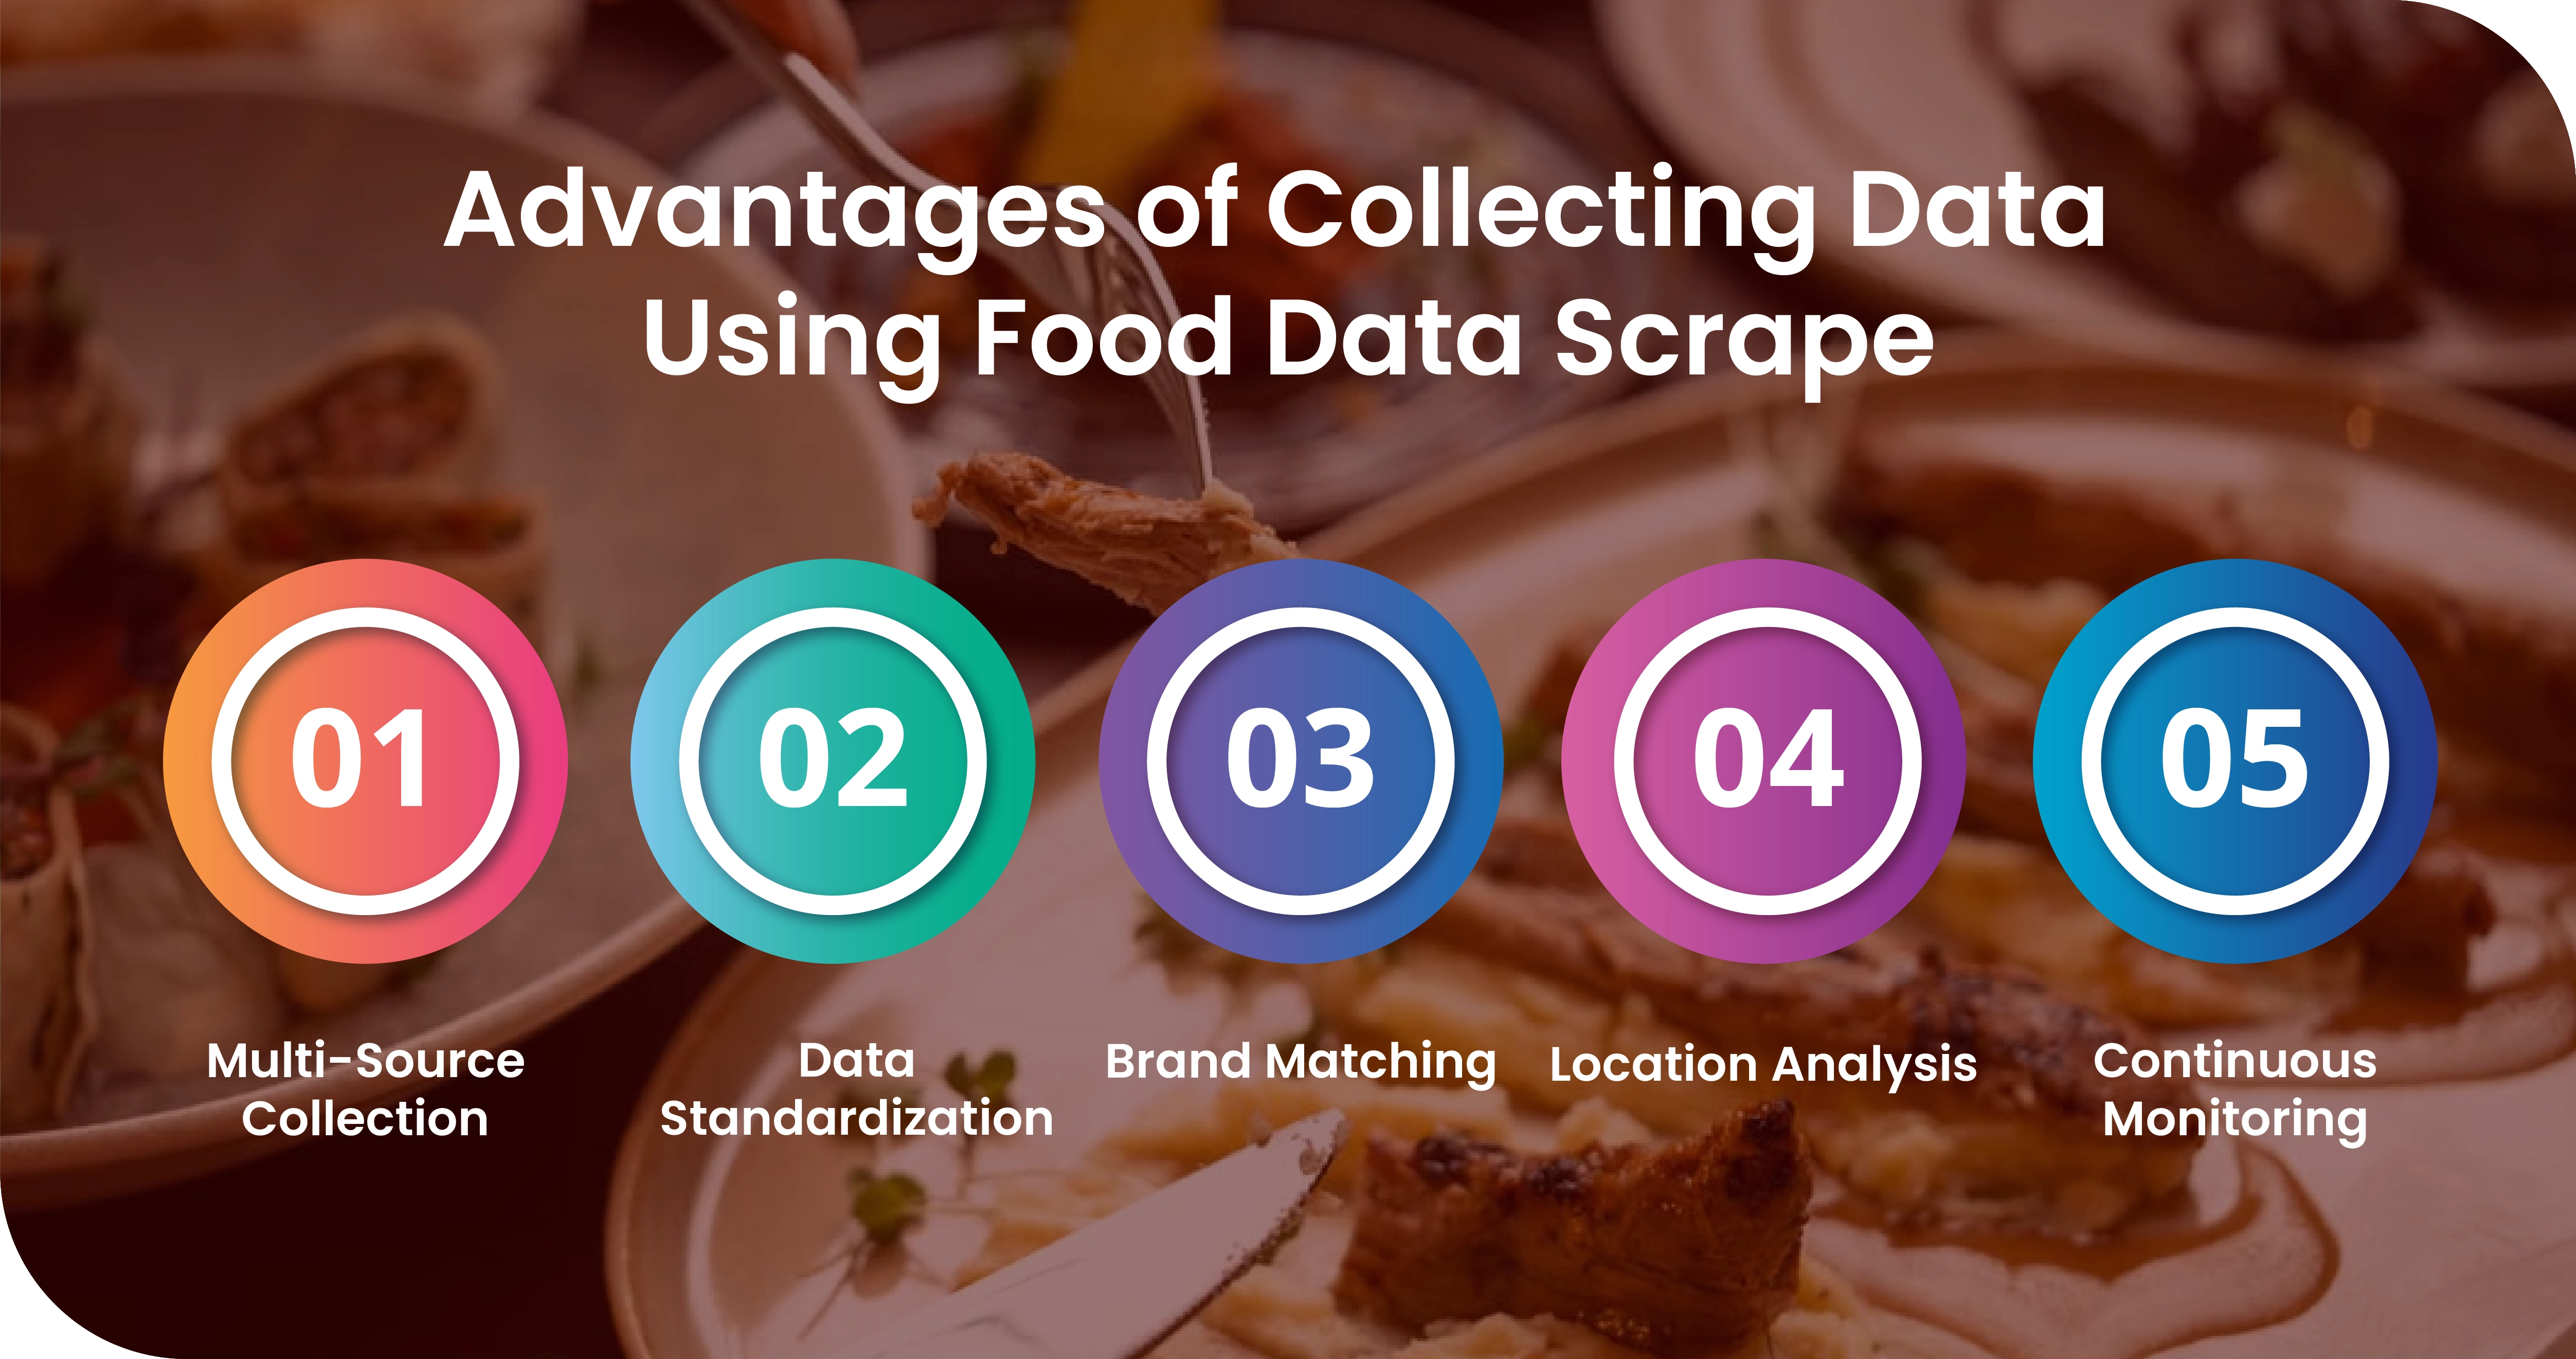
Advantages of Collecting Data Using Food Data Scrape
-
Multi-Source Collection
We gathered restaurant, menu, pricing, rating, promotion, cuisine, location, and delivery information from multiple digital marketplaces. Combining several sources provided broader market coverage and reduced dependence on any single platform, creating a richer foundation for competitive analysis and opportunity identification. -
Data Standardization
Collected records were cleaned and standardized using consistent naming structures, categories, location formats, pricing fields, and brand identifiers. This methodology reduced inconsistencies across sources and created comparable datasets that could be analyzed efficiently across different markets, platforms, and restaurant concepts. -
Brand Matching
We used attribute-based matching to connect related restaurant listings appearing under different names or marketplace profiles. Menu similarities, addresses, cuisine types, operating patterns, and other identifiers helped distinguish independent businesses from duplicate listings, affiliated concepts, and shared operations. -
Location Analysis
Geographic information was analyzed to understand restaurant distribution, service coverage, kitchen concentration, competitive density, and underserved areas. Mapping locations against delivery zones and nearby competitors helped identify regional patterns, potential expansion opportunities, operational clusters, and areas with limited concept penetration. -
Continuous Monitoring
Recurring collection cycles captured marketplace changes and preserved historical snapshots for comparison. We monitored new listings, removed brands, menu updates, price changes, promotions, ratings, and availability patterns, enabling timely identification of market movements and supporting more informed strategic decisions.
Client's Testimonial
"The project gave us visibility into a part of the food delivery market that was previously difficult to measure. We gained a clearer understanding of virtual brand activity, kitchen clusters, menu positioning, pricing behavior, and competitive gaps across multiple markets. The structured data made it easier for our analysts to identify emerging concepts and evaluate expansion opportunities without relying on fragmented manual research. We particularly valued the consistency of the data and the ability to compare marketplace activity over time. The solution has become a valuable input for our market research, competitor analysis, and strategic planning. It helped our team move from assumptions toward evidence-based decisions and significantly reduced the time required to investigate new cloud kitchen opportunities."
—Head of Business Strategy & Analytics
Final Outcome
The project delivered a centralized and actionable view of the rapidly evolving cloud kitchen ecosystem. The client gained structured visibility into virtual restaurant brands, menus, pricing, ratings, promotions, delivery coverage, and operating locations across multiple marketplaces. Consolidated datasets made competitor comparisons faster while historical records helped reveal changes in brand activity, pricing strategies, and market positioning. The solution also improved the identification of shared kitchen locations, emerging concepts, and underserved geographic areas. Analysts could evaluate competitive density, discover potential market gaps, and prioritize expansion opportunities using consistent data rather than fragmented manual research. Automated collection and validation reduced repetitive research efforts while improving data reliability. Overall, the project strengthened market intelligence capabilities, accelerated strategic analysis, and enabled the client to make more confident, evidence-based decisions for future cloud kitchen investments and expansion.



