
About The Client
The client is a rapidly expanding restaurant enterprise operating multiple brands across several metropolitan markets. Their business depends on maintaining fast deliveries, competitive pricing, and consistent customer experiences across leading food aggregators. As the company expanded into new regions, monitoring delivery performance manually became increasingly difficult. They required advanced restaurant delivery performance analytics to evaluate service quality, compare competitor delivery times, and monitor operational efficiency across hundreds of restaurant locations. The client also wanted an enterprise food delivery intelligence solution capable of collecting structured delivery information from multiple food ordering platforms in near real time. Their long-term objective was to build delivery speed intelligence for restaurant chains that would support strategic planning, staffing optimization, promotional campaigns, and customer retention initiatives. By leveraging large-scale delivery benchmarking and automated analytics, the client aimed to improve delivery reliability, increase customer satisfaction, optimize operational costs, and strengthen their competitive position within the rapidly evolving food delivery marketplace.
Key Challenges
-
Cross-Platform ETA Variations
Different food aggregators displayed inconsistent delivery estimates, making delivery ETA analytics across aggregators difficult. The client lacked standardized benchmarks for comparing delivery performance, resulting in inconsistent operational decisions, unreliable performance reporting, delayed improvements, and reduced customer satisfaction across multiple restaurant brands. -
Large-Scale Delivery Data Collection
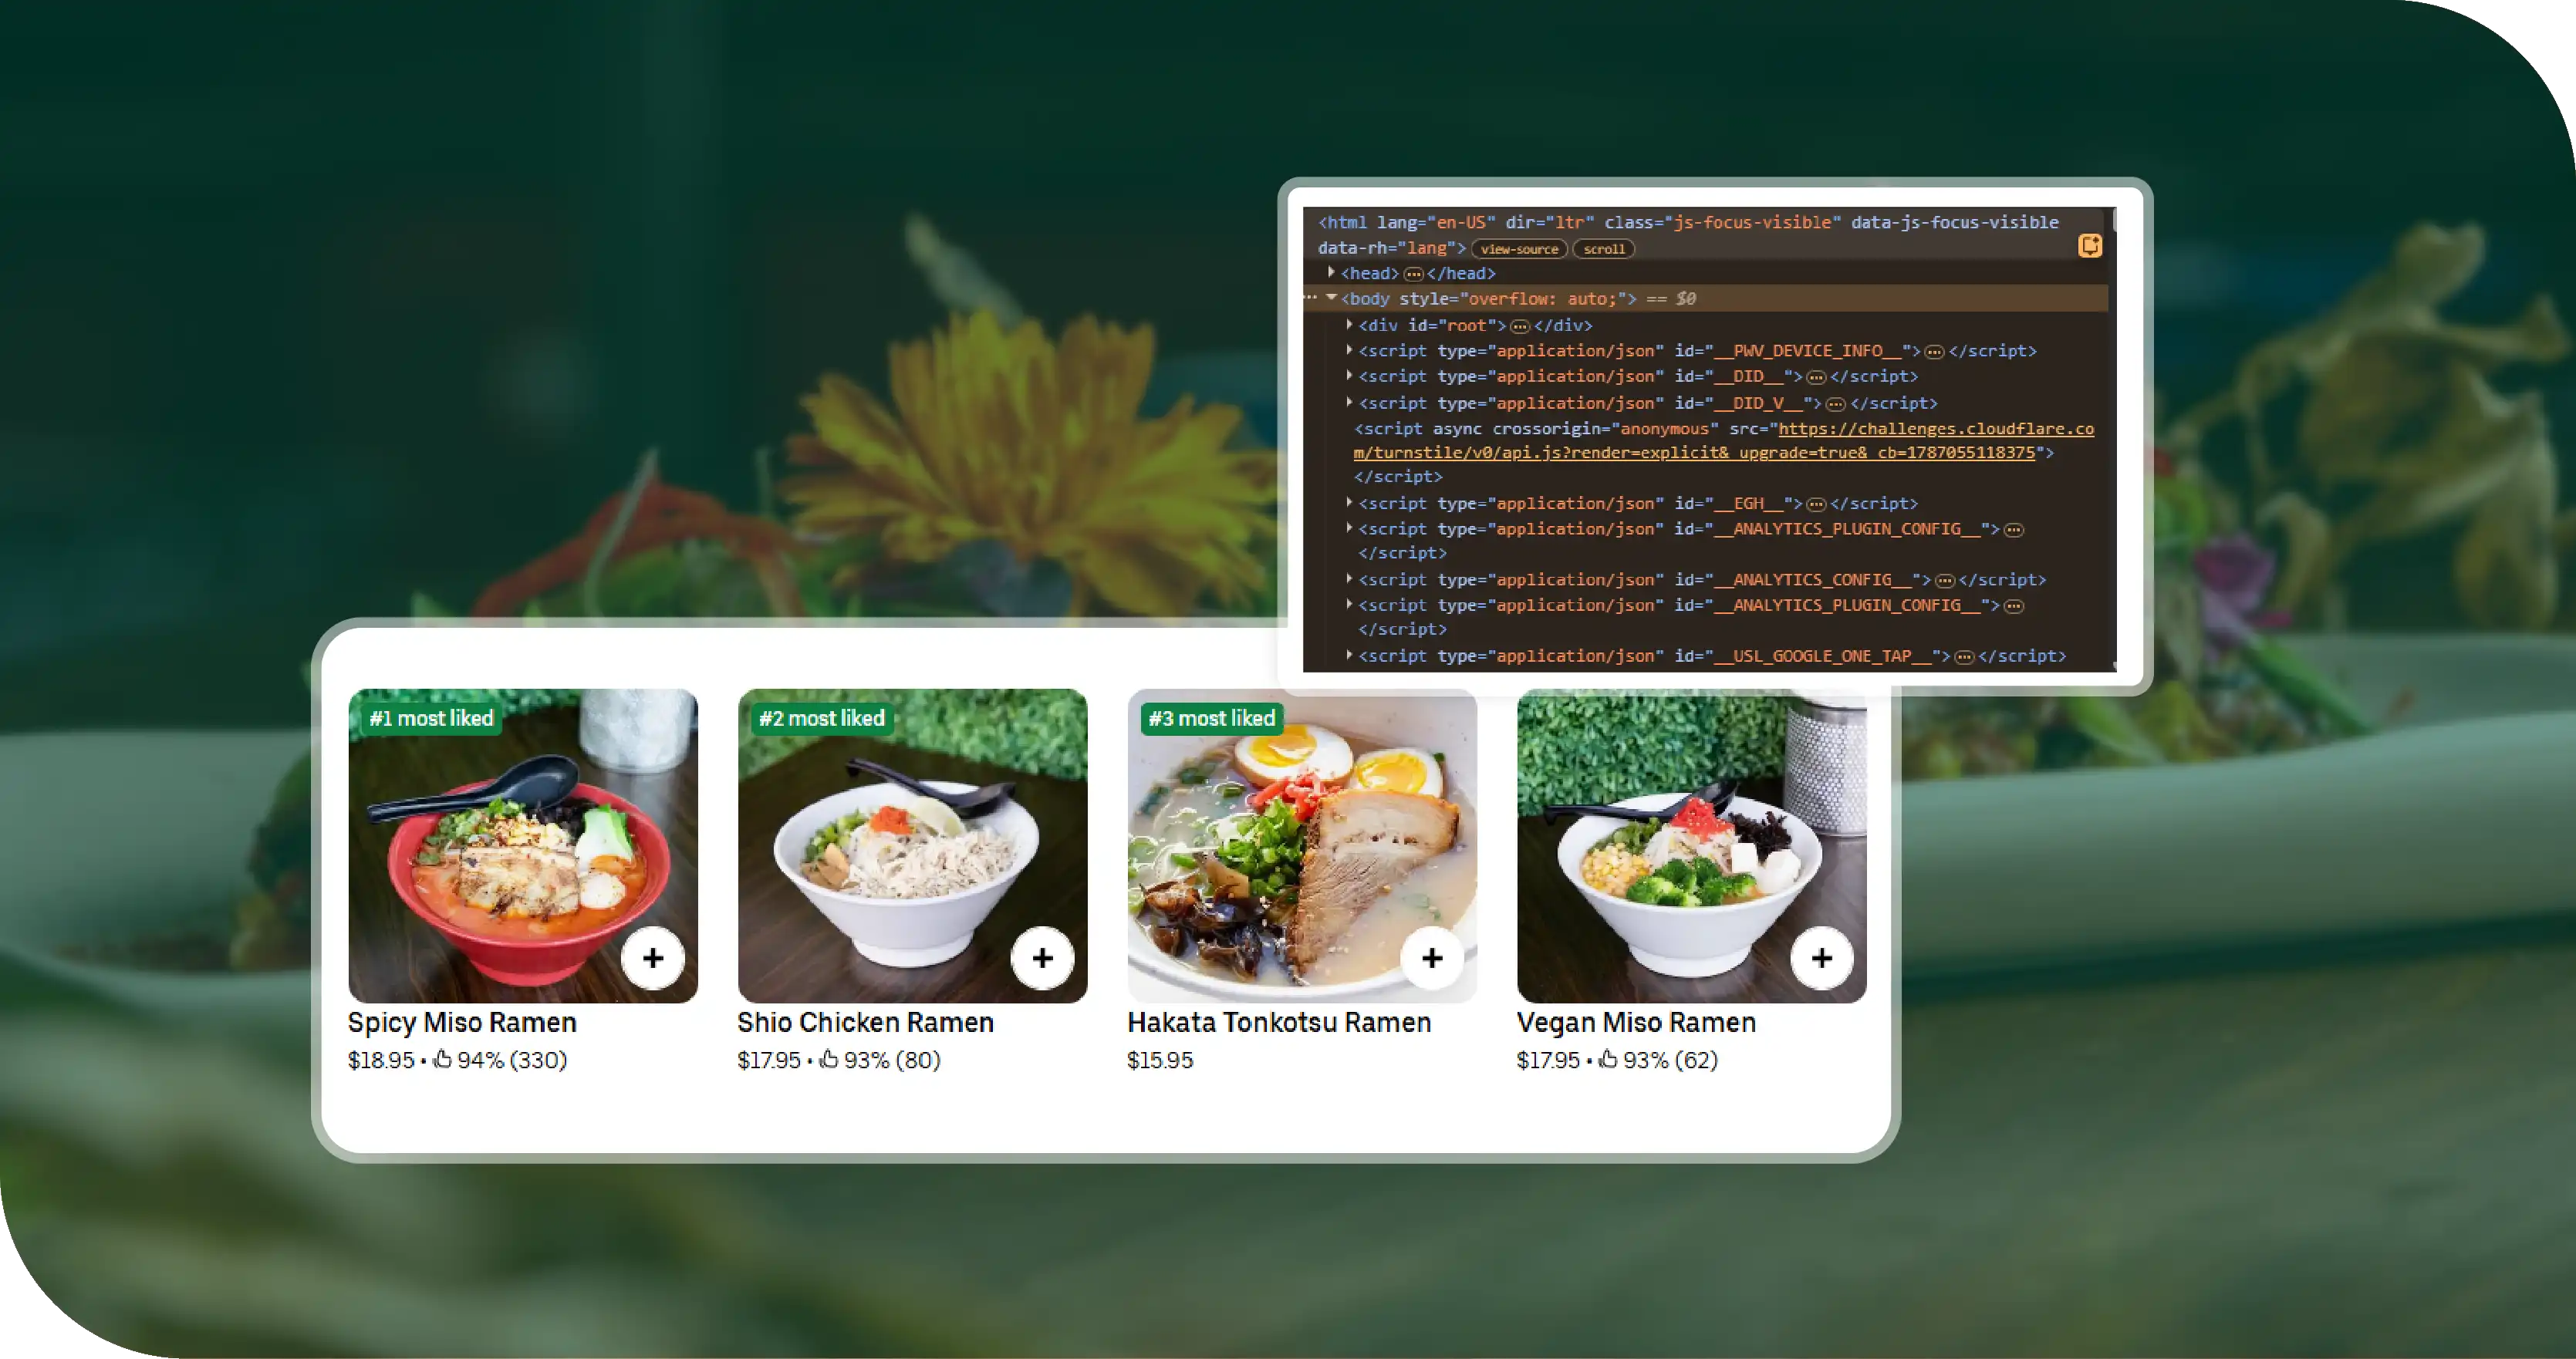
Performing Food Aggregator Data Scraping across hundreds of restaurants and thousands of menu listings required overcoming anti-bot protections, dynamic content rendering, regional availability differences, and continuously changing delivery estimates while maintaining reliable, accurate, and scalable data collection. -
Complex Restaurant Intelligence
The client needed continuous Web Scraping Food Delivery Data from multiple delivery platforms while tracking delivery times, restaurant availability, customer ratings, pricing, operating hours, and geographic variations. Integrating this large volume of structured data into unified dashboards proved challenging.
Key Solutions
-
Automated Menu & Delivery Intelligence
We implemented automated Extract Restaurant Menu Data pipelines alongside delivery ETA collection, enabling the client to correlate menu availability, preparation time, pricing, and delivery performance within a single centralized intelligence platform. -
Real-Time API Integration
Our scalable Food Delivery Scraping API continuously collected delivery ETAs, restaurant status, pricing updates, customer ratings, order availability, and operational metrics from multiple food aggregators with automated scheduling and high-frequency updates. -
Unified Analytics Dashboard
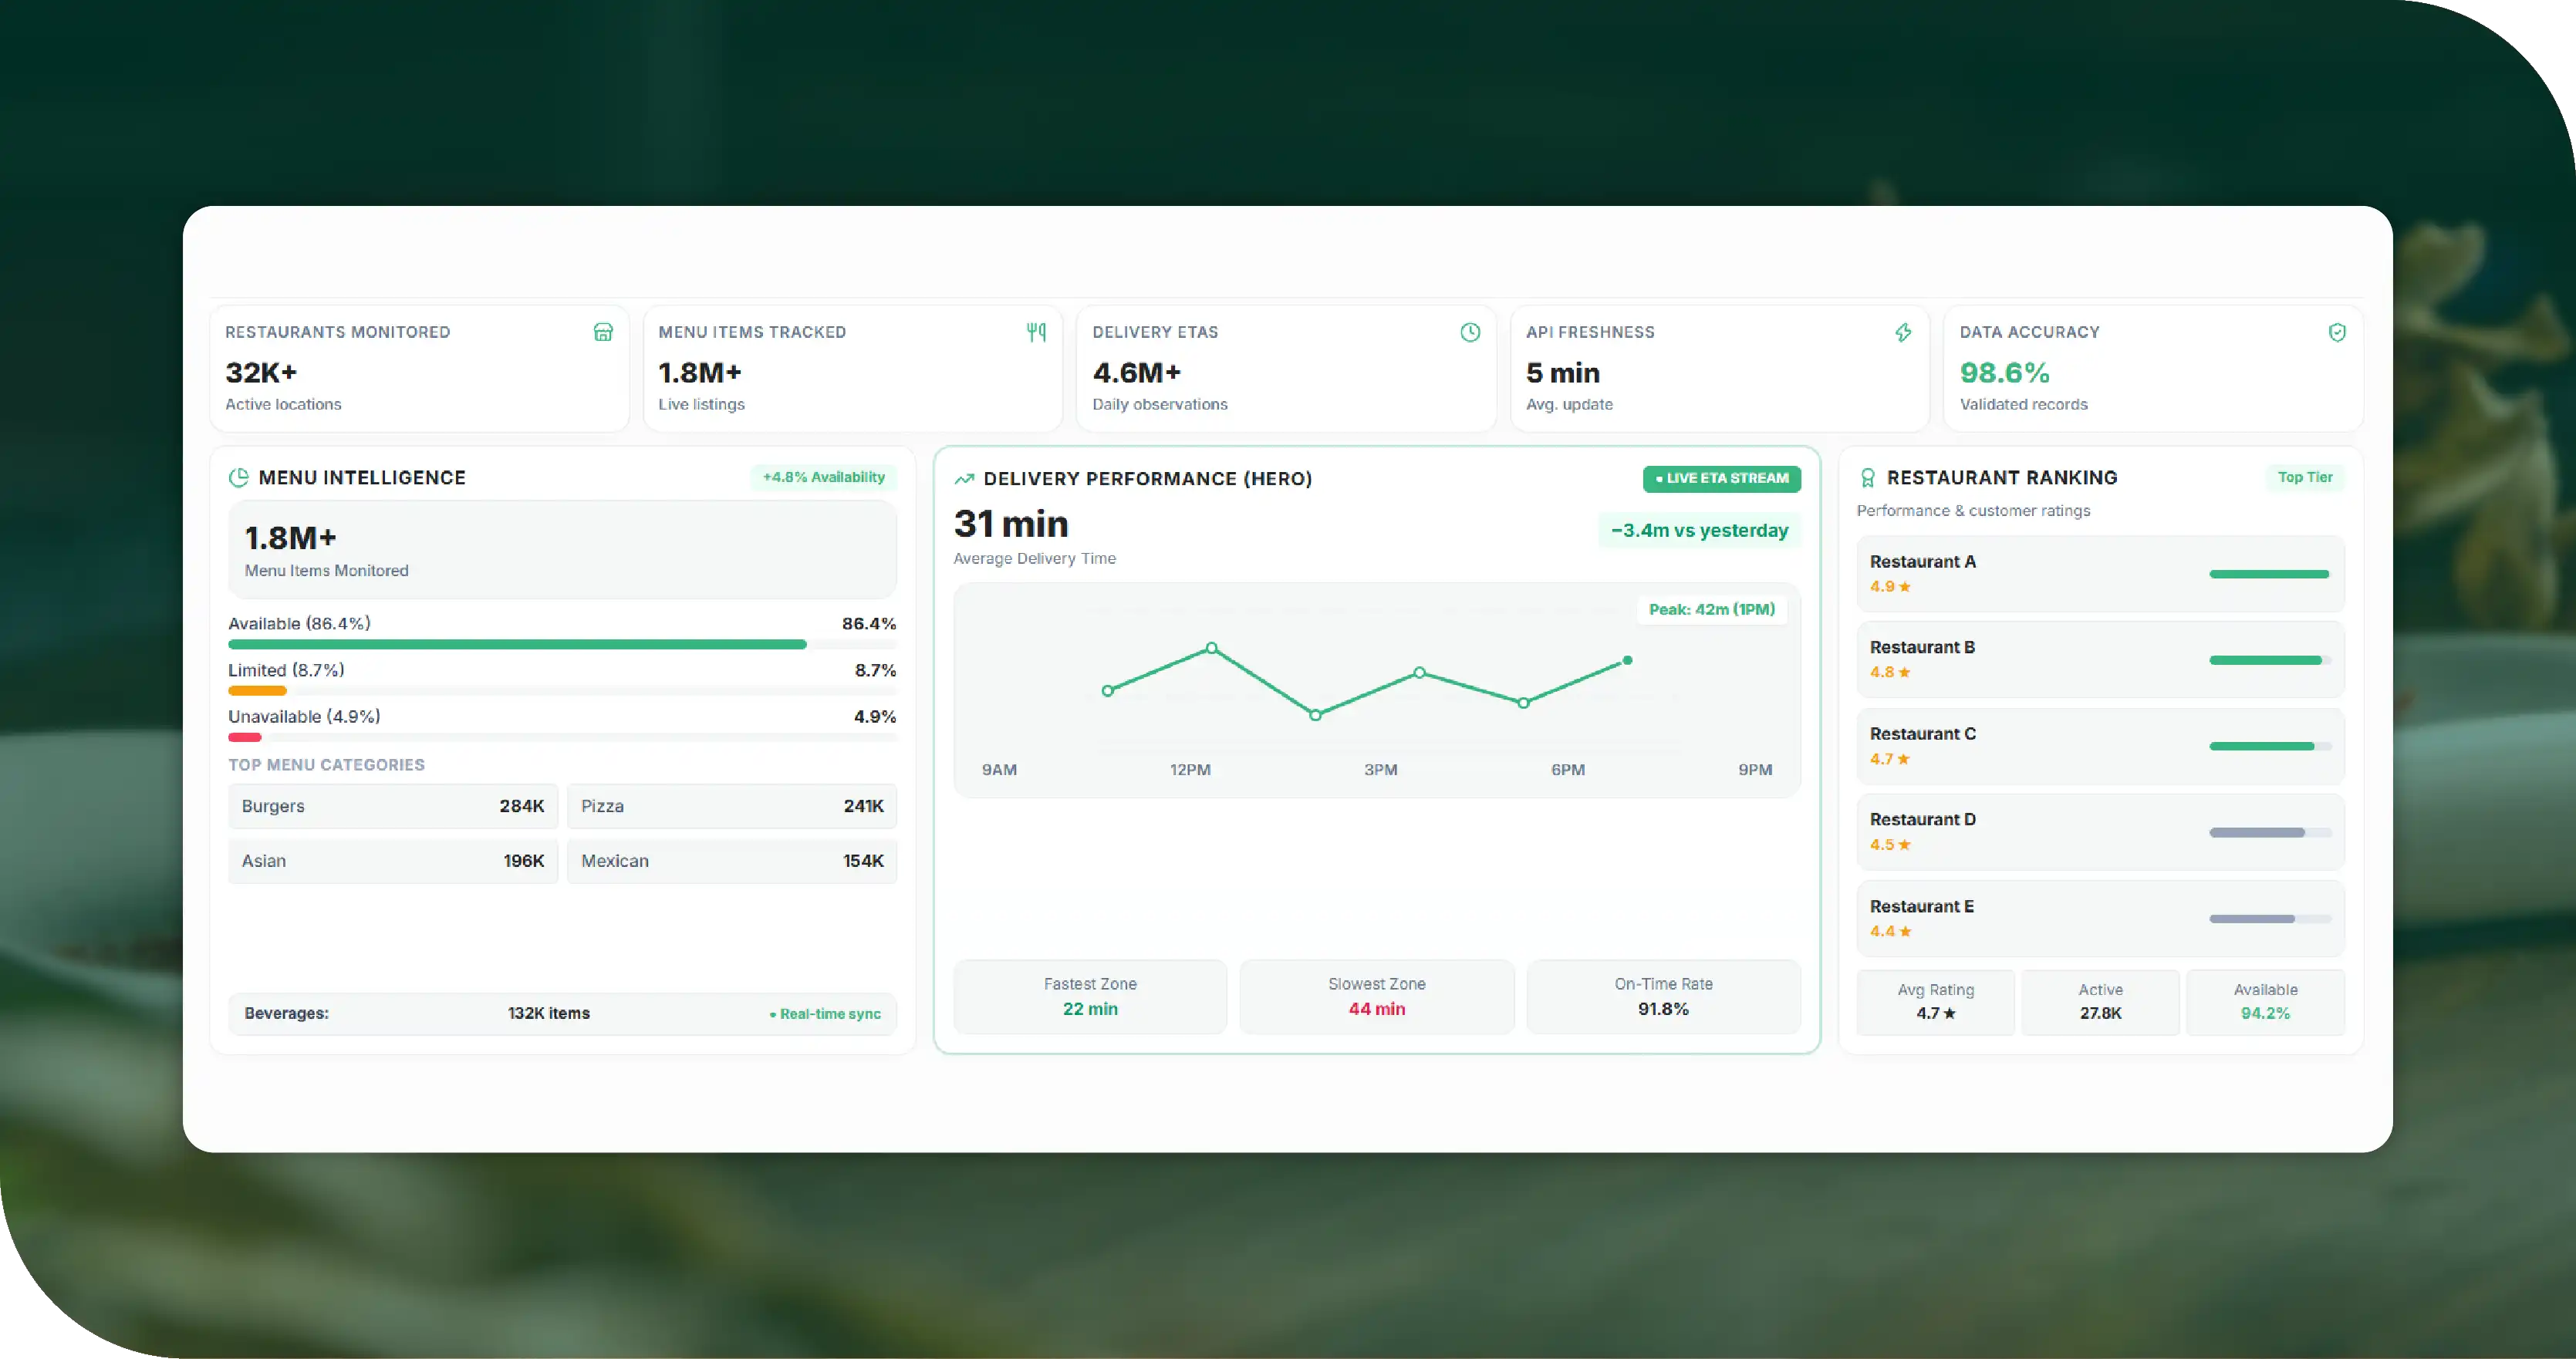
We developed an advanced Restaurant Data Intelligence platform that consolidated delivery performance, competitor comparisons, geographic analytics, historical delivery trends, restaurant rankings, and operational KPIs into interactive dashboards supporting strategic decision-making.
Delivery Data Collected
| Data Category | Uber Eats | DoorDash | Grubhub | Deliveroo | Zomato | Swiggy | Foodpanda | Talabat | Glovo | Just Eat | Total Records |
|---|---|---|---|---|---|---|---|---|---|---|---|
| Restaurants Tracked | 8,200 | 7,900 | 5,400 | 4,800 | 7,300 | 6,900 | 5,600 | 4,700 | 4,100 | 3,700 | 58,600 |
| Delivery ETA Records | 3,250,000 | 3,180,000 | 2,050,000 | 1,920,000 | 2,480,000 | 2,300,000 | 1,980,000 | 1,520,000 | 1,420,000 | 1,350,000 | 21,450,000 |
| Actual Delivery Records | 2,650,000 | 2,540,000 | 1,600,000 | 1,480,000 | 1,920,000 | 1,860,000 | 1,510,000 | 1,190,000 | 1,100,000 | 1,050,000 | 16,900,000 |
| Menu Items Scraped | 1,620,000 | 1,480,000 | 890,000 | 820,000 | 1,250,000 | 1,180,000 | 980,000 | 640,000 | 540,000 | 450,000 | 9,850,000 |
| Customer Ratings | 5,400,000 | 5,100,000 | 3,150,000 | 2,980,000 | 4,100,000 | 3,950,000 | 3,200,000 | 2,340,000 | 2,060,000 | 1,920,000 | 34,200,000 |
| Restaurant Reviews | 2,400,000 | 2,280,000 | 1,350,000 | 1,260,000 | 1,900,000 | 1,760,000 | 1,520,000 | 1,050,000 | 980,000 | 900,000 | 15,400,000 |
| Price Records | 4,120,000 | 4,000,000 | 2,500,000 | 2,300,000 | 3,350,000 | 3,150,000 | 2,700,000 | 2,050,000 | 1,900,000 | 1,730,000 | 27,800,000 |
| Delivery Fee Records | 1,950,000 | 1,900,000 | 1,180,000 | 1,100,000 | 1,450,000 | 1,380,000 | 1,100,000 | 700,000 | 560,000 | 480,000 | 11,800,000 |
| Surge Pricing Records | 1,420,000 | 1,350,000 | 760,000 | 720,000 | 980,000 | 910,000 | 810,000 | 620,000 | 480,000 | 400,000 | 8,450,000 |
| Competitor ETA Comparisons | 2,100,000 | 2,020,000 | 1,250,000 | 1,180,000 | 1,550,000 | 1,480,000 | 1,200,000 | 1,020,000 | 1,000,000 | 1,100,000 | 13,900,000 |
Methodologies Used
-
Automated Multi-Platform Crawling
We deployed scalable crawlers that continuously collected delivery estimates, restaurant listings, pricing information, menu availability, ratings, and operational metrics across multiple food delivery platforms while ensuring consistent data quality and minimal collection interruptions. -
Intelligent Proxy Rotation
Advanced proxy management, browser automation, and request scheduling minimized blocking risks while enabling uninterrupted large-scale collection from geographically distributed food delivery platforms with high success rates. -
Data Validation Pipeline
Every collected dataset passed through automated validation, duplicate removal, normalization, quality scoring, and consistency verification to ensure accurate benchmarking and dependable business intelligence for enterprise decision-making. -
Geographic Performance Benchmarking
We compared delivery performance across cities, neighborhoods, restaurant categories, and competitors using standardized benchmarking models that enabled meaningful regional performance analysis and operational optimization. -
Business Intelligence Dashboard
Collected information was transformed into interactive dashboards featuring delivery trends, ETA comparisons, historical analytics, alerts, restaurant rankings, operational KPIs, and downloadable reports for executive teams.
Advantages of Collecting Data Using Food Data Scrape
-
Real-Time Delivery Visibility
Businesses receive continuously updated delivery intelligence that improves operational monitoring, identifies delays early, supports proactive decision-making, and enhances customer satisfaction through accurate delivery performance tracking. -
Competitive Benchmarking
Organizations compare delivery speed, restaurant availability, pricing strategies, and operational efficiency across multiple competitors to identify market opportunities and improve service quality. -
Better Operational Planning
Accurate delivery intelligence helps optimize staffing, kitchen workflows, delivery partner allocation, promotional campaigns, and regional expansion strategies while reducing operational costs. -
Scalable Enterprise Intelligence
Our automated infrastructure collects millions of delivery records daily while maintaining high reliability, enabling organizations to scale data-driven decision-making across thousands of restaurant locations. -
Faster Strategic Decisions
Interactive dashboards, automated reporting, and historical analytics allow executives to identify performance gaps quickly, monitor trends, improve delivery operations, and increase customer retention.
Client's Testimonial
"Food Data Scrape transformed our delivery intelligence strategy by providing accurate, real-time visibility into delivery performance across multiple food aggregators. Their automated platform delivered reliable analytics that helped us benchmark competitors, optimize delivery operations, and improve customer satisfaction. The dashboards provided actionable insights that significantly reduced reporting time while supporting better operational decisions across all our restaurant brands. Their technical expertise, responsiveness, and scalable data infrastructure exceeded our expectations, making them an invaluable long-term technology partner for our business growth."
— Director of Digital Operations
Final Outcome
The implemented delivery benchmarking platform significantly improved the client's operational visibility by providing reliable insights into delivery speed, restaurant availability, pricing trends, and competitor performance. Executives gained centralized dashboards that supported faster business decisions, optimized staffing strategies, and enhanced customer satisfaction across multiple markets. The integrated Food Price Dashboard enabled teams to monitor pricing movements alongside delivery performance, creating a complete competitive intelligence ecosystem. Additionally, continuously updated Food Datasets provided historical benchmarks for forecasting, operational planning, and market expansion initiatives. The client reduced manual reporting efforts, improved delivery consistency, identified underperforming locations, strengthened competitor benchmarking capabilities, and established a scalable data intelligence infrastructure that continues to support strategic growth, operational excellence, and long-term competitive advantage across diverse restaurant brands.



