

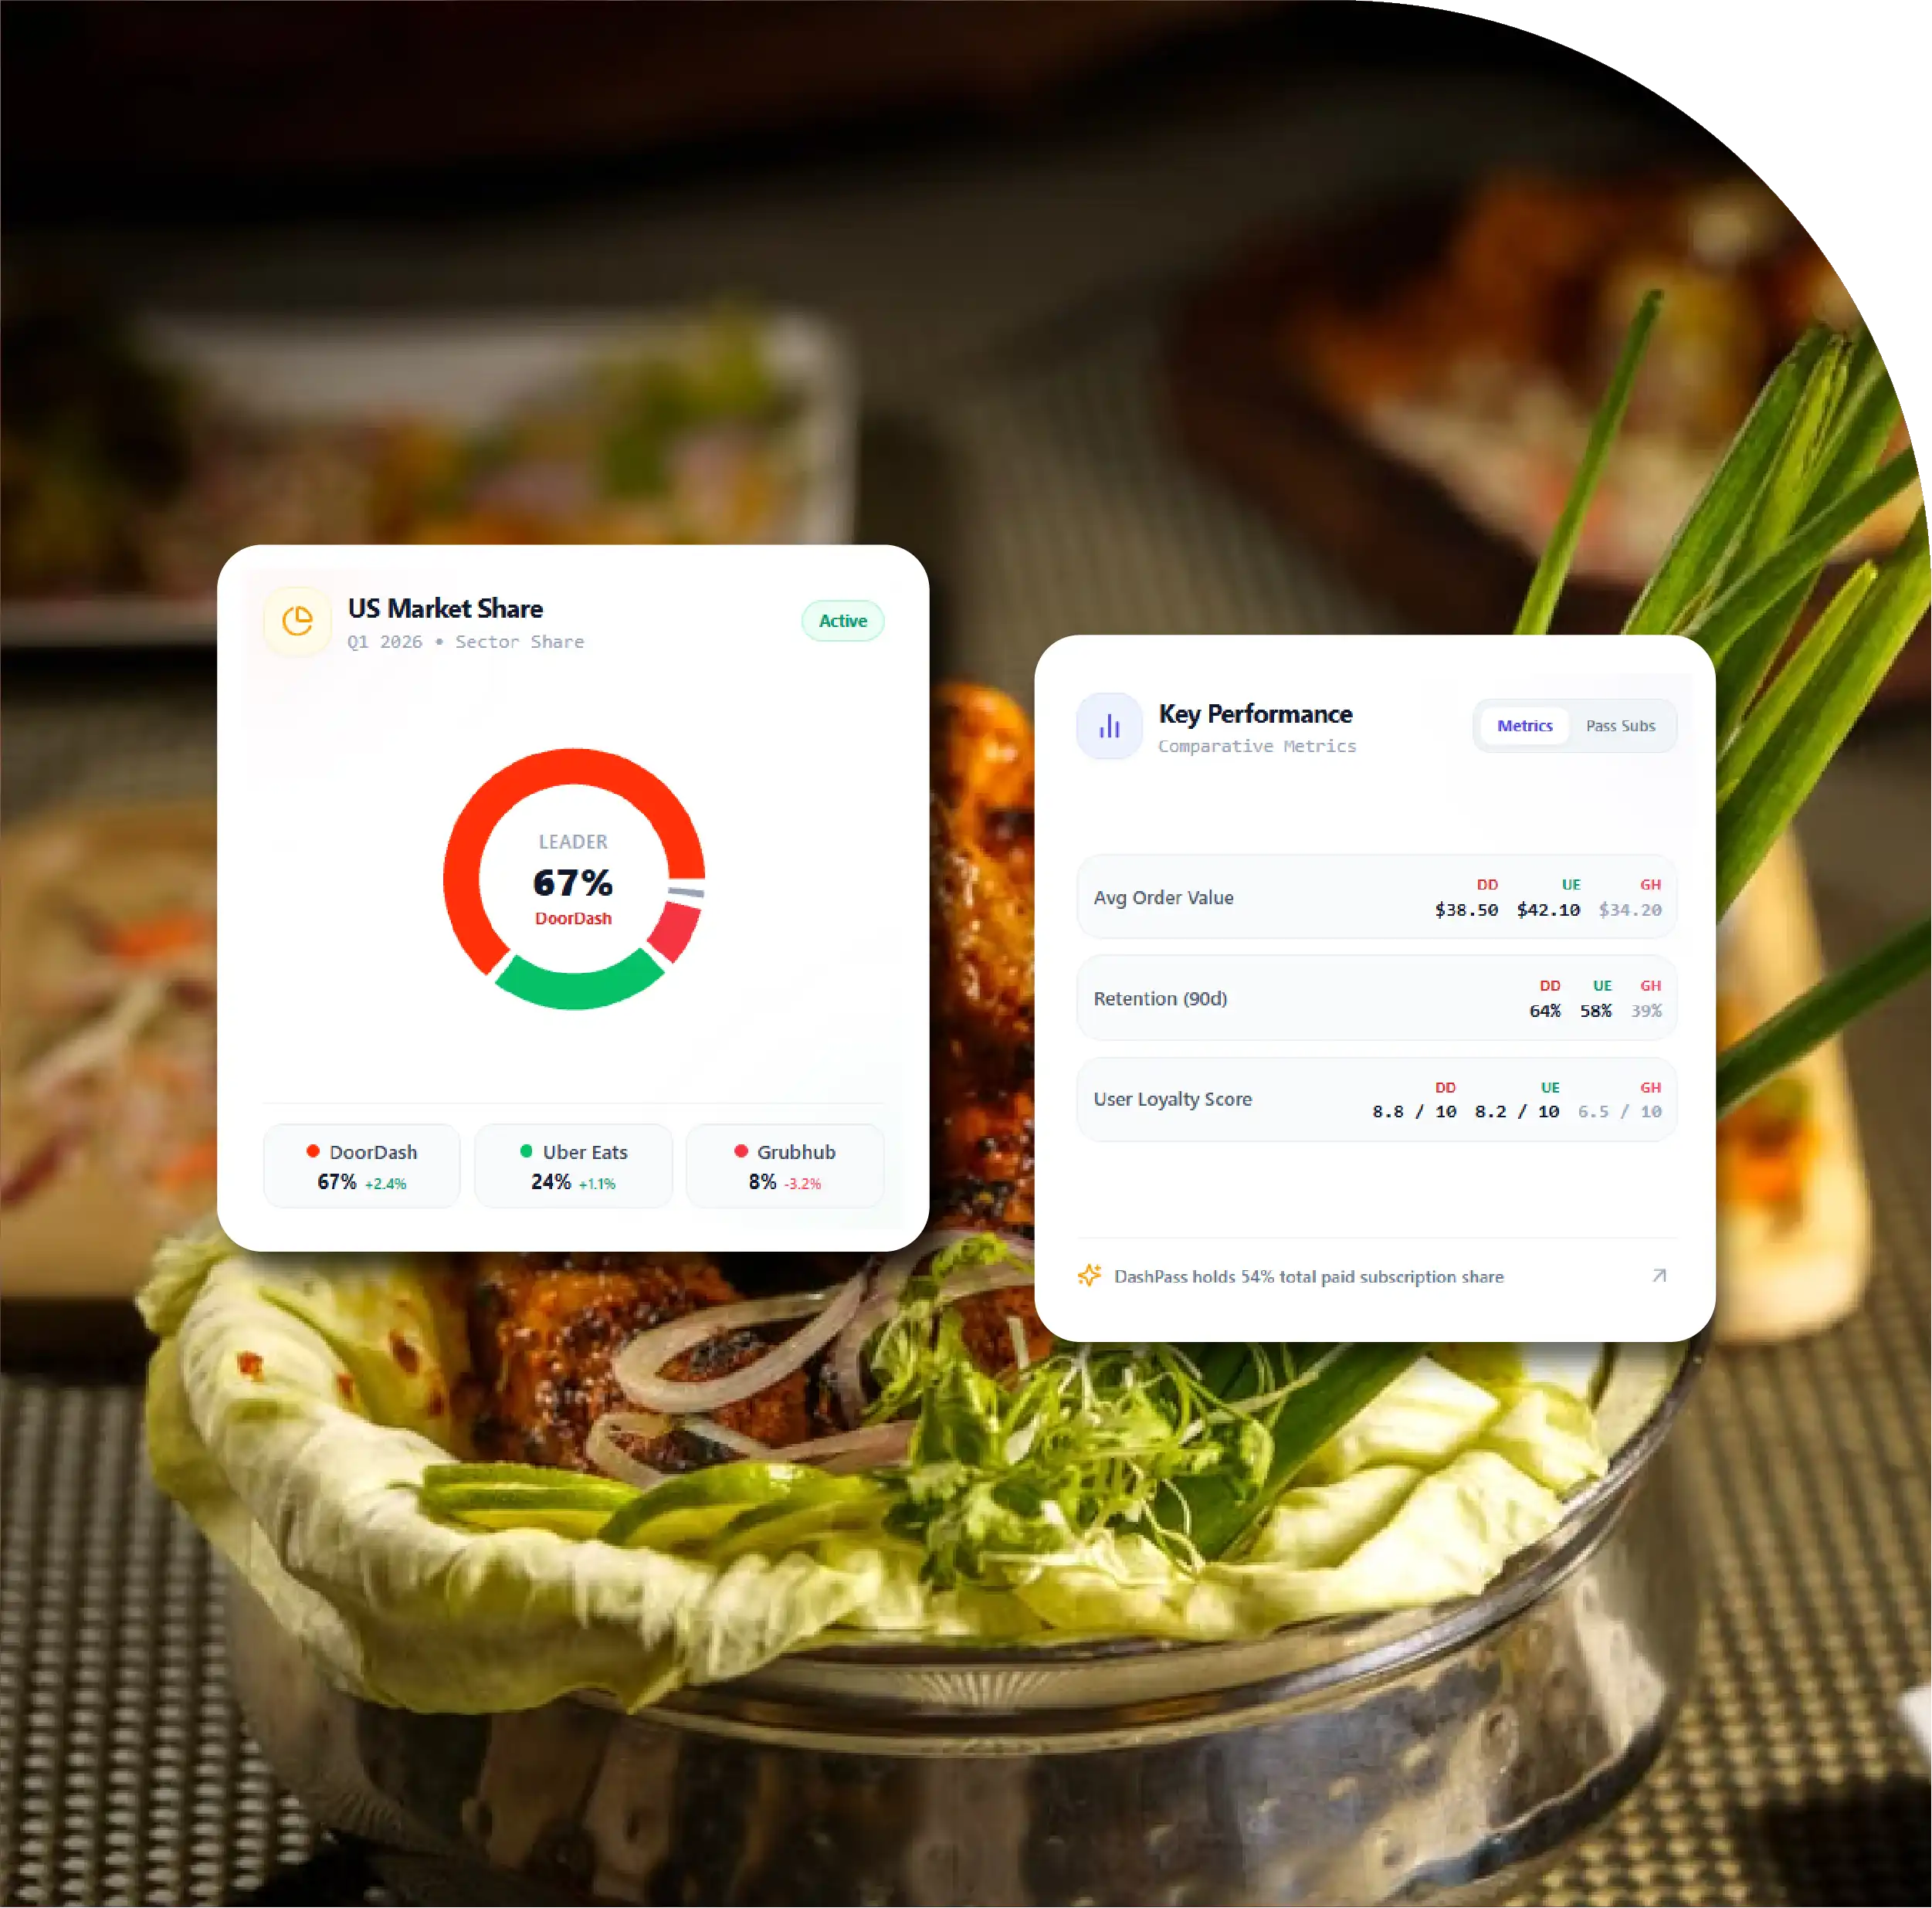
DoorDash Leads US Delivery Sales: Third-party estimates put its share at 60.7% at the end of 2024, ahead of Uber Eats at 26.1% and Grubhub at 6.3%.
City-Level Competition: DoorDash and Uber Eats had nearly equal estimated delivery sales shares in the New York City area and Los Angeles.
Memberships Influence Customer Costs: DashPass, Uber One and Grubhub+ list monthly plans at $9.99, subject to eligibility and offer conditions.
Restaurant Commissions Affect Pricing: Published delivery commission tiers vary across platforms, influencing restaurant costs and potential menu price differences.

US food delivery in 2026 is led by DoorDash, with Uber Eats a strong second and Grubhub, now owned by Wonder, a smaller third. Third-party card data put DoorDash near 61% of US delivery sales at the end of 2024. Prices, fees and coverage differ by city, so comparing the apps needs structured, regularly refreshed menu and fee data.
This report brings together the latest public facts on the three apps. It covers company results, third-party share estimates, consumer fees, subscriptions and city rules such as New York City's delivery worker minimum pay. Every figure is cited in the Sources list, and estimates are labelled as estimates.
We also show how Food Data Scrape structures menus, prices, fees and availability from public listings on DoorDash, Uber Eats and Grubhub. This report does not publish counts from a live Food Data Scrape dataset; where a value depends on a collection run, the tables describe what that run would measure.
US food delivery began with order aggregators that passed online orders to restaurants with their own drivers. Grubhub and Seamless grew that way. DoorDash, Uber Eats and Postmates then built logistics networks that made almost any restaurant deliverable. Uber bought Postmates in 2020, according to Bloomberg Second Measure.
Ownership in US food delivery has changed again since. Just Eat Takeaway.com bought Grubhub for about $7 billion and sold it to Wonder, the food-hall group, for $650 million. Restaurant Dive reported the deal in November 2024. Nation's Restaurant News reported that Wonder completed the purchase in January 2025.
The scale of the leader keeps growing. DoorDash reported 970 million Total Orders and $33.1 billion of Marketplace GOV in Q2 2026. Part of that growth comes from Deliveroo, which DoorDash has included since 2 October 2025. Uber's Delivery segment reported $27.5 billion of gross bookings in the same quarter. Both figures are global, not US-only, so they show direction rather than US food delivery share.
| Period | Cited metric | Value | Source |
|---|---|---|---|
| 2020 | Grubhub purchase price paid by Just Eat Takeaway.com | about $7 billion | Restaurant Dive, Nov 2024 |
| FY 2023 | DoorDash Total Orders / Marketplace GOV (sum of quarters) | 2,161 million / $66.8 billion | DoorDash Q4 2023 release |
| FY 2024 | DoorDash Total Orders / Marketplace GOV (sum of quarters) | 2,583 million / $80.2 billion | DoorDash Q4 2024 release |
| Jan 2025 | Grubhub acquired by Wonder | $650 million | Nation's Restaurant News, Jan 2025 |
| FY 2025 | DoorDash Total Orders / Marketplace GOV (sum of quarters, incl. Deliveroo from Oct 2025) | 3,172 million / $102.0 billion | DoorDash Q4 2025 release |
| Q2 2026 | DoorDash Total Orders / Marketplace GOV (global) | 970 million (+27% Y/Y) / $33.1 billion (+36% Y/Y) | DoorDash Q2 2026 release |
| Q2 2026 | Uber Delivery gross bookings (global) | $27.5 billion (+26% Y/Y) | Uber Q2 2026 release |
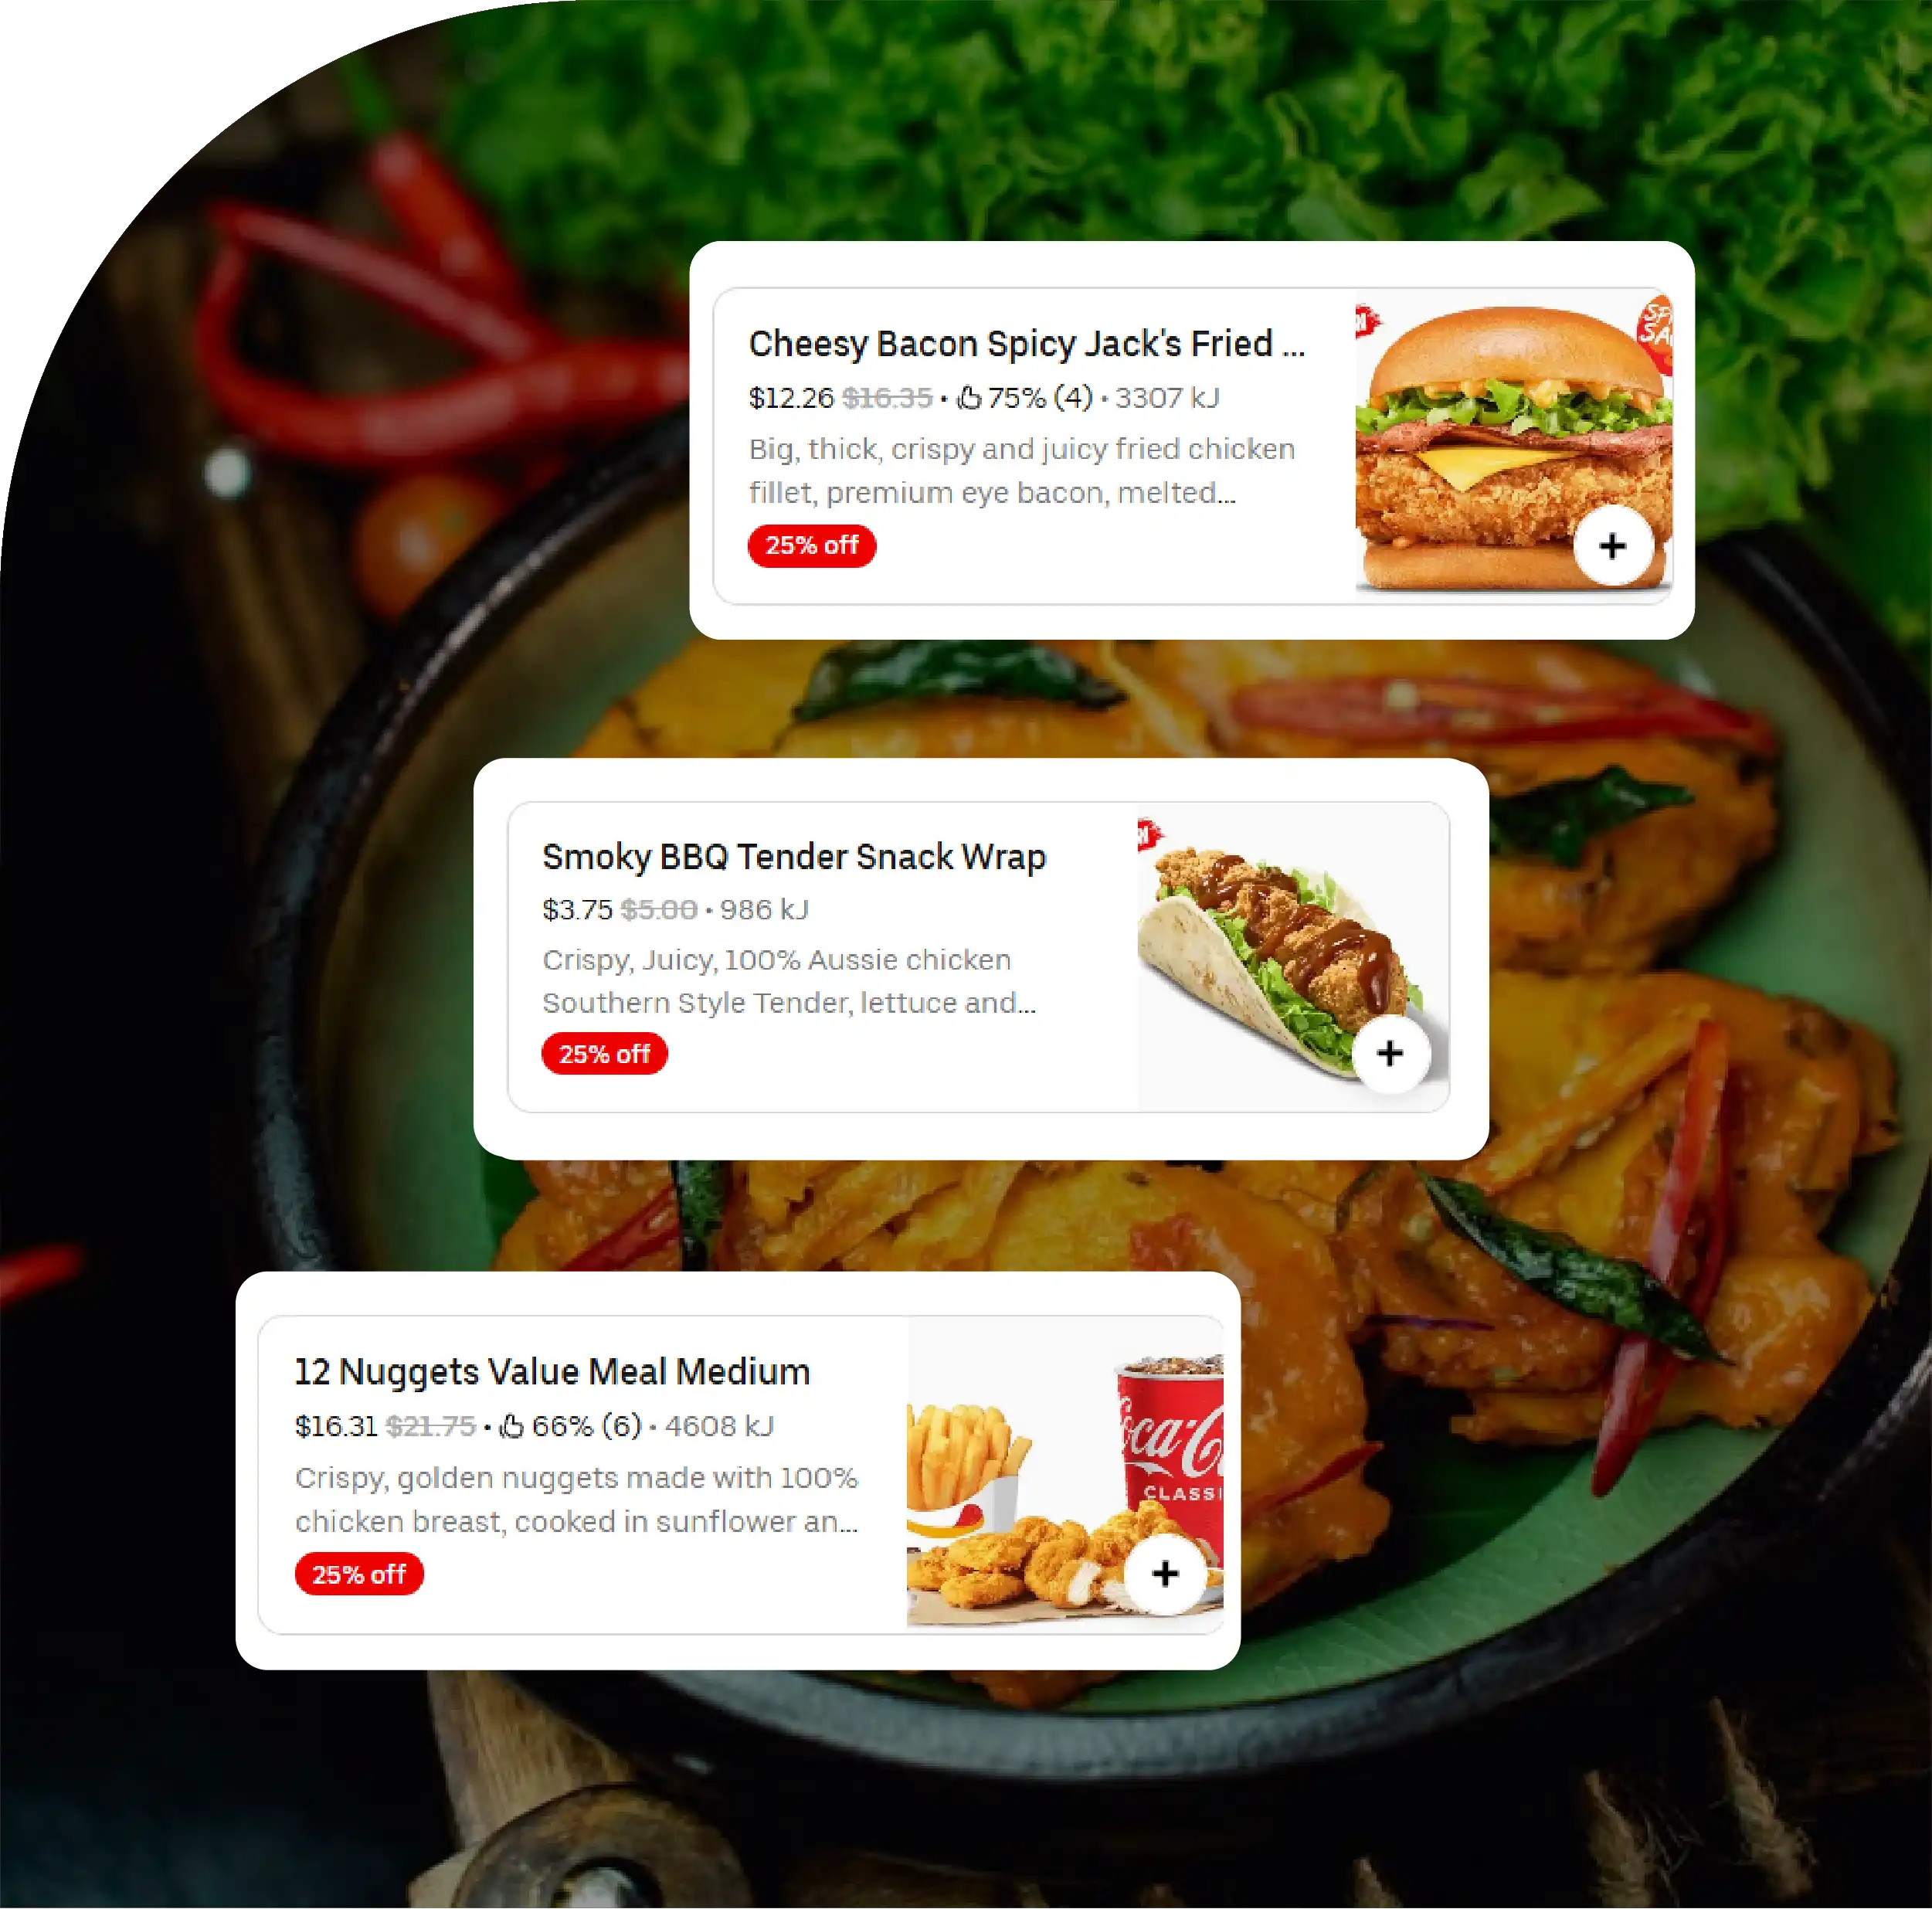
Each US food delivery app shows the same restaurant in a different way. Item names, modifiers, photos, category names and price formats vary. A burger may be a single item on one app and a combo with required sides on another. Without a common data model, any DoorDash vs Uber Eats vs Grubhub comparison mixes like with unlike.
We map every public listing to one schema. Restaurants are matched across apps by name, address and coordinates. Menu items are matched by normalised name, size and modifiers, and every record keeps the app, timestamp and delivery address used for the check.
Collection stays at public business-listing level. We respect robots.txt, each platform's terms of service and sensible rate limits. We never collect customer or courier personal data, and we never sign in to get past a login.
| Field | What it holds | Why it matters for US food delivery analysis |
|---|---|---|
| platform | DoorDash, Uber Eats or Grubhub | Keeps app-level comparisons clean |
| store_id_matched | Cross-app restaurant ID from name, address and geo match | Measures overlap and exclusives |
| item_name_normalised | Cleaned item name with size and pack count | Allows like-for-like price checks |
| menu_price | Listed item price before fees | Shows menu markups between apps |
| delivery_fee / service_fee | Fees shown at checkout for a test basket | Reveals the total cost to the customer |
| promo_label | Public offer text, e.g. buy-one-get-one or member discount | Tracks promotion intensity |
| eta_minutes | Displayed delivery time estimate | Compares service levels by ZIP code |
| is_available | Item or store open/closed or sold-out flag | Tracks availability and stockouts |
| captured_at / zip_code | Timestamp and delivery address area | Supports time series and local views |
In US food delivery, the menu price is only part of what a customer pays. DoorDash's help centre lists a delivery fee, a service fee, a small order fee, a long distance fee, an optional express fee, a weather impact fee and a regulatory response fee in some regions. It also says DoorDash began rolling out updated, variable service fees in many markets from late July 2026. In markets such as New York City, California and Seattle, the service fee is still typically 15% of subtotal.
All three US food delivery apps sell a membership that cuts these fees. Each lists a $9.99 monthly price on its official page, and benefits apply only to eligible orders above a subtotal minimum. Grubhub also offers Grubhub+ benefits to eligible Amazon Prime members in the US with no Grubhub+ membership fee.
| Plan | Listed price | Headline benefit (eligible orders) | Source |
|---|---|---|---|
| DashPass (DoorDash) | $9.99/month or $96/year | $0 delivery fees, reduced service fees | DoorDash help centre |
| Uber One (Uber Eats) | $9.99/month | $0 delivery fee, up to 10% off, reduced service fees | Uber One page |
| Grubhub+ (Grubhub) | $9.99/month; included for eligible Amazon Prime members | $0 delivery fees, lower service fees, 5% pickup credit | Grubhub pages |
Restaurants pay commission too, and that cost can feed through to menu prices. Each app lists tiered plans on its merchant pricing page. Tracking these list rates next to observed menu prices helps explain why the same dish can cost more on one app.
| App | Merchant plan tiers (delivery commission) | Source |
|---|---|---|
| DoorDash | Basic 15%, Plus 25%, Premier 30%; pickup 6% | DoorDash merchant pricing page |
| Uber Eats | Lite 20% (from 15% in some cities), Plus 25%, Premium 30% | Uber Eats merchant pricing page |
| Grubhub | Marketing commission Basic 5%, Plus 15%, Premium 20% (processing fees extra) | Grubhub pricing page |
Local rules change US food delivery fees and costs, so market data must be read city by city. New York City is the clearest example. Its Department of Consumer and Worker Protection (DCWP) sets a minimum pay rate for app-based restaurant delivery workers, before tips.
That rate rose to $22.13 per hour from the first pay period on or after 1 April 2026. Since 26 January 2026, grocery delivery apps must also pay a minimum rate. New York City also caps what apps may charge restaurants, as shown below.
| NYC rule | Current level | Source |
|---|---|---|
| Restaurant delivery worker minimum pay (before tips) | $19.56 (Apr 2024), $21.44 (Apr 2025), $22.13 (Apr 2026) per hour | NYC DCWP |
| Delivery fee cap charged to restaurants | 15% of purchase price | NYC DCWP |
| Basic service fee cap | 5% | NYC DCWP |
| Enhanced service fee cap | 20% | NYC DCWP |
| Transaction fee cap | 3% | NYC DCWP |
For analysts, these rules explain local fee lines such as DoorDash's regulatory response fee. They also explain why New York City is in DoorDash's list of markets on its older fee model. A US food delivery dataset should therefore record fees per ZIP code, not as a single national number.
US food delivery prices move for many reasons: menu updates, promotions, fee changes, weather and peak-hour demand. A one-off snapshot cannot separate these effects. A repeat collection on a fixed schedule, using the same test baskets and addresses, can.
A recent New York inquiry asked us for DoorDash pricing over a full quarter, which is a typical need. Quarterly series show whether menu markups are drifting, how often promotions run and when fees spike. Availability flags add a second view: which items sell out, and which stores go offline at peak times.
| Signal | How we capture it | Suggested cadence | Output per run |
|---|---|---|---|
| Menu price change | Same item, same store, same ZIP | Daily or weekly | Price history per item, store and ZIP code, with the change between runs |
| Cross-app menu markup | Matched item price on each app vs in-store or web menu | Weekly | Price gap per matched item between each app and the restaurant's own menu |
| Fee level by time of day | Test basket at lunch, dinner and late night | Several times a day | Delivery and service fee per test basket by app, ZIP code and time slot |
| Promotion frequency | Public promo labels per store | Daily | Count of stores showing a public promo label on each run, by app |
| Item or store availability | Sold-out and closed flags | Hourly at peak | Share of tracked items or stores marked sold out or closed at each check |
For a deeper look at fee spikes, see our page on real-time delivery fee and surge pricing intelligence. For a ten-city price comparison of two apps, see Uber Eats vs DoorDash real-time price monitoring.
Coverage is where the three US food delivery apps differ most at local level. Many chains list on all three. Many independents choose one or two apps, or sign exclusive deals. Grubhub brought Wonder about 375,000 merchants, according to Nation's Restaurant News, but merchant counts alone do not show how much of a city each app covers.
We measure US food delivery coverage from the delivery address outward. For each ZIP code we list every restaurant that delivers there on each app, match stores across apps and flag exclusives. The result shows true cross-platform overlap, metro by metro.
| Metro | Cited public context | What a coverage run counts |
|---|---|---|
| New York City | More than 23,000 neighbourhood restaurant and bar establishments citywide (NYS Comptroller, Jul 2026); third-party sales share near level for DoorDash and Uber Eats (Earnest, end of 2024) | Restaurants delivering to each ZIP code on DoorDash, Uber Eats and Grubhub; stores on all three; stores exclusive to one app |
| Los Angeles | Uber Eats 41.9% vs DoorDash 41.8% of delivery sales, third-party estimate (Earnest, end of 2024) | Restaurants delivering to each ZIP code on DoorDash, Uber Eats and Grubhub; stores on all three; stores exclusive to one app |
| Chicago | No city-level public share estimate found today | Restaurants delivering to each ZIP code on DoorDash, Uber Eats and Grubhub; stores on all three; stores exclusive to one app |
| Houston | No city-level public share estimate found today | Restaurants delivering to each ZIP code on DoorDash, Uber Eats and Grubhub; stores on all three; stores exclusive to one app |
The table gives cited public context only. Restaurant counts per app, overlap and exclusives are not shown because we have no published dataset figures for them; they are counted fresh on each collection run for the metros a client chooses.
Overlap data answers practical questions. A brand can see where a competitor is exclusive to one app. An investor can see whether a smaller app keeps its restaurants or loses them over time. A restaurant group can check where it is missing from an app its rivals use.
No public source gives an official US food delivery share for each app. DoorDash and Uber report global figures, and Grubhub is now private. The best public view comes from third-party card-transaction panels. Treat these as estimates and check the period each covers.
Earnest Analytics estimated that, at the end of 2024, DoorDash held 60.7% of US delivery sales, Uber Eats 26.1% and Grubhub 6.3%. The picture is closer in large cities. In the New York City area, DoorDash and Uber Eats were almost level, and in Los Angeles Uber Eats was slightly ahead. Bloomberg Second Measure's earlier panel showed a similar order for March 2024.
| Estimate (third-party) | DoorDash | Uber Eats | Grubhub | Source |
|---|---|---|---|---|
| US national, Mar 2024 (observed sales) | 67% | 25% (incl. Postmates) | 8% | Bloomberg Second Measure |
| US national, end of 2024 | 60.7% | 26.1% | 6.3% | Earnest Analytics |
| New York City area, end of 2024 | 38.4% | 38.2% | 17.6% | Earnest Analytics |
| Los Angeles CBSA, end of 2024 | 41.8% | 41.9% | 11.0% | Earnest Analytics |
In US food delivery, sales share shows where customers spend. Listing data shows where restaurants choose to be, at what price and with what fees. Combining both gives a fuller view of competitive position than either one alone.
1. Three-app restaurant and menu feeds: Public restaurant, menu, price and fee data from DoorDash, Uber Eats and Grubhub in one schema.
2. Cross-app matching: Stores and items matched by name, address, geo and size so price gaps are like-for-like.
3. ZIP-level fee and ETA tracking: Test baskets at set times to record delivery fees, service fees and delivery time estimates.
4. Scheduled history: Daily, weekly or quarterly series for trend and promotion analysis, with timestamps on every record.
5. Flexible delivery: CSV, Excel, JSON or API output, with a free sample before any project starts.
6. Compliance first: Public business data only, respect for robots.txt, terms of service and rate limits, and no personal data.
US food delivery is concentrated but not settled. DoorDash leads nationally, Uber Eats is close in the largest cities, and Grubhub has a new owner in Wonder. Fees are getting more variable, all three apps push $9.99 memberships, and New York City shows how local rules change costs.
These US food delivery shifts are hard to see in quarterly results alone. Structured, repeat data on menus, prices, fees, availability and coverage shows them app by app and ZIP by ZIP. To see what that looks like for your markets, contact us for a sample dataset:
Questions
DoorDash. Earnest Analytics estimated its share at 60.7% at the end of 2024, ahead of Uber Eats at 26.1% and Grubhub at 6.3%. These are third-party estimates based on card data, not company figures.
Wonder, the delivery-focused food-hall company, completed its $650 million purchase of Grubhub from Just Eat Takeaway.com in January 2025, as reported by Nation's Restaurant News.
Each lists $9.99 per month on its official page. DashPass also offers $96 per year. Benefits such as $0 delivery fees apply only to eligible orders above a subtotal minimum.
Not always. Restaurants set their own prices on each app, and fees differ. The only reliable way to compare them is to match the same items at the same address and time.
Collecting publicly visible business data, such as menus and listed prices, is common. Projects should respect robots.txt, terms of service and rate limits, avoid logins and never collect personal data. Get legal advice for your own use case.



