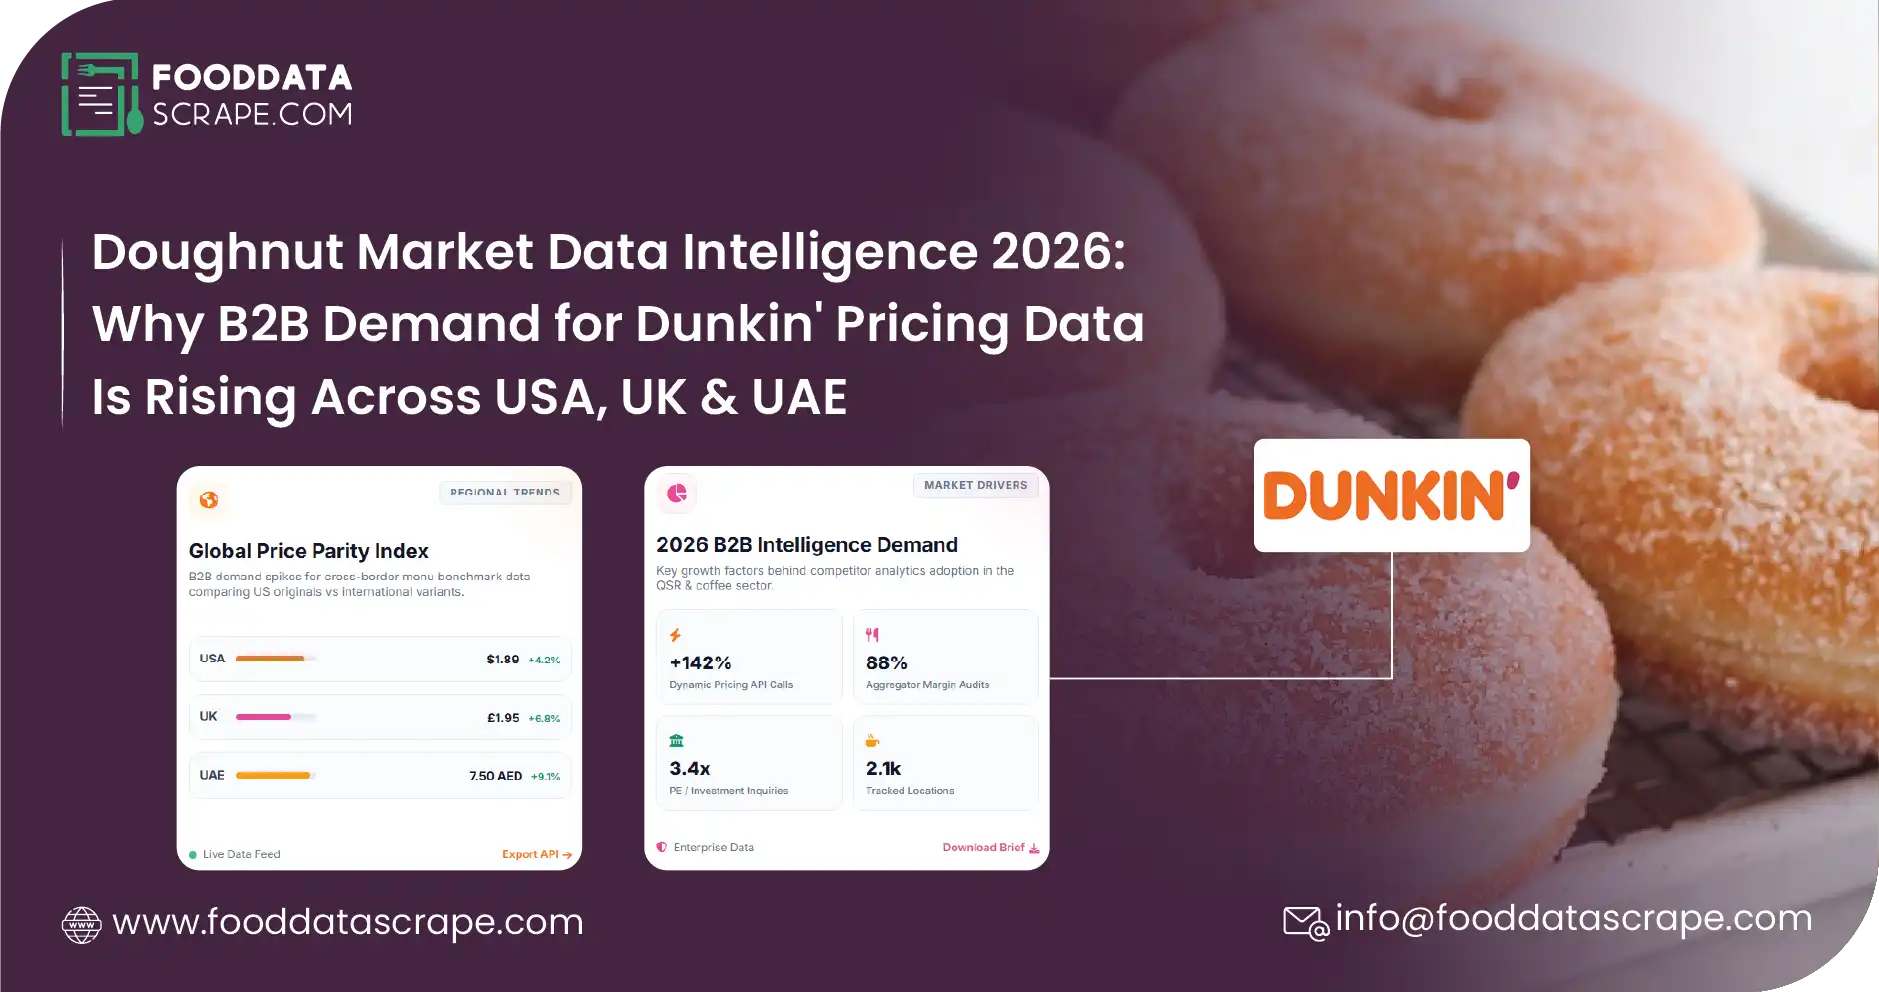
Introduction — Why Doughnut Market Data Has Become a Top B2B Demand in 2026
The global doughnut category has entered a decisive growth phase in 2026 — projected to cross $55 billion in global retail and foodservice value by year-end, with the quick-service doughnut segment growing 8-11% annually across USA, UK, UAE, and tier-1 emerging markets. Behind this growth, a quieter but equally important trend is unfolding: B2B demand for continuous Dunkin' pricing and menu data has risen sharply across QSR competitors, specialty bakery chains, private-equity-backed restaurant groups, and investment analysts covering the global F&B sector.
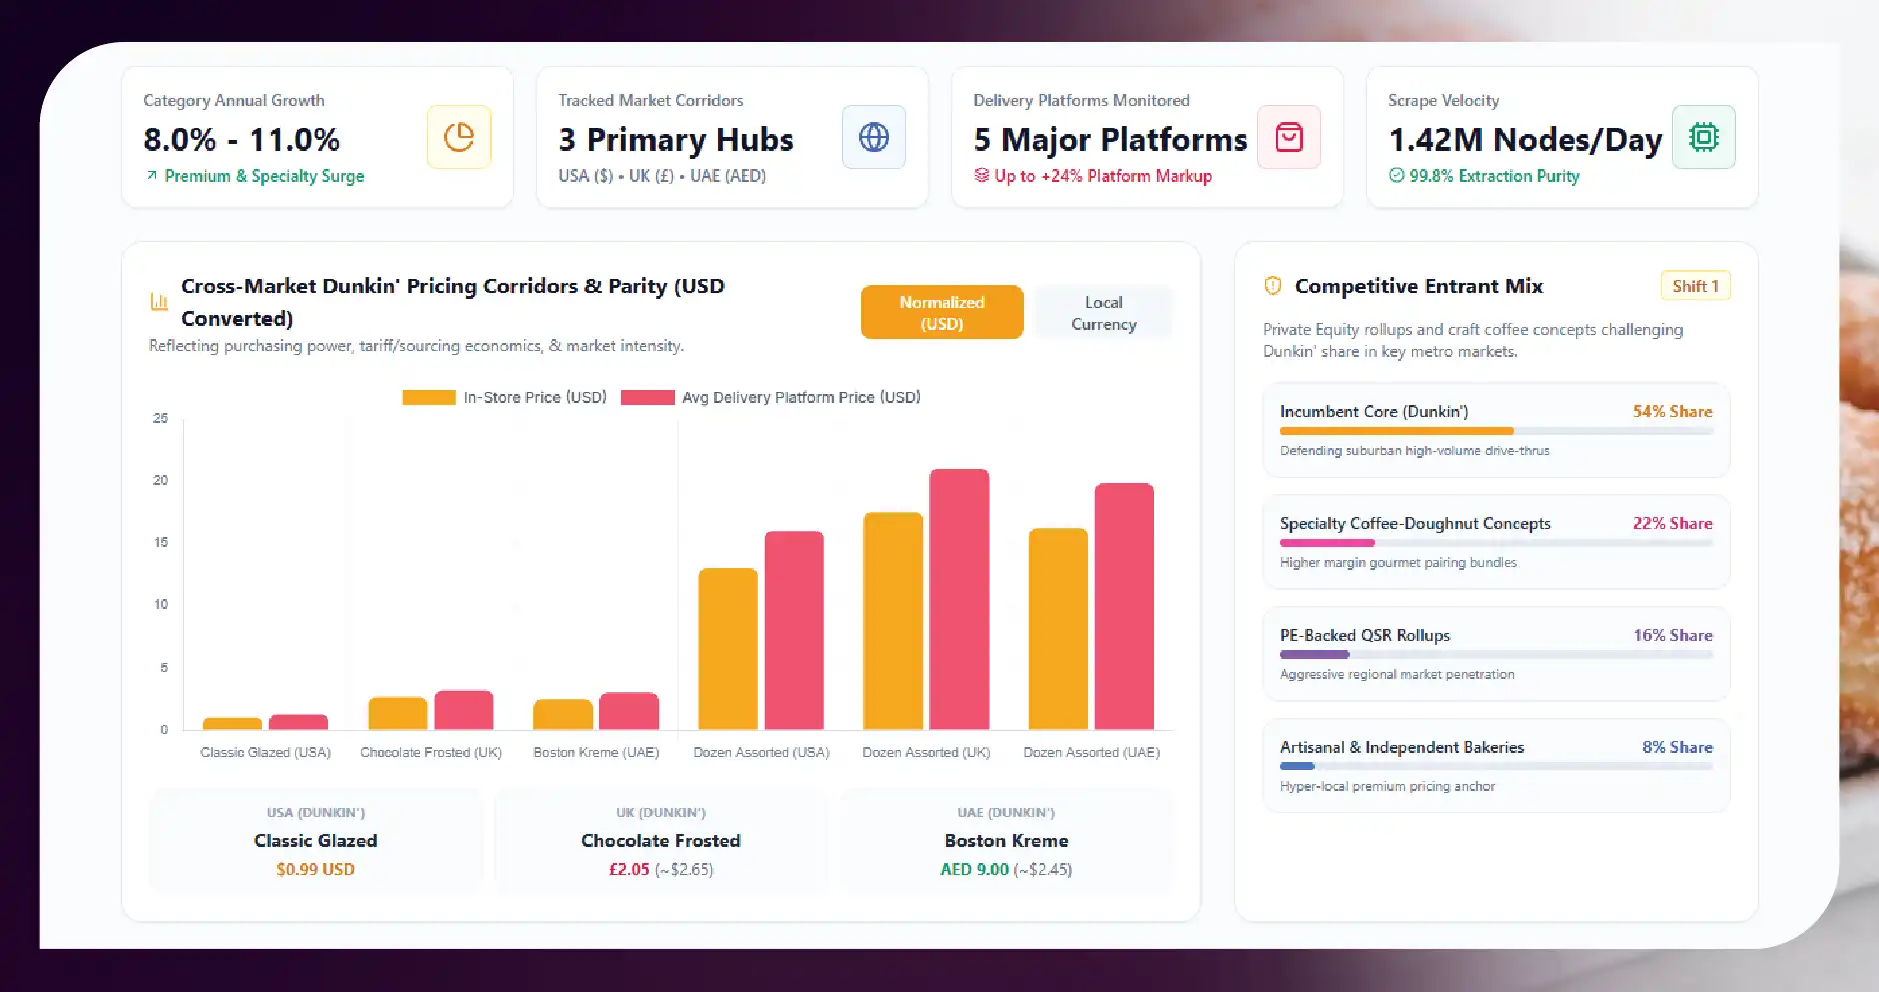
The reason is straightforward. Dunkin' now operates across 40+ countries with fundamentally different pricing corridors in each market — $0.99 for a Classic Glazed in the USA, £2.05 for a Chocolate Frosted in the UK, AED 9.00 for a Boston Kreme in the UAE. Across Uber Eats, Deliveroo, and DoorDash, the same Dunkin' product carries different consumer-facing pricing based on country, delivery platform, time-of-day promotional overlays, and local market dynamics. For category managers at competing QSR chains, F&B competitive intelligence teams, and sector analysts, continuous visibility into cross-market Dunkin' pricing dynamics has moved from occasional research curiosity to operational baseline.
This is exactly the demand that a modern cross-market doughnut data intelligence capability serves. When QSR competitors and F&B intelligence teams deploy purpose-built Dunkin menu price scraping 2026 pipelines, they gain continuous visibility into how the world's largest doughnut chain prices its core catalog across every major English-speaking market — informing competitive menu pricing, promotional response timing, and market-entry planning grounded in daily cross-platform data rather than quarterly consulting reports.
This 2026 market trends guide breaks down why B2B demand for doughnut data is accelerating, how leading QSR competitors and sector analysts build Dunkin' cross-market pricing capability, with real sample data structures, use cases, and the specific pipeline architecture that powers global bakery intelligence programs at scale.
The 2026 Global Doughnut Market Landscape — Why B2B Demand Is Rising
Three structural shifts have made continuous cross-market doughnut data extraction a top-demanded B2B capability in 2026, and each one explains why competitive QSR intelligence teams are investing in purpose-built pipelines.
1. Doughnut category growth has attracted new competitive entrants. The global doughnut market's 8-11% annual growth has drawn new premium bakery chains, specialty coffee-doughnut concepts, and private-equity-backed QSR rollups into direct competition with established players. This expanded competitive set has driven B2B demand for Dunkin USA UK UAE pricing data as both incumbents defend share and challengers calibrate market entry strategies.
2. Cross-market Dunkin' pricing corridors have professionalized with meaningful variation. The Classic Glazed at $0.99 in the USA, the Chocolate Frosted at £2.05 (~$2.65) in the UK, and the Boston Kreme at AED 9.00 (~$2.45) in the UAE represent fundamentally different price points reflecting local market purchasing power, competitive intensity, franchise cost structures, and ingredient sourcing economics.
3. Delivery platform fragmentation has multiplied the tracking surface. The same Dunkin' doughnut sits on Uber Eats, Deliveroo, DoorDash, Grubhub, and platform-specific channels with per-platform pricing overlays, promotional cycles, and delivery-fee economics. Uber Eats Dunkin data services, Deliveroo doughnut pricing API, and DoorDash menu data scraping enable comprehensive doughnut delivery platform scraping that captures distinct consumer-facing experiences for the same product — competitive intelligence that misses any one platform misses a significant share of the real-world customer experience.
The QSR brands, F&B intelligence teams, and investment analysts leading in 2026 are those with the fastest, cleanest visibility into how Dunkin' is actually priced across every major market and delivery platform in which Dunkin' operates. Market trend research increasingly points to doughnut category data as one of the top-demanded pricing intelligence verticals globally.
What Doughnut Data Intelligence Delivers
A modern Doughnut Market Data Intelligence pipeline is a data infrastructure that continuously scrapes Dunkin' menu listings, per-item pricing, delivery platform surcharges, and promotional overlays across USA, UK, UAE, and 40+ Dunkin' markets globally — delivering structured, decision-ready output to QSR competitive intelligence teams, category managers, and sector analysts — delivering global bakery pricing intelligence at scale.
A well-designed Dunkin competitor intelligence feed captures:
- Per-doughnut-SKU pricing across every monitored Dunkin' market (Classic Glazed, Chocolate Frosted, Boston Kreme, Jelly, Powdered, French Cruller, Munchkins, specialty seasonal items)
- Per-platform consumer-facing pricing (Uber Eats, Deliveroo, DoorDash, Grubhub, Dunkin' native app)
- Delivery fees, service charges, and promotional overlays per platform
- Dozen-pack and half-dozen pricing economics (critical for office and event orders)
- Specialty and seasonal item tracking (promotional assortments, Halloween, holiday menus)
- Local-currency normalization (USD, GBP, AED, EUR, CAD, AUD) with cross-market comparison currency
- Store-level pricing variation within a market (franchise vs company-operated differences)
- Category tagging (classic, premium, specialty, seasonal, breakfast-combo)
- 48-72-hour fast data collection cadence for competitive responsiveness
- Historical time-series for doughnut category market trends analysis, QSR doughnut category tracking, and year-over-year benchmarking
Sample Data — Real Cross-Market Dunkin' Snapshot
Below is a sample of the structured output a properly designed QSR pricing benchmark data pipeline produces for a competing QSR chain's category team monitoring Dunkin's core doughnut SKUs across three flagship markets.
Sample 1 — Cross-Market Dunkin' Doughnut Pricing Snapshot
| Doughnut SKU | USA (USD) | Uber Eats USA | UK (GBP) | Deliveroo UK | UAE (AED) | Careem Food UAE |
|---|---|---|---|---|---|---|
| Classic Glazed | 0.99 | 1.49 | 1.85 | 2.25 | 7.50 | 9.50 |
| Chocolate Frosted | 1.19 | 1.79 | 2.05 | 2.45 | 8.00 | 10.00 |
| Boston Kreme | 1.29 | 1.89 | 2.25 | 2.65 | 9.00 | 11.00 |
| Jelly Doughnut | 1.19 | 1.79 | 1.95 | 2.35 | 8.50 | 10.50 |
| Powdered Sugar | 1.09 | 1.59 | 1.85 | 2.25 | 7.50 | 9.50 |
| Vanilla Kreme | 1.29 | 1.89 | 2.25 | 2.65 | 9.00 | 11.00 |
| French Cruller | 1.39 | 1.99 | 2.45 | 2.85 | 9.50 | 11.50 |
| Half Dozen Mixed | 5.99 | 7.99 | 10.95 | 13.45 | 45.00 | 55.00 |
| Dozen Mixed | 10.99 | 13.49 | 19.95 | 23.95 | 85.00 | 102.00 |
The sample reveals immediate signals: Dunkin' USA operates on a classic $0.99 Classic Glazed anchor. Uber Eats USA carries approximately 50% platform markup over in-store pricing. UK pricing in GBP translates to roughly 2x the USD in-store equivalent. Deliveroo UK carries a smaller markup (20-25%). UAE in-store pricing at AED 7.50-9.50 translates to approximately 2x the USD equivalent, with Careem Food carrying 25-30% platform markup. Dozen-pack economics across markets show consistent break-even positioning at approximately 10x single-item pricing — a cross-market standardization worth noting for competitive menu engineering.
Sample 2 — 4-Week Doughnut Category Pricing Trend Panel
| Week | USA avg single | UK avg single | UAE avg single | Platform markup trend |
|---|---|---|---|---|
| Wk 1 | $1.19 | £2.05 | AED 8.50 | UE 50% / Dv 22% / Cf 28% |
| Wk 2 | $1.22 (+2.5% promo) | £2.05 (flat) | AED 8.75 (+2.9%) | UE 48% / Dv 22% / Cf 27% |
| Wk 3 | $1.19 (promo reset) | £2.10 (+2.4%) | AED 8.75 (flat) | UE 50% / Dv 23% / Cf 28% |
| Wk 4 | $1.25 (+5% specialty) | £2.10 (flat) | AED 9.00 (+2.9%) | UE 51% / Dv 23% / Cf 29% |
Four weeks of pricing trend data reveals signals a competing QSR chain's category team can act on immediately: USA pricing shows week-to-week promotional flexibility (±2-5% range) reflecting an actively managed price point. UK pricing shows slower but steady upward drift (+2.4% in week 3 to £2.10) likely reflecting cost-pass-through. UAE pricing shows consistent upward drift (+2.9% weekly) reflecting local inflation and currency effects. Platform markup ratios hold remarkably stable across weeks — suggesting that platform markup is a structural commercial decision rather than a tactical lever.
Key Success Metrics for Cross-Market Doughnut Data Pipelines
Enterprise QSR operators evaluating a cross-market Dunkin' pricing pipeline benchmark deployment success against five specific metrics.
Metric 1: Fast Data Collection Cadence. Best-in-class pipelines deliver 48-72-hour data collection cycles from source to decision-ready output.
Metric 2: Cross-Market SKU Match Accuracy. Matching the Classic Glazed across USA, UK, UAE, Canada, and Australia markets requires handling local naming variations, pack-size convention differences, and product-line regional specifics. Best-in-class pipelines achieve 95%+ match accuracy at production scale.
Metric 3: Multi-Platform Coverage Completeness. Dunkin' sits on Uber Eats, Deliveroo, DoorDash, Grubhub, Careem Food (UAE), and platform-specific channels. Production programs cover the primary 3-5 platforms in each market without systematic gaps.
Metric 4: Price-Point Volume at Scale. Enterprise programs deliver 12M+ price points across the global Dunkin' catalog — the data volume required for pattern-detection analytics, elasticity modeling, and time-series competitive intelligence.
Metric 5: 40+ Country Coverage Flexibility. While most engagements start with 3-5 flagship markets, best-in-class pipelines scale to 40+ Dunkin' markets globally as competitive intelligence scope broadens.
The Dunkin' Cross-Market Case — QSR Category Intelligence Demand
The global QSR competitive intelligence demand pattern — a competing QSR chain, specialty bakery brand, coffee chain, or private-equity-backed restaurant group monitoring 50-500 Dunkin' SKUs across USA, UK, UAE, Canada, and adjacent Dunkin' markets — is the most common entry point into doughnut category data deployment in 2026.
The global Dunkin' competitive landscape combines the breadth of 40+ country operations with the depth of multiple delivery platform channels per market. A QSR category manager tracking this landscape needs both dimensions visible — the cross-market pricing corridor data AND the per-platform promotional cadence data — to inform every pricing decision, menu engineering project, and competitive response initiative their team undertakes.
The Dunkin' pricing patterns visible across USA, UK, and UAE markets — classic-anchor pricing stability, platform markup consistency, dozen-pack break-even economics, promotional cadence coordination — inform every strategic decision a competitor's category intelligence team makes about doughnut and bakery category positioning. Krispy Kreme, Tim Hortons, local artisanal bakery chains, and coffee-shop operators (Starbucks, Costa, Pret) all benefit from continuous Dunkin' competitive intelligence when their doughnut or sweet-bakery categories overlap.
How the Doughnut Pricing Data Pipeline Architecture Works
FoodDataScrape builds doughnut delivery platform scraping and cross-market QSR pipelines on a five-layer architecture designed for global brand tracking — pipelines built for Dunkin menu price scraping 2026 requirements at production scale.
Layer 1: Market and Platform Scope Mapping. The team defines markets (USA, UK, UAE, Canada, Australia, and up to 40+ Dunkin' countries), delivery platforms per market, and target SKU catalogs covering classics, specialty items, and seasonal assortments.
Layer 2: Cross-Market SKU Matching. An AI matching layer pairs equivalent doughnut SKUs across markets with local-naming variation handling and pack-size convention standardization.
Layer 3: Continuous Daily Multi-Platform Scraping. Per-market per-platform extractors pull per-SKU pricing, promotional overlays, delivery fees, availability signals, and metadata daily. Data is normalized into consistent cross-market schema with local currency plus common comparison currency.
Layer 4: Cross-Market Analytics Layer. Raw pricing data transforms into decision-ready outputs — cross-market price-spread calculations, per-platform markup analysis, promotional cadence detection, dozen-pack economics benchmarking.
Layer 5: Delivery and Integration. The pipeline delivers via REST API, CSV export, JSON streaming, or live dashboard.
Build timeline for this multi-country doughnut data pipeline is 5-7 weeks for a mid-scope engagement covering 100-500 Dunkin' SKUs across 3-5 flagship markets and 3-5 platforms per market.
Why QSR Competitors Choose Continuous Doughnut Data
QSR competitors, F&B intelligence teams, and sector analysts select continuous Dunkin' data intelligence pipelines over quarterly consulting reports or manual secret-shopper audits for six specific reasons that explain the rising B2B demand.
- 48-72-hour fast data collection. Promotional windows are short; continuous pipelines capture them as they happen rather than retrospectively.
- Multi-platform coverage in one feed. Uber Eats + Deliveroo + DoorDash + Grubhub + Careem Food simultaneously with consistent schema.
- Cross-market currency normalization. USD, GBP, AED, CAD, AUD conversion automatic rather than requiring downstream engineering.
- 12M+ price-point volume. Data scale required for pattern-detection, elasticity modeling, and year-over-year benchmarking.
- 40+ country coverage flexibility. Scale from 3 flagship markets to global Dunkin' footprint as scope evolves.
- Multiple delivery options. REST API, CSV, JSON, or Live Dashboard matching client workflow preferences.
Sample Use Cases — How QSR Teams Actually Use the Data
Use Case 1: Competing QSR Chain Category Pricing Committee. A competing coffee-and-doughnut QSR chain's category committee reviews cross-market Dunkin' positioning weekly to inform their own doughnut category pricing and promotional response timing.
Use Case 2: Specialty Bakery Brand Market-Entry Preparation. A premium bakery brand preparing to enter the UK market uses continuous Dunkin' UK pricing and promotional data to inform market-entry pricing calibration.
Use Case 3: Private-Equity Investment Thesis Validation. A PE firm evaluating a coffee-doughnut QSR acquisition uses continuous Dunkin' competitive data to validate pricing power assumptions and competitive positioning claims in the investment thesis.
Use Case 4: F&B Intelligence Team Executive Reporting. A restaurant holding company's F&B intelligence team produces quarterly cross-market Dunkin' positioning reports informing board-level discussions on category strategy.
Use Case 5: Franchise Operator Local Pricing Calibration. A multi-unit Dunkin' franchise operator uses continuous Dunkin franchise pricing data plus cross-market competitive data to calibrate local pricing decisions within corporate-approved pricing corridors.
Getting Started — The 5-Week Roadmap
Getting a cross-market Dunkin' data engagement live follows a structured process.
Week 1: Scoping and PoC. Client defines target SKUs, markets, platforms, refresh cadence, and delivery format. Free proof-of-concept sample delivered within 5 business days.
Weeks 2-4: Production build. Market-specific extractors, cross-market SKU matching, analytics layer, and delivery integration configured (REST API, CSV, JSON, or Live Dashboard).
Week 5: Live production delivery. Continuous cross-market Dunkin' intelligence flows into competitive intelligence workflows.
Ongoing: Coverage expansion. Additional Dunkin' markets, adjacent QSR competitors (Krispy Kreme, Tim Hortons, Starbucks, Costa), and expanded SKU catalogs added as competitive intelligence scope broadens.
Conclusion — Continuous Doughnut Market Data Intelligence Is the 2026 QSR Standard
The global QSR doughnut market in 2026 has become too cross-market-strategic, too platform-fragmented, and too promotionally dynamic for quarterly consulting reports or manual secret-shopper audits to serve as reliable competitive intelligence. QSR competitors, F&B intelligence teams, and sector analysts without continuous cross-market Dunkin' data are structurally disadvantaged against those that have moved to purpose-built pipelines. Rising B2B demand for Doughnut Market Data Intelligence reflects this competitive reality.
The USA-UK-UAE 9-SKU pattern is the entry point for most engagements. Most competitors expand within 6-12 months to 500-5,000 SKUs across 10-40 Dunkin' markets, adding adjacent competitors (Krispy Kreme, Tim Hortons, specialty bakery chains, coffee-shop operators) as competitive intelligence depth grows.
FoodDataScrape builds the pipelines that deliver this intelligence — covering Dunkin', Krispy Kreme, Tim Hortons, Starbucks, Costa, Pret, and specialty bakery chains across 40+ markets with 48-72-hour fast data collection, 12M+ price points of coverage depth, cross-market currency normalization, and multiple delivery options.
If you are a competing QSR chain, a specialty bakery brand, a private-equity-backed restaurant group, an F&B intelligence team, or a sector analyst — continuous doughnut data is the fastest path to closing the 2026 competitive intelligence gap.
Get Doughnut Data Now. Tell us your target Dunkin' SKUs, markets, and platforms. Get a free proof-of-concept sample within 5 business days — no commitment required. Available via: REST API • CSV • JSON • Live Dashboard. Contact FoodDataScrape today for continuous global Dunkin' intelligence.
Questions
Frequently Asked Questions
Per-SKU per-market per-platform pricing, delivery platform surcharges, promotional overlays, dozen-pack economics, specialty and seasonal item tracking, local-currency normalization, and historical time-series across Dunkin' operations in USA, UK, UAE, and up to 40+ Dunkin' markets globally.
Uber Eats, Deliveroo, DoorDash, Grubhub, Careem Food (UAE), Talabat (UAE), Jahez (KSA), and Dunkin's own native app and web channels across every market Dunkin' operates in.
48-72-hour fast data collection cycles from source to decision-ready output — enabling competitive response within promotional windows that often last only 7-14 days.
Enterprise programs deliver 12M+ price points across the global Dunkin' catalog — the data volume required for pattern-detection analytics, elasticity modeling, and year-over-year benchmarking.
Yes — the same pipeline architecture extends to Krispy Kreme, Tim Hortons, Starbucks, Costa, Pret, local artisanal bakery chains, and specialty coffee-shop operators in any market where competitive intelligence depth is needed.
REST API, CSV export, JSON streaming, and Live Dashboard — matching client workflow preferences and downstream system integration requirements.
Get a Free Food Data Sample in 48 Hours.
Tell us your platforms, target markets and required fields — we'll map exactly what's possible with food data scraping, recommend the right approach, and send a working sample so you can verify quality before any commitment.