Introduction
Food inflation is no longer a broad economic statistic that businesses can monitor once a month. Grocery prices can change across supermarkets, brands, pack sizes, categories, locations, promotions, and even individual stores. For retailers, consumer brands, analysts, procurement teams, and pricing strategists, understanding these movements requires granular and continuously refreshed information. This is where grocery inflation tracking becomes strategically important, allowing businesses to monitor price movements at SKU, category, supermarket, and market levels.
Traditional inflation indicators provide valuable macroeconomic context, but they may not reveal how a specific basket of milk, bread, eggs, vegetables, snacks, beverages, and household essentials is changing across competing retailers. A structured dataset can bridge this gap by collecting comparable product prices over time and converting them into actionable intelligence.
grocery price inflation tracking can help organizations identify where prices are accelerating, which categories are experiencing the greatest pressure, and which retailers are changing prices most aggressively.
Similarly, grocery basket inflation analysis enables companies to construct representative shopping baskets and measure how much consumers would pay today compared with previous periods. This approach transforms thousands of individual product observations into an understandable measure of household purchasing pressure.
The growing availability of online supermarket catalogs has made this analysis significantly more scalable. Product names, brands, pack sizes, promotional prices, regular prices, availability, categories, and retailer information can be collected at recurring intervals, normalized, and analyzed historically. The resulting dataset can support inflation dashboards, competitive pricing systems, forecasting models, procurement decisions, and market research.
Why Grocery Inflation Tracking Matters
Grocery inflation behaves differently from headline inflation because food categories are exposed to multiple supply and demand forces. Weather conditions can influence fresh produce. Commodity markets affect grains, dairy, edible oils, and meat. Energy and transportation costs influence distribution expenses. Currency movements can affect imported products. Promotional strategies can temporarily reduce consumer prices even when underlying costs are increasing.
A supermarket may therefore show a 4% average increase across its grocery catalog while individual categories experience dramatically different movements. Cooking oil could rise 11%, breakfast cereals 7%, dairy 3%, and fresh vegetables decline 2% during the same period.
Businesses need to distinguish these movements rather than relying on a single average.
A well-designed tracking framework records the same products repeatedly and compares prices using consistent identifiers. The process should account for SKU, brand, product variant, package quantity, unit price, retailer, store location, collection date, promotion status, and availability.
This creates a historical price series that can answer questions such as:
- Which grocery categories experienced the fastest inflation?
- Which brands increased prices most frequently?
- Which supermarkets had the highest basket inflation?
- How much did promotional pricing offset regular price increases?
- Which products experienced unusually large price changes?
- Are private-label products becoming more competitive?
- How does inflation vary between cities or regions?
Building a Grocery Price Index From Scraped Data
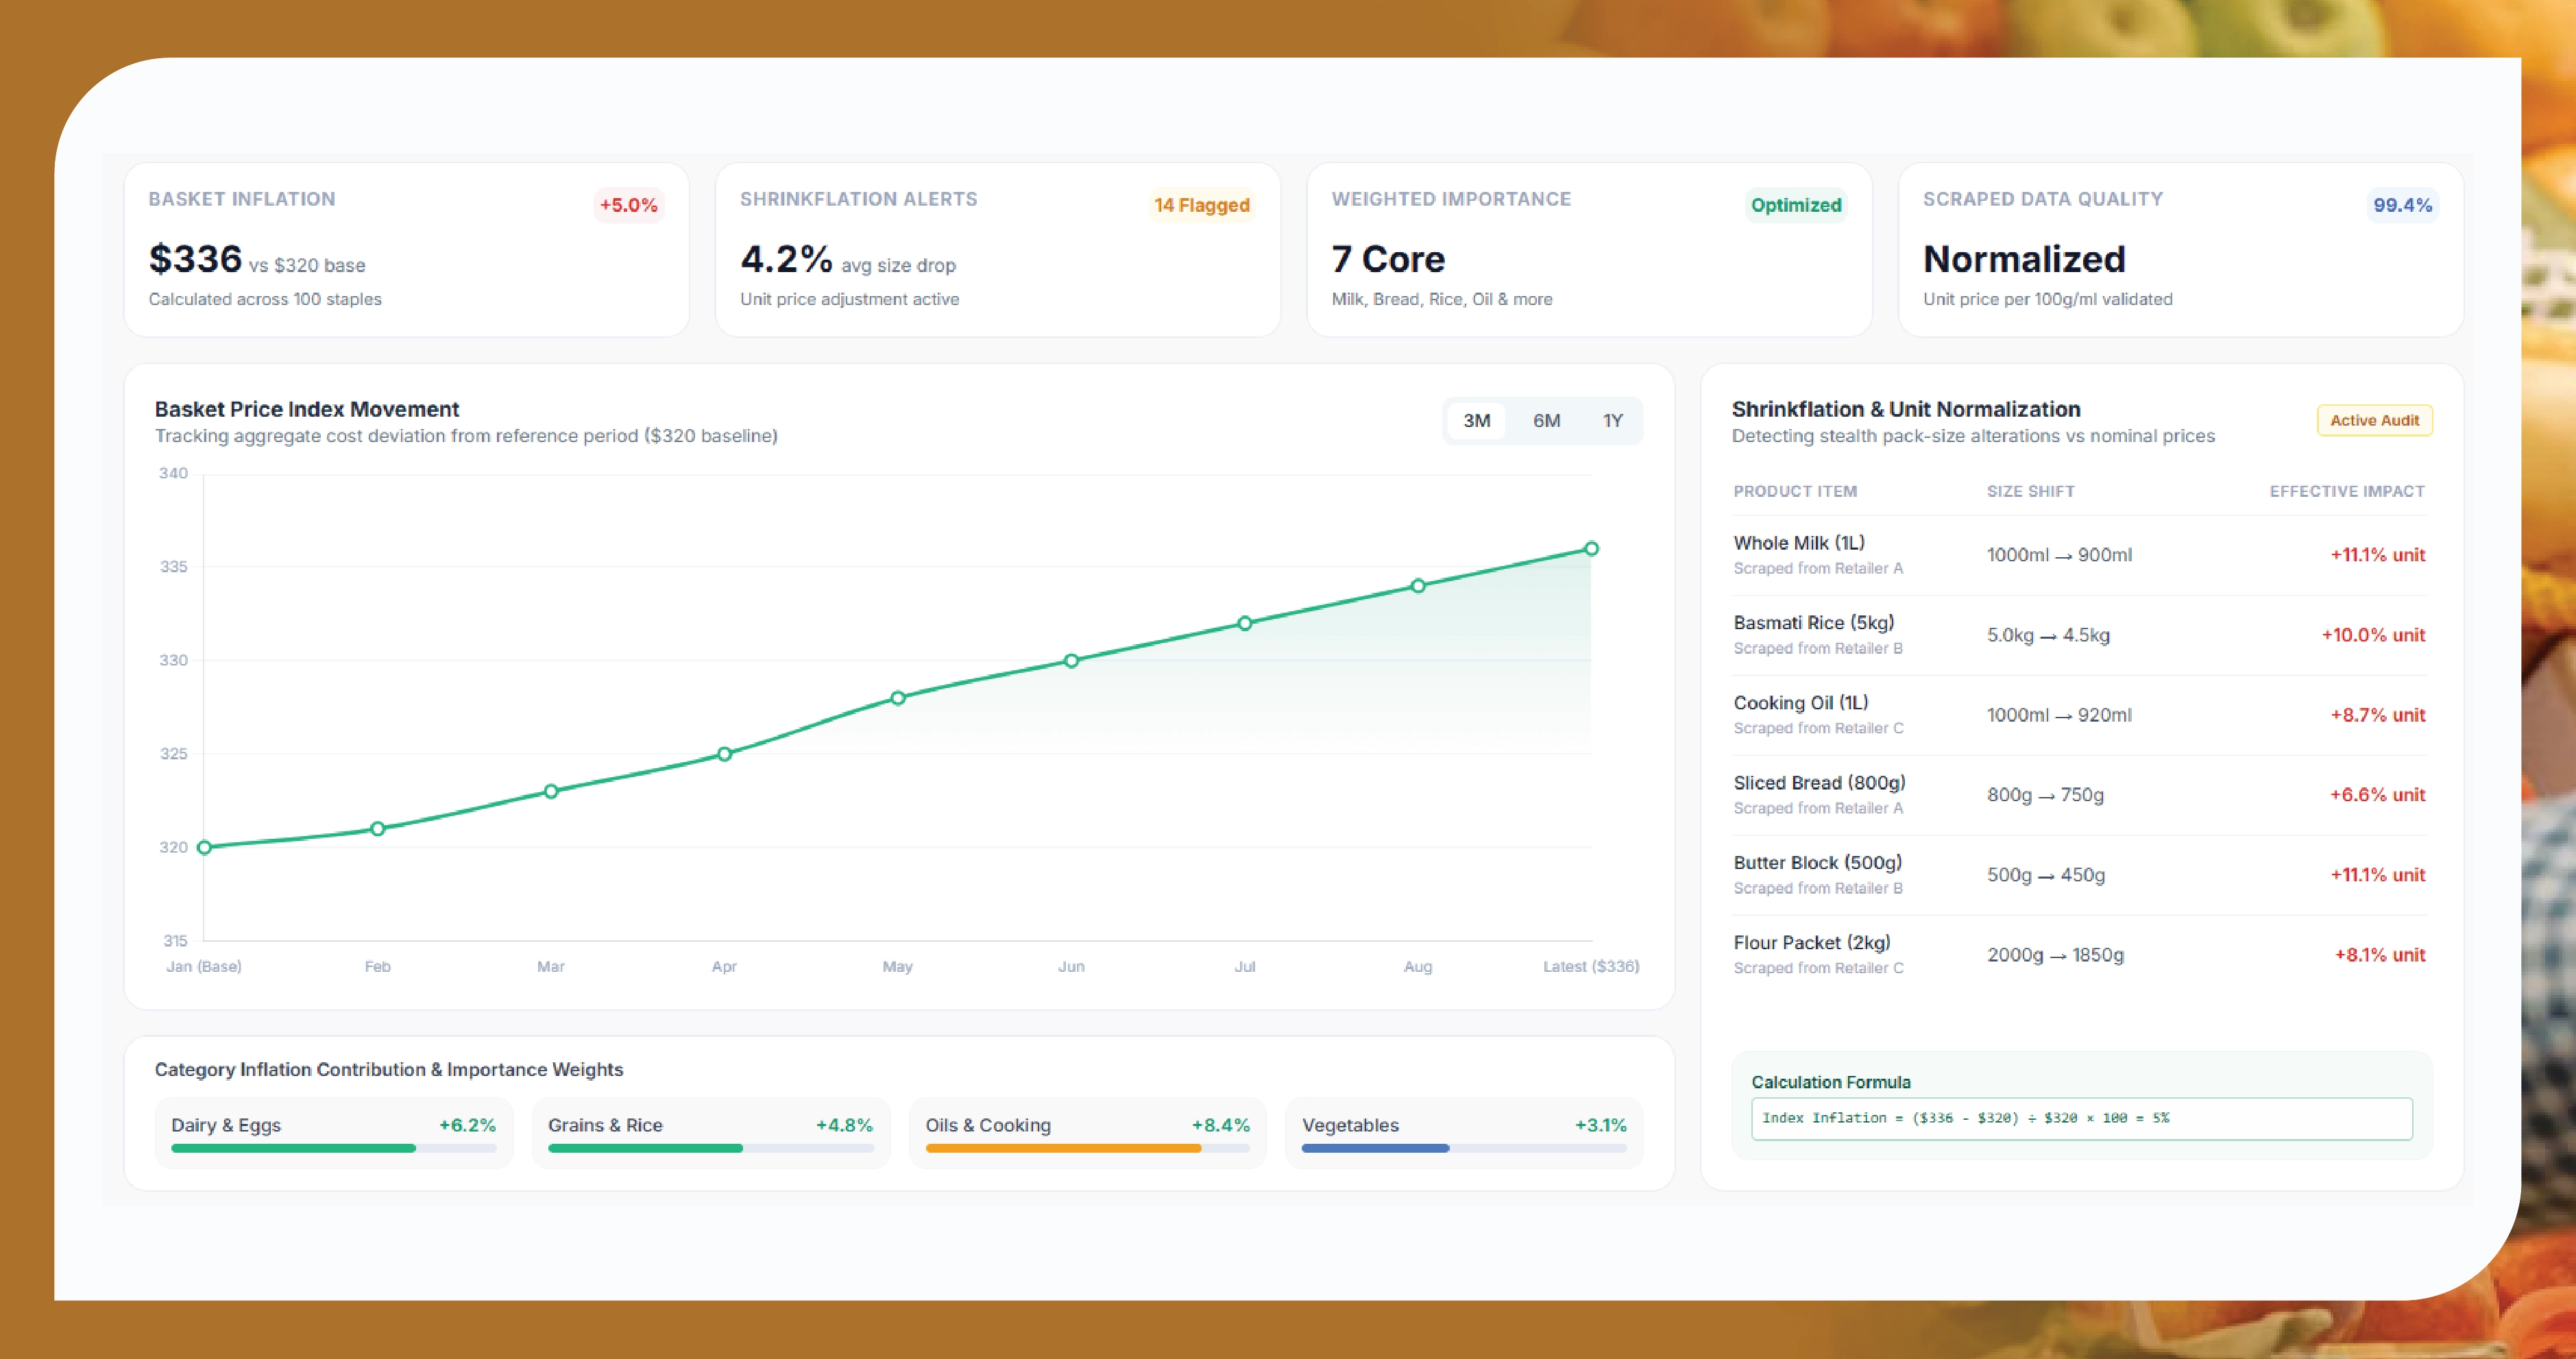
A grocery price index from scraped data can be developed by assigning products to categories, establishing a reference period, and calculating weighted price movements.
For example, a business could create a representative basket containing 100 commonly purchased products. If the basket costs $320 during the base period and $336 during the latest observation, the calculated basket inflation is:
($336 − $320) ÷ $320 × 100 = 5%
The index becomes more useful when products are weighted according to estimated consumer importance. Essential categories such as milk, bread, eggs, rice, flour, vegetables, and cooking oil may receive greater weights than occasional purchases.
A robust index should also distinguish between price changes caused by genuine inflation and changes caused by pack-size alterations. A product moving from 1 kg to 900 g without a proportional price reduction represents an effective price increase even if the displayed shelf price appears unchanged.
Unit-price normalization is therefore essential.
Tracking Inflation Across Supermarkets
Retailer-level comparison adds another dimension to inflation analysis. Two supermarkets may sell similar products but use different pricing strategies. One may maintain lower everyday prices, while another may rely heavily on promotions.
This makes it valuable to grocery brand price inflation tracking at both retailer and SKU levels.
A standardized product-matching system can identify equivalent products across supermarkets. Matching should consider brand, product name, size, variant, barcode, pack count, and unit quantity. Once matched, analysts can calculate absolute and percentage differences.
For example, if the same 500 g branded cereal costs $4.20 at Retailer A and $4.55 at Retailer B, the price gap is $0.35. Repeating this comparison weekly can reveal whether the difference is temporary or structural.
Businesses can also scrape grocery price inflation by supermarket to create retailer-specific inflation scores.
Such comparisons can reveal whether a retailer is becoming more expensive overall or simply changing promotional intensity. They can also highlight supermarkets that are gaining price competitiveness in high-frequency categories.
Turn grocery price data into actionable intelligence with Food Data Scrape—track inflation, benchmark competitors, and make smarter pricing decisions.
From Raw Prices to Grocery Market Intelligence
Raw price data becomes significantly more valuable when transformed into grocery market intelligence.
A market intelligence platform can combine historical prices with product metadata, promotions, availability, retailer information, ratings, brand information, pack sizes, and geographic coverage.
This allows businesses to identify trends rather than isolated price movements.
For instance, if five retailers simultaneously increase the price of a branded product, the movement may indicate supplier-level cost pressure. If only one retailer increases its price, the change may reflect retailer-specific pricing strategy.
Frequency is another important signal. A 10% increase occurring once is different from five separate 2% increases over several months. Tracking individual price events allows analysts to identify gradual inflation, sudden repricing, promotional reversals, and persistent price gaps.
Measuring Promotional Inflation
Promotions can make grocery inflation difficult to interpret.
A product might have a regular price of $5.00 and a promotional price of $3.99. If the promotion ends, the observed price rises by 25%, but this does not necessarily represent an equivalent increase in underlying costs.
Therefore, datasets should store both regular and promotional prices whenever available.
Important fields include:
- Regular price
- Promotional price
- Discount percentage
- Promotion type
- Promotion start date
- Promotion end date
- Product quantity
- Unit price
- Historical price
- Availability status
Analyzing these variables separately provides a more realistic picture of consumer-facing inflation.
Detecting Shrinkflation
Inflation tracking should also monitor package sizes.
A 1-liter beverage priced at $3.00 and later sold as 900 ml for $3.00 has experienced a unit-cost increase even though the displayed price is unchanged.
A sophisticated system can calculate:
Unit Price = Product Price ÷ Product Quantity
This metric makes products comparable across different package sizes and helps identify hidden price increases.
Geographic Grocery Inflation
Inflation is rarely uniform across geography.
The same product can have different prices between cities because of logistics, regional competition, store formats, local demand, taxes, distribution costs, and availability.
A geographically structured dataset can compare metropolitan areas, states, regions, or postal zones. Analysts can then build heat maps showing where grocery inflation is highest.
For retailers, geographic analysis can identify locations where prices are significantly above or below the network average. For brands, it can reveal regional pricing differences that may require channel-specific strategies.
Creating an Automated Tracking System
A reliable grocery inflation system should operate as a recurring pipeline rather than a one-time collection exercise.
The workflow typically begins with product discovery and data collection. Product pages are captured at scheduled intervals, after which information is cleaned and standardized. Matching algorithms connect current products to historical records. Price-change calculations are then performed, followed by category-level and retailer-level aggregation.
A typical architecture includes:
Collection → Validation → Product Matching → Normalization → Historical Storage → Inflation Calculation → Dashboard → Alerts
Automated alerts can notify analysts when prices exceed predefined thresholds.
For example, an organization could create alerts for:
- Price increases above 5%
- Price decreases above 10%
- Three consecutive increases
- Significant pack-size reductions
- Competitor price gaps above a defined threshold
- Sudden promotional changes
- Persistent product unavailability
This converts passive historical data into an active decision-support system.
Business Applications
Grocery inflation data can support numerous commercial decisions.
Retailers can benchmark pricing against competitors and optimize promotional calendars. Brands can monitor recommended retail pricing and detect retailer deviations. Procurement teams can identify categories experiencing sustained inflation. Restaurants and foodservice operators can monitor ingredient costs. Financial analysts can study consumer spending pressure. Market researchers can assess category-level pricing trends.
The same dataset can also support demand forecasting. When historical prices are combined with availability and promotional information, businesses can investigate how price movements influence product demand.
This is particularly useful for high-frequency grocery categories where small price changes can have meaningful effects on purchasing behavior.
How Food Data Scrape Can Help You?
1. Comprehensive Collection
Food Data Scrape can collect structured grocery product information across retailers, categories, brands, locations, and time periods, creating consistent historical datasets for inflation measurement.
2. Historical Monitoring
Food Data Scrape can support recurring collection schedules that capture regular prices, promotional prices, pack sizes, availability, and product changes for reliable longitudinal analysis.
3. Competitive Benchmarking
Food Data Scrape can organize supermarket pricing into comparable datasets, helping businesses identify competitor price gaps, category inflation, promotional differences, and emerging pricing patterns.
4. Custom Intelligence
Food Data Scrape can deliver datasets tailored to specific categories, retailers, regions, brands, or products, supporting focused inflation dashboards and customized market intelligence programs.
5. Scalable Analytics
Food Data Scrape can provide large-scale structured grocery datasets suitable for dashboards, forecasting systems, pricing models, research platforms, and automated inflation monitoring workflows.
Conclusion
Grocery inflation tracking is evolving from occasional price checks into a continuous intelligence discipline. Businesses need more than average inflation percentages; they need SKU-level historical prices, retailer comparisons, unit-price calculations, promotional context, package-size monitoring, geographic differences, and category-level trends.
Scrape Grocery Data to provide the recurring product observations required to build reliable historical price datasets, while Scrape Grocery List Data can help organizations monitor representative consumer baskets and calculate changing household costs.
Food Data Scraping can further connect product-level observations with retailer, brand, category, availability, promotion, and geographic information, creating a richer foundation for grocery market analysis.
When these datasets are collected consistently and normalized correctly, businesses can move beyond simply observing inflation. They can understand its causes, identify its strongest signals, benchmark competitors, detect emerging pricing patterns, and respond faster to changes in the grocery market.