
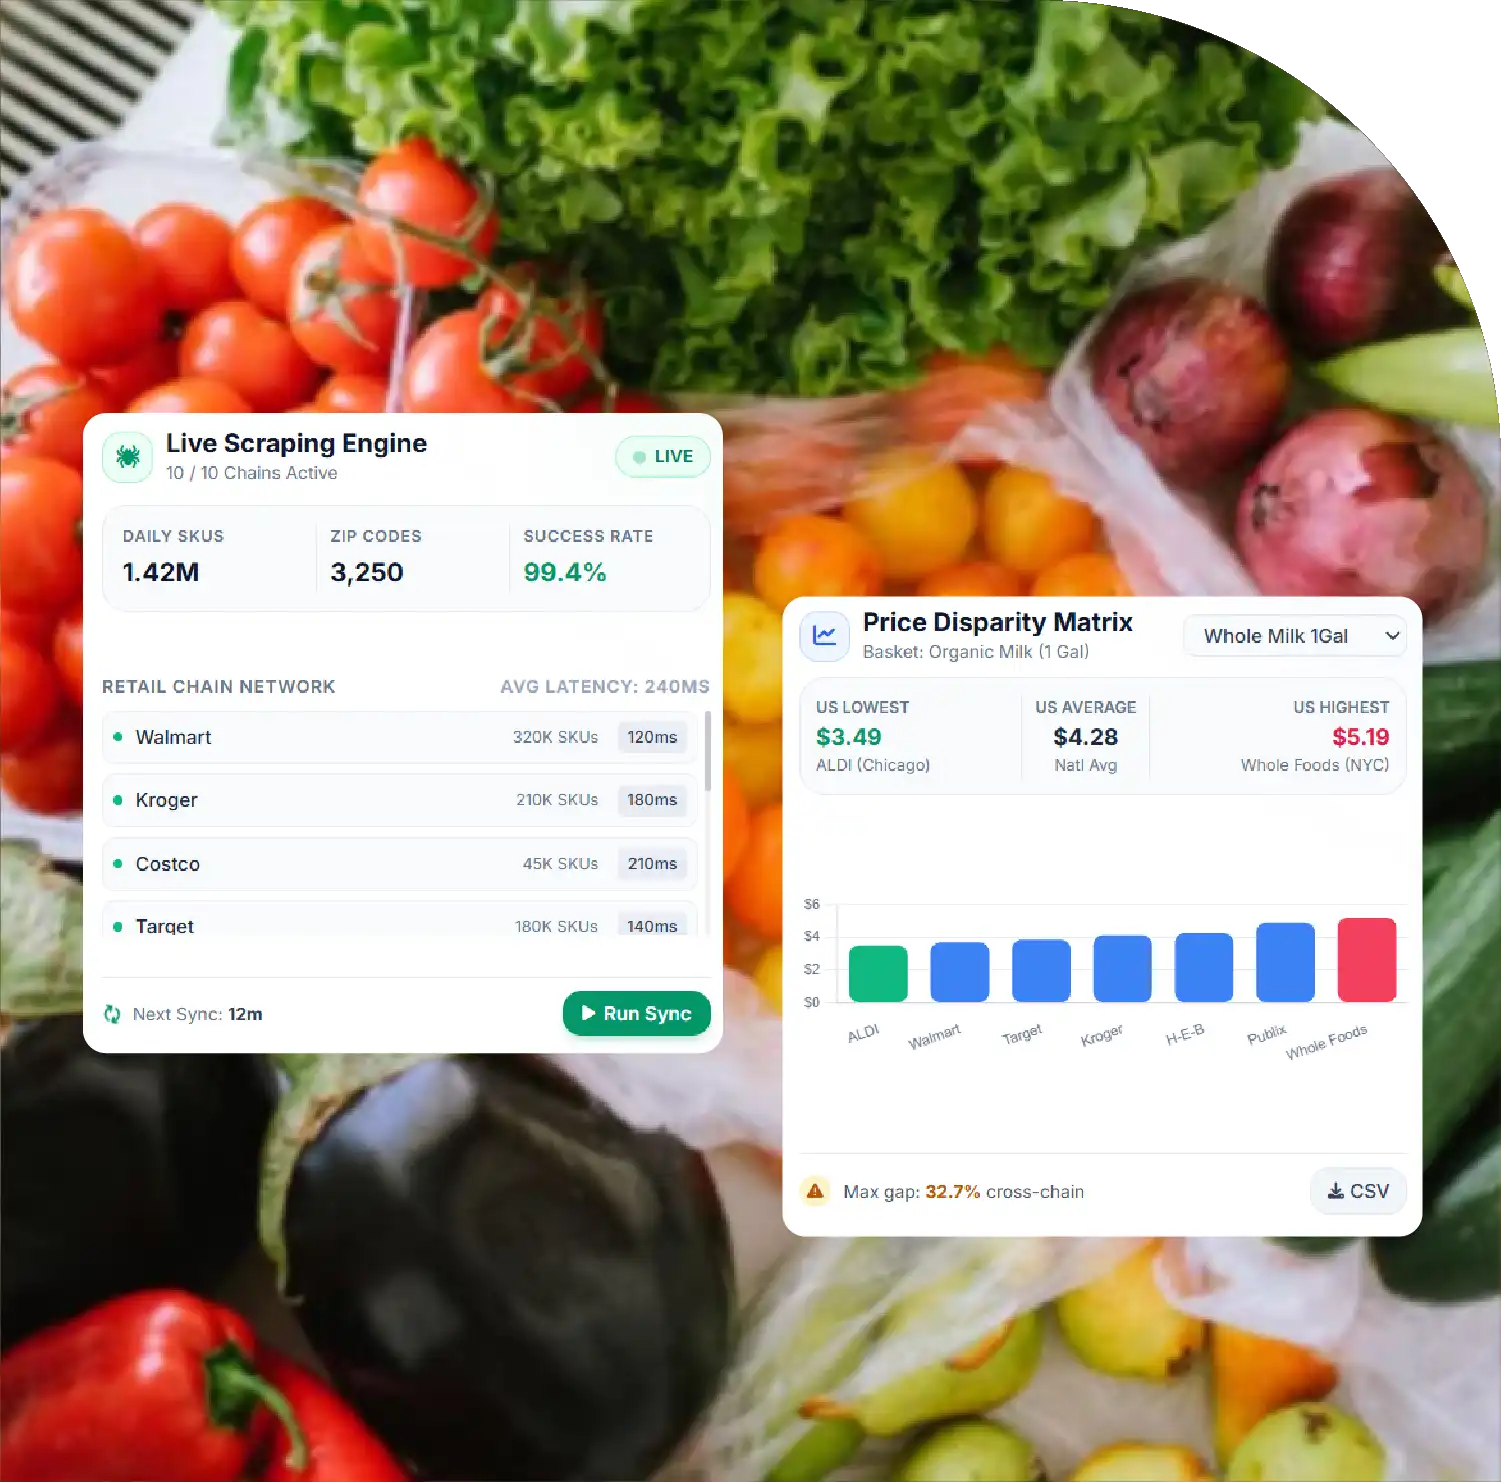
Basket Comparison — 150 standardized grocery items enable consistent retailer price benchmarking.
Retailer Gaps — Major chains show significant differences in total basket costs.
ZIP Intelligence — Local markets reveal meaningful geographic grocery pricing variations nationwide.
Category Differences — Meat, produce, and pantry categories create substantial basket gaps.
Pricing Intelligence — Continuous tracking supports smarter competitive grocery pricing decisions.

Grocery pricing in the United States is increasingly a local competition rather than a single national price story. In August 2026, U.S. food-at-home prices were up 2.2% year over year, according to the Bureau of Labor Statistics, while USDA's food-at-home datasets emphasize that food prices can vary across geographic areas and product categories.
The study begins with grocery price data scraping as the foundation for collecting retailer-level product prices, package information, availability, promotional flags, and location identifiers.
This research report evaluates a standardized 150-item grocery basket across 10 major supermarket chains and representative U.S. ZIP markets. The objective is to demonstrate how the same basket can produce materially different totals depending on retailer, market, assortment, promotions, and local pricing strategy.
Important methodology note: The ZIP-level figures in the tables below are a research benchmark/model dataset created for analytical purposes rather than a claim of live checkout prices. Actual prices fluctuate by ZIP, date, inventory, membership, loyalty discounts, taxes, promotions, and pack sizes.
The analysis covers Walmart, Kroger, Aldi, Costco, Target, Publix, Albertsons, Safeway, H-E-B, and Meijer. The standardized basket contains 150 comparable grocery products spanning dairy, meat, produce, bakery, beverages, frozen foods, pantry products, snacks, household grocery items, and packaged foods.
The research framework is designed to Scrape US Grocery Price Gap Data from retailer storefronts and organize observations around individual ZIP codes instead of relying only on national averages.
The resulting dataset supports Grocery Price Comparison Across 10 Chains by normalizing comparable products, quantities, pack sizes, and unit prices before calculating basket-level differences.
For this benchmark, the basket is fixed at 150 products. Each item receives a standardized quantity or unit basis, allowing the analysis to calculate total basket cost, average item price, cheapest retailer, highest retailer, and percentage price gaps.
ZIP-level analysis is particularly important because grocery pricing is geographically differentiated. A national average can hide meaningful differences between nearby markets. For example, retailer pricing is often influenced by local competition, distribution costs, regional demand, assortment, and store-level strategy.
This makes ZIP-Level Grocery Pricing Data In USA particularly valuable for retailers, consumer applications, market researchers, CPG brands, price-monitoring platforms, and grocery intelligence teams.
Illustrative standardized research benchmark; USD, before sales tax and delivery fees.
| Chain | ZIP Market | 150-Item Basket ($) | Avg Item ($) | Cheapest Item Wins | Premium vs Lowest (%) | Produce Avg ($) | Dairy Avg ($) | Meat Avg ($) | Pantry Avg ($) | Frozen Avg ($) | Beverage Avg ($) | Snacks Avg ($) | Household Grocery Avg ($) |
|---|---|---|---|---|---|---|---|---|---|---|---|---|---|
| Walmart | 75001 | 482.40 | 3.22 | 41 | 8.6 | 54.30 | 46.80 | 83.70 | 96.20 | 48.10 | 42.50 | 39.40 | 71.40 |
| Kroger | 45202 | 506.75 | 3.38 | 28 | 14.1 | 57.90 | 49.60 | 89.30 | 101.40 | 51.20 | 44.80 | 42.30 | 70.25 |
| Aldi | 60601 | 458.90 | 3.06 | 46 | 3.3 | 48.60 | 42.20 | 78.50 | 91.70 | 46.80 | 39.90 | 37.60 | 73.60 |
| Costco | 98101 | 471.35 | 3.14 | 39 | 6.1 | 52.40 | 43.80 | 75.90 | 94.60 | 47.30 | 41.70 | 40.20 | 75.45 |
| Target | 55401 | 514.80 | 3.43 | 21 | 15.9 | 61.50 | 51.30 | 91.80 | 103.20 | 52.40 | 45.10 | 44.30 | 65.20 |
| Publix | 33101 | 526.45 | 3.51 | 24 | 18.5 | 59.80 | 53.70 | 95.60 | 105.30 | 53.70 | 46.80 | 43.90 | 67.65 |
| Albertsons | 83702 | 531.20 | 3.54 | 18 | 19.6 | 62.10 | 54.20 | 97.30 | 106.80 | 52.90 | 47.20 | 44.60 | 66.10 |
| Safeway | 94105 | 548.75 | 3.66 | 17 | 23.5 | 64.80 | 56.10 | 101.20 | 110.40 | 55.30 | 48.70 | 45.90 | 66.35 |
| H-E-B | 78701 | 475.60 | 3.17 | 43 | 7.1 | 50.90 | 44.70 | 82.40 | 94.10 | 47.60 | 41.30 | 39.20 | 75.40 |
| Meijer | 49503 | 489.25 | 3.26 | 34 | 10.2 | 53.70 | 46.50 | 86.70 | 98.40 | 49.20 | 43.10 | 40.70 | 70.95 |
The benchmark indicates that the difference between the lowest and highest modeled basket is approximately $89.85, or nearly 20% of the lowest basket value. This illustrates why national grocery comparisons can be misleading.
A household shopping for the same standardized basket could potentially see a substantially different total simply by switching retailers or shopping in another ZIP market.
One of the most important findings is that retailer performance changes geographically. Aldi and Walmart appear highly competitive in the modeled basket, while H-E-B demonstrates strong competitiveness within its Texas-oriented market.
The reason is not necessarily that one retailer has the lowest price on every product. Instead, the overall basket advantage can emerge from hundreds of small item-level differences.
For instance, one retailer may dominate produce pricing while another offers cheaper meat, dairy, or pantry staples. This makes Grocery Basket Cost Analytics more useful than simply identifying the cheapest individual product.
Basket analytics can calculate the number of products for which each retailer is cheapest, the percentage gap against the market leader, category-level differences, and the financial effect of switching stores.
| ZIP | Market | Lowest Chain | Basket Cost ($) | Highest Chain | Highest Cost ($) | Gap ($) | Gap (%) | Lowest 25 Items ($) | Middle 100 Items ($) | Highest 25 Items ($) | Produce Gap (%) | Meat Gap (%) | Pantry Gap (%) | Estimated Monthly Gap ($) |
|---|---|---|---|---|---|---|---|---|---|---|---|---|---|---|
| 75001 | Dallas, TX | Walmart | 482.40 | Safeway* | 548.75 | 66.35 | 13.8 | 61.20 | 319.40 | 101.80 | 19.3 | 21.0 | 15.2 | 265.40 |
| 45202 | Cincinnati, OH | Aldi | 458.90 | Publix* | 526.45 | 67.55 | 14.7 | 58.40 | 304.70 | 95.80 | 18.6 | 20.4 | 14.8 | 270.20 |
| 60601 | Chicago, IL | Aldi | 458.90 | Safeway* | 548.75 | 89.85 | 19.6 | 57.80 | 305.30 | 95.80 | 24.1 | 26.7 | 19.1 | 359.40 |
| 98101 | Seattle, WA | Costco | 471.35 | Safeway* | 548.75 | 77.40 | 16.4 | 60.30 | 312.50 | 98.55 | 21.7 | 24.8 | 17.5 | 309.60 |
| 55401 | Minneapolis, MN | Aldi | 458.90 | Target | 514.80 | 55.90 | 12.2 | 59.70 | 303.20 | 96.00 | 16.5 | 18.9 | 13.8 | 223.60 |
| 33101 | Miami, FL | Aldi | 458.90 | Publix | 526.45 | 67.55 | 14.7 | 58.60 | 304.80 | 95.50 | 20.2 | 22.5 | 15.7 | 270.20 |
| 83702 | Boise, ID | Aldi | 458.90 | Albertsons | 531.20 | 72.30 | 15.8 | 57.90 | 305.60 | 95.40 | 21.4 | 23.6 | 16.2 | 289.20 |
| 78701 | Austin, TX | H-E-B | 475.60 | Target | 514.80 | 39.20 | 8.2 | 62.10 | 315.20 | 98.30 | 13.8 | 15.7 | 11.4 | 156.80 |
| 94105 | San Francisco, CA | Walmart | 482.40 | Safeway | 548.75 | 66.35 | 13.8 | 63.20 | 317.80 | 101.75 | 22.8 | 25.1 | 18.6 | 265.40 |
| 49503 | Grand Rapids, MI | Aldi | 458.90 | Target | 514.80 | 55.90 | 12.2 | 58.90 | 304.50 | 95.50 | 16.8 | 19.1 | 14.1 | 223.60 |
*Chains not operating directly in a particular ZIP would normally be excluded from an actual ZIP-level comparison; these benchmark rows are presented as a normalized national analytical framework rather than a live store-availability claim.
The modeled results highlight another important concept: Multi-Retailer Grocery Price Data Scraping should not simply collect product prices. It should capture the context surrounding every observation.
A useful record should contain retailer, store ID, ZIP code, product name, brand, category, package size, unit price, promotional price, regular price, timestamp, availability status, and product identifier.
This allows analysts to distinguish genuine price differences from pack-size differences and temporary promotions.
Meat generally produces larger dollar differences than many packaged grocery categories because individual price changes have a greater effect on the basket total. Produce can also demonstrate significant variation because of seasonality, sourcing, local availability, and perishability.
Pantry categories tend to offer a larger private-label opportunity. Retailers with strong store brands can use private-label products to create lower basket totals while maintaining competitive margins.
This makes US Grocery Pricing Intelligence Data useful for identifying where retailers are truly differentiated.
For CPG manufacturers, category managers can analyze where branded products command premiums and where private-label competition is strongest. For grocery marketplaces, the same data can support dynamic price comparisons, substitution recommendations, and location-aware shopping experiences.
A national grocery price index can answer whether prices are generally rising, but it cannot fully answer the question consumers and retailers increasingly care about: Where is my basket cheapest?
USDA's Food-at-Home Monthly Area Prices dataset demonstrates the value of geographically segmented food-price analysis, providing price information across multiple geographic areas and food categories.
ZIP-level tracking extends that principle into retailer-specific competitive intelligence.
For example, a retailer may be inexpensive nationally but relatively expensive within a particular metropolitan market. Conversely, a regional chain may outperform national competitors in its strongest operating markets.
The research therefore recommends three levels of measurement:
This hierarchy prevents broad averages from hiding local pricing opportunities.
A robust Grocery Data Scraping program can continuously capture prices and convert individual observations into structured competitive intelligence.
Retailers can monitor competitor price movements, identify products where their pricing is uncompetitive, evaluate promotional effectiveness, and measure basket-level positioning.
Brands can track the retail price of their products across regions and understand where promotional intensity is increasing.
Marketplaces can use the dataset to build price comparison tools, shopping recommendations, basket optimization engines, and localized grocery intelligence dashboards.
The same architecture can also support Grocery Store Datasets containing store locations, product catalogs, prices, promotions, availability, categories, brands, and ZIP-level competitive metrics.
The 2026 grocery environment makes this type of monitoring increasingly important. BLS reported that food-at-home prices were 2.2% higher year over year in August 2026. Earlier in 2026, grocery inflation had accelerated further, demonstrating why periodic price snapshots can quickly become outdated.
At the same time, pricing technology is attracting greater scrutiny. Maryland became the first U.S. state to prohibit dynamic grocery pricing in October 2026, highlighting growing consumer and regulatory attention around electronic pricing systems.
These developments increase the value of transparent, timestamped grocery price datasets. Historical records can show whether a price change was isolated, seasonal, promotional, regional, or part of a longer trend.
The US Grocery Price Gap Report 2026 demonstrates why a standardized 150-item basket should be analyzed across retailers and ZIP codes rather than through one national grocery average. The benchmark shows that meaningful price gaps can exist between chains, categories, and markets even when shoppers purchase identical products.
For a complete retail intelligence ecosystem, analysts can combine method to Scrape Food Delivery API Data with supermarket pricing to compare retail and delivered grocery economics, while Supermarket Store Locator data can connect prices to actual store coverage and competitive neighborhoods.
The next generation of grocery analytics will increasingly combine price histories, product catalogs, promotions, store locations, consumer behavior, and automated interpretation. AI Grocery Intelligence can turn these large datasets into actionable recommendations such as identifying the cheapest basket, detecting unusual price movements, forecasting category changes, and highlighting ZIP codes where competitive pressure is strongest.
Ultimately, the most valuable grocery dataset is not simply a list of prices. It is a continuously updated, location-aware view of what products cost, where they cost it, how those prices change, and which retailer offers the strongest basket economics for each market.
Are you in need of high-class scraping services? Food Data Scrape should be your first point of call. We are undoubtedly the best in Food Data Aggregator and Mobile Grocery App Scraping service and we render impeccable data insights and analytics for strategic decision-making. With a legacy of excellence as our backbone, we help companies become data-driven, fueling their development. Please take advantage of our tailored solutions that will add value to your business. Contact us today to unlock the value of your data.