
A new restaurant makes most of its supplier decisions in the weeks before and just after it opens. It chooses a POS system, a payment provider, a delivery aggregator plan, a beverage partner, a packaging supplier and a distributor for its dry goods. If your sales team reaches the outlet three months later, those decisions are usually made.
That is why a request Food Data Scrape received in September 2026 is so common among food-service sellers: "A monthly incremental database of newly opened restaurants in Mumbai, from Zomato, Swiggy and Google Maps." This guide explains how New Restaurant Data Scraping works, what signals reveal a genuine new opening, and how sales teams turn the data into pipeline.
Who needs a new-restaurant feed
| Team | What they sell | Why timing matters |
|---|---|---|
| POS and restaurant software vendors | Billing, inventory, online ordering | The system is chosen before opening day |
| Payment and lending providers | Card machines, working capital | New outlets need both immediately |
| FMCG HoReCa teams | Beverages, sauces, dairy, oils | Menu and supplier listings are set early |
| Distributors and wholesalers | Dry goods, packaging, cleaning supplies | First suppliers often become long-term suppliers |
| Interior, equipment and signage firms | Kitchen equipment, furniture | Purchases happen before launch |
| Marketing agencies | Launch campaigns, listings optimisation | The first 90 days decide ratings momentum |
What counts as a "new" restaurant?
This is the most important question in new restaurant data scraping. A listing appearing for the first time on a platform does not always mean a new outlet opened. It could be an old outlet that just joined delivery, a rebrand, a cloud-kitchen brand added to an existing kitchen, or a duplicate listing. A good feed uses several signals together:
- First seen date. The first month the outlet appears in any of the tracked sources.
- No earlier match. No listing with a similar name at the same location existed before.
- Low rating count. A genuinely new outlet usually has few ratings in its first weeks.
- "New" or "Newly opened" labels where a platform shows them.
- Address match against closed outlets. A new name at an address where another outlet recently closed is often a takeover, which is still a valuable lead.
Each record is tagged with an opening type so sales teams can prioritise.
| Opening type | Description | Sales priority |
|---|---|---|
| New outlet | New name, new location, no earlier listing | Highest |
| Takeover | New name at a location where another outlet recently closed | High |
| New branch | New location of an existing chain | High for distributors, medium for POS |
| New virtual brand | New brand name operating from an existing kitchen | Medium |
| Newly listed | Existing outlet joining a platform for the first time | Medium |
How the monthly pipeline works
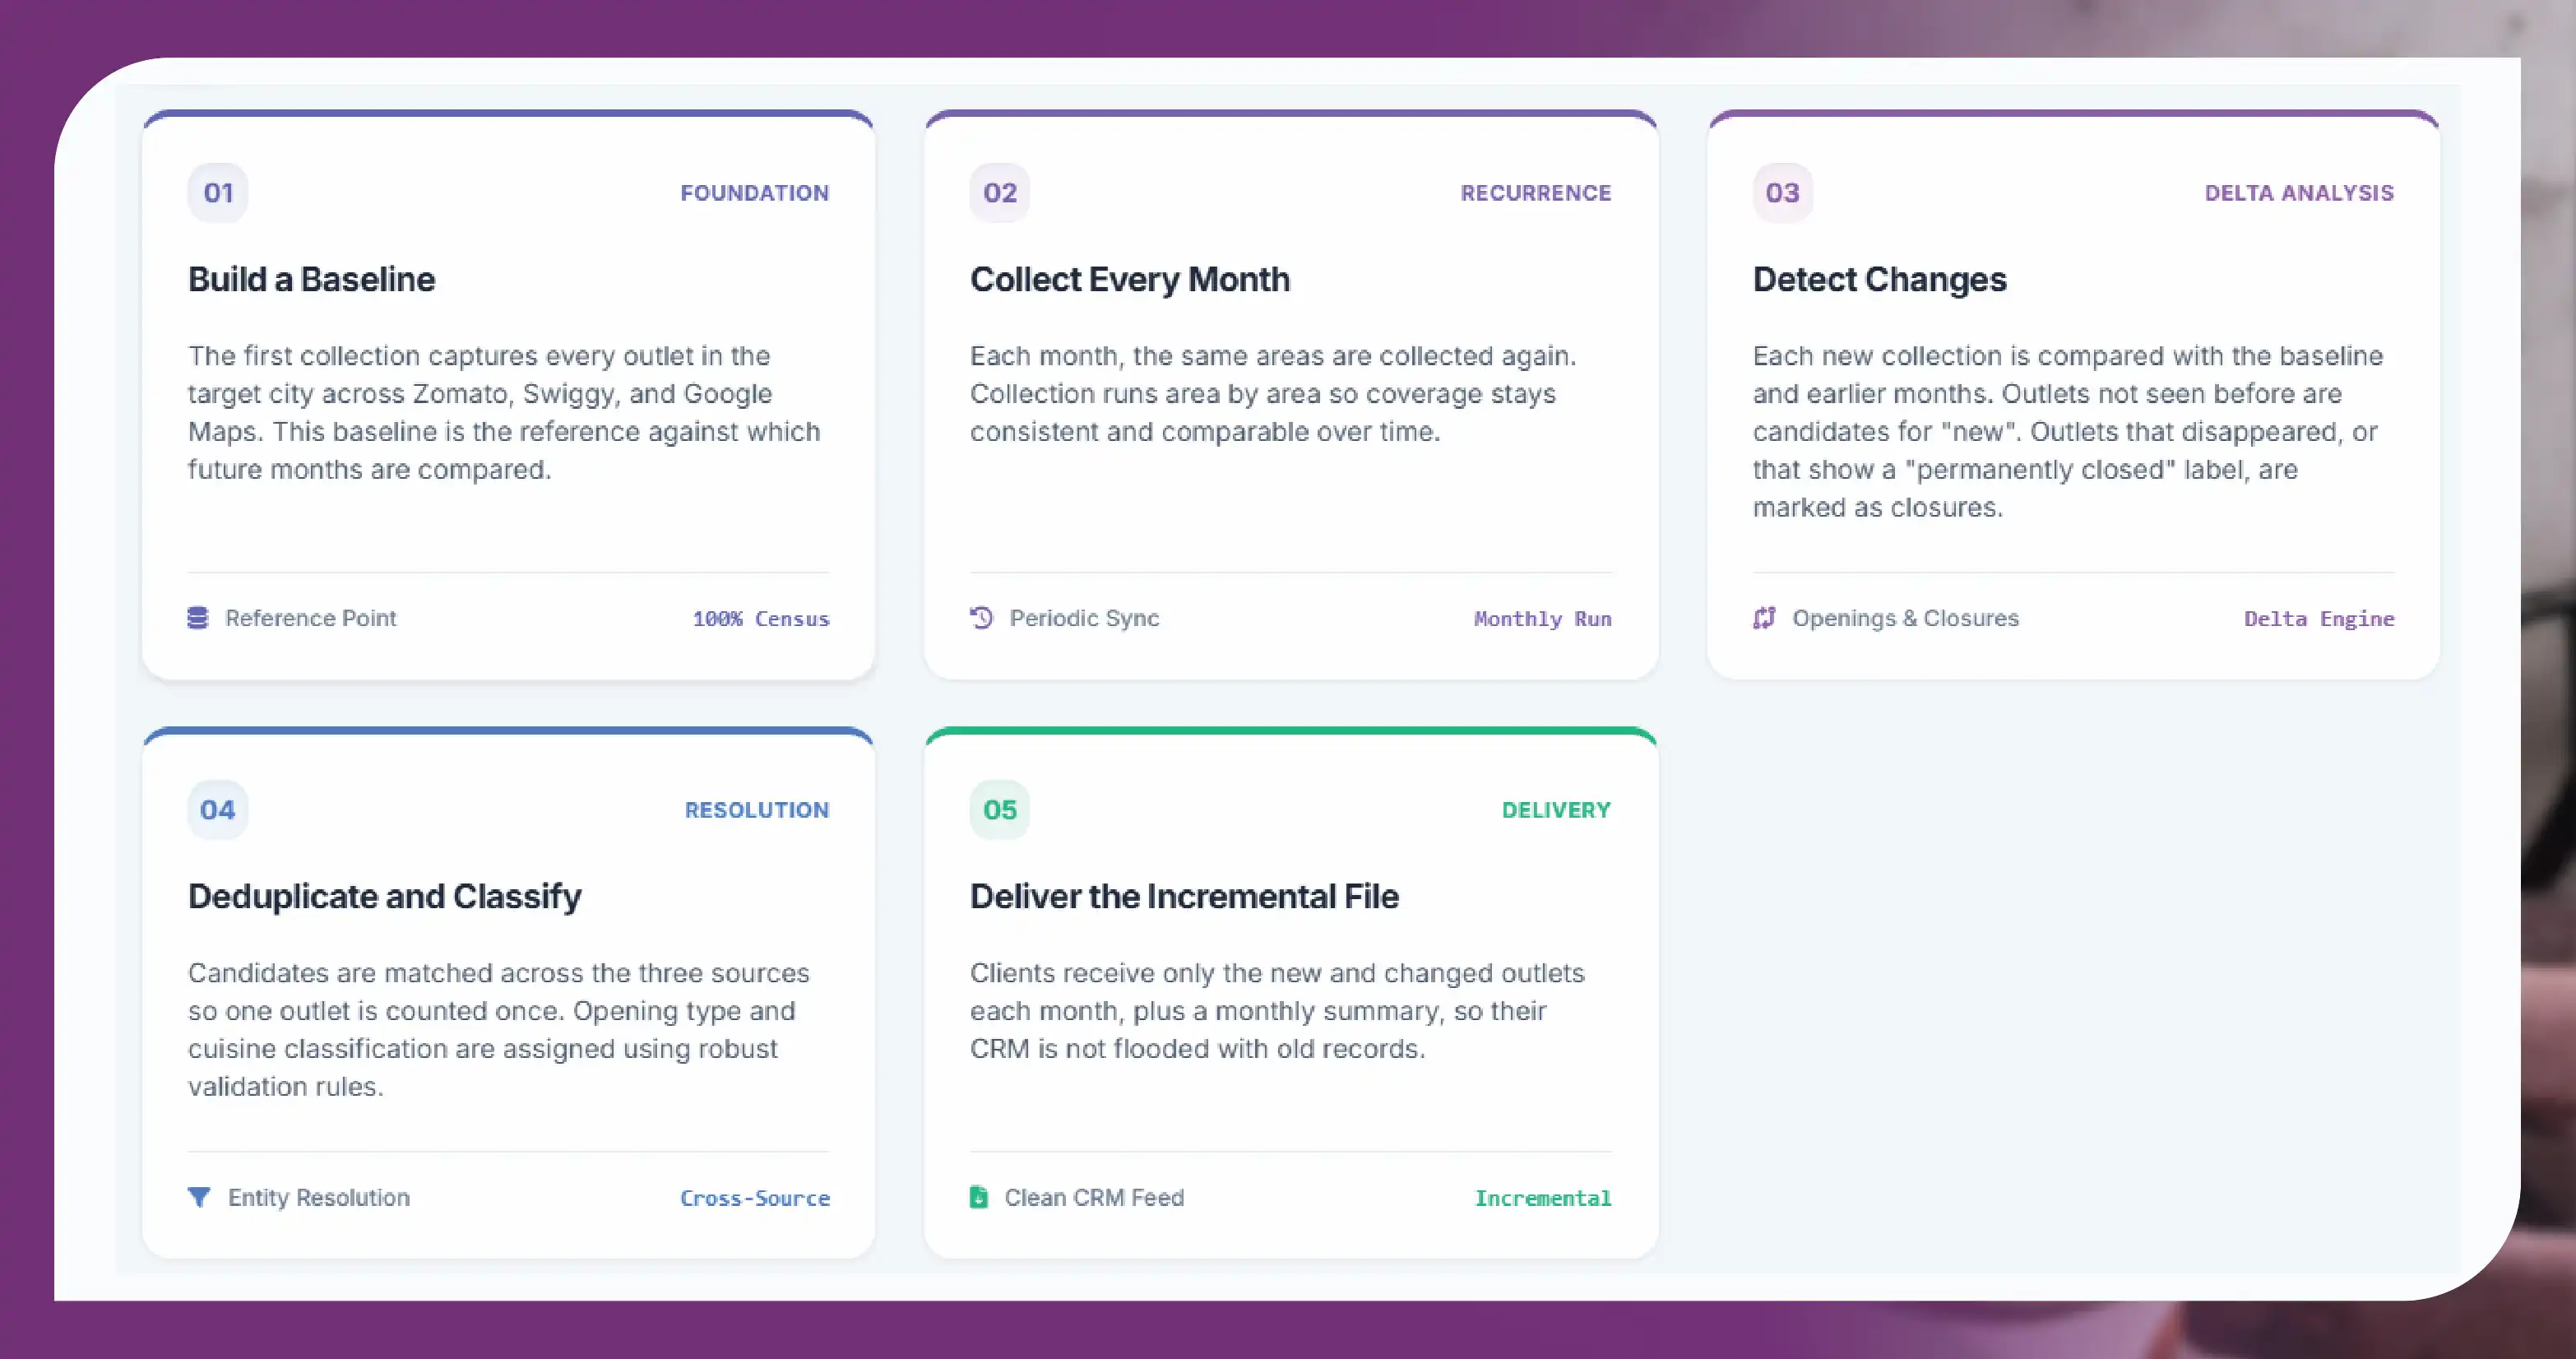
Step 1: Build a baseline
The first collection captures every outlet in the target city across Zomato, Swiggy and Google Maps. This baseline is the reference against which future months are compared.
Step 2: Collect every month
Each month, the same areas are collected again. Collection runs area by area so coverage stays consistent.
Step 3: Detect changes
Each new collection is compared with the baseline and earlier months. Outlets not seen before are candidates for "new". Outlets that disappeared, or that show a "permanently closed" label, are marked as closures.
Step 4: Deduplicate and classify
Candidates are matched across the three sources so one outlet is counted once. Opening type is assigned using the rules above.
Step 5: Deliver the incremental file
Clients receive only the new and changed outlets each month, plus a monthly summary, so their CRM is not flooded with old records.
Sample record
The record below is illustrative.
{
  "outlet_uid": "FDS-MUM-2026-10-00412",
  "outlet_name": "Example Coastal Kitchen",
  "opening_type": "takeover",
  "first_seen_month": "2026-10",
  "address": "Shop 3, Example Road, Andheri West",
  "pincode": "400053",
  "city": "Mumbai",
  "latitude": 19.1364,
  "longitude": 72.8296,
  "cuisines": ["Seafood", "Konkan"],
  "price_band": "INR 800-1200 for two",
  "sources": ["zomato", "google_maps"],
  "google_rating_count": 14,
  "delivery_available": true,
  "public_business_phone": "Listed on Google Maps",
  "previous_outlet_at_address": "Example Cafe (closed 2026-08)"
}
| Month | New outlets | Takeovers | New branches | Closures | Net change |
|---|---|---|---|---|---|
| Jul 2026 | 212 | 48 | 61 | 175 | +146 |
| Aug 2026 | 198 | 52 | 55 | 190 | +115 |
| Sep 2026 | 236 | 44 | 70 | 168 | +182 |
All figures are illustrative for one large metro.
Turning the feed into sales pipeline
- Route by pincode. Assign each new outlet to the sales rep who owns that pincode.
- Score by fit. Weight leads by cuisine, price band and delivery status. A premium dine-in restaurant needs a different pitch from a cloud kitchen.
- Act within two weeks. Set a target to contact every high-priority lead within 14 days of the monthly file arriving.
- Track conversion by opening type. Over a few months you will see which opening types convert best for your product.
- Use closures too. Closures show churn risk among your existing customers and free up territory capacity.
What the data reveals about a city's food scene
Beyond sales leads, a monthly openings feed tells a story about where a city's food market is heading. Over six months, teams typically see patterns such as:
- Cuisine momentum. Which cuisines are opening fastest, for example Korean, Asian bowls, healthy cafés or regional Indian cuisines.
- Neighbourhood growth. Which pincodes add the most outlets, often areas with new offices or residential projects.
- Format shifts. The balance between dine-in, delivery-only and cafés.
- Churn hotspots. Streets where outlets open and close quickly, which can signal high rents or oversupply.
| Cuisine (Mumbai, last 6 months, illustrative) | New outlets | Closures | Net change |
|---|---|---|---|
| Cafés and bakeries | 210 | 120 | +90 |
| North Indian | 180 | 165 | +15 |
| Asian and Korean | 95 | 30 | +65 |
| Healthy bowls and salads | 60 | 25 | +35 |
| Pizza | 70 | 62 | +8 |
These trends help FMCG brands decide which product lines to push to the food-service channel and help distributors plan inventory.
Building the feed into your CRM
A practical integration usually follows four steps:
- Map fields. Match the feed fields (outlet name, address, pincode, cuisine, opening type) to your CRM's lead fields.
- Deduplicate against existing accounts. Compare new outlets with your current customer list so reps do not chase customers you already have.
- Assign owners automatically. Use pincode or city rules to assign each lead.
- Track outcomes. Add a field for "source: new restaurant feed" so you can measure conversion and return on investment.
Expanding beyond one city
Most teams start with one city, prove the conversion rate, then expand. Mumbai, Bengaluru, Delhi NCR, Hyderabad, Pune and Chennai together account for a large share of India's organised restaurant openings. Tier-2 cities such as Ahmedabad, Jaipur, Lucknow, Indore and Kochi often show faster percentage growth, which makes them attractive for distributors building early share.
Data and privacy boundaries
New restaurant data scraping collects business information that outlets publish themselves: outlet name, address, cuisine, price band, ratings and any public business phone number. Food Data Scrape does not provide personal phone numbers or private details of owners or staff. Sales teams should use the business contact routes the outlet has chosen to publish.
Questions
Frequently Asked Questions
Most new outlets appear within one monthly cycle of listing on any of the three sources. Weekly collection is available for teams that need faster alerts.
Yes. Coverage can be set by city, district, state or a list of pincodes.
Yes. Cloud kitchens and virtual brands are tagged separately, so you can include or exclude them.
CSV or Excel for CRM upload, JSON for API use, or a direct push into your CRM where an integration is available.
Key takeaways
- New outlets choose most suppliers early, so reaching them in the first month matters.
- Accurate new restaurant data scraping depends on a baseline, cross-source deduplication and clear opening types.
- Incremental monthly files keep CRMs clean and sales teams focused.
- Business-level data only; no personal contact data.
Start your new-restaurant feed
Food Data Scrape delivers monthly new restaurant data scraping feeds for Mumbai and any Indian city you choose. Share your target cities and the fields your sales team uses, and we will send a sample of last month's openings.
Get a Free Food Data Sample in 48 Hours.
Tell us your platforms, target markets and required fields — we'll map exactly what's possible with food data scraping, recommend the right approach, and send a working sample so you can verify quality before any commitment.
Request a strategy call
Thanks — our data team will reach out within 48 hours with your sample.



