
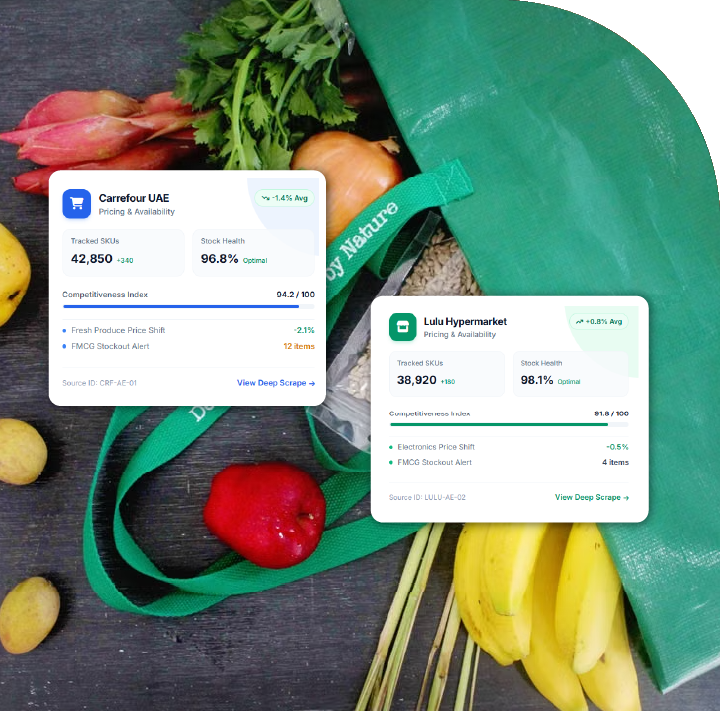
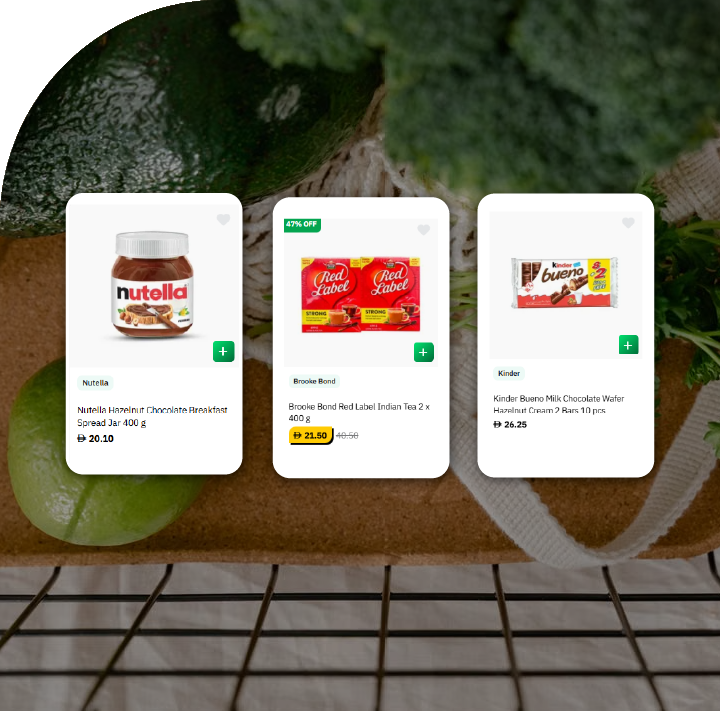
Data Intelligence: Structured grocery records enable precise competitive market analysis.
Price Monitoring: Historical prices reveal important competitive pricing movements.
Assortment Analysis: Brand coverage highlights emerging competitive assortment opportunities.
Availability Tracking: Frequent monitoring identifies recurring product availability disruptions.
API Integration: Automated feeds support dashboards, analytics, and reporting.

The UK grocery industry is rapidly evolving from a traditional store-led marketplace into a highly competitive digital ecosystem where prices, promotions, product availability, assortment, and customer-facing information can change throughout the day. Online grocery platforms generate a rich stream of commercial information that can help retailers, brands, market researchers, pricing teams, and technology companies understand competitive movements at product level.
Ocado & Waitrose Product Data scraping provides a structured approach to collecting publicly displayed grocery information and transforming it into usable datasets for market intelligence. Product names, categories, brands, pack sizes, prices, promotional offers, availability, nutritional attributes, and product descriptions can be organized into standardized records for further analysis.
A comprehensive Ocado & Waitrose grocery product dataset can help businesses compare product assortments, identify category gaps, evaluate brand positioning, and monitor changes over time. Instead of relying on occasional manual checks, organizations can establish recurring data collection workflows that create historical records for trend analysis.
Meanwhile, Ocado & Waitrose price monitoring allows analysts to observe price movements across comparable products, identify promotional cycles, calculate price differences, and understand how competitive positioning changes across categories. This is particularly useful in an environment where shoppers increasingly compare online prices before completing purchases.
The broader objective of UK supermarket product data Scraping is to turn fragmented digital catalog information into a consistent intelligence layer. When data is collected at regular intervals and properly normalized, businesses can identify patterns that are difficult to see through manual research.
Online supermarket catalogs contain far more information than a simple product-price combination. A modern grocery dataset can capture commercial, descriptive, availability, and promotional attributes that together provide a detailed picture of the digital shelf.
Ocado & Waitrose supermarket data scrape initiatives can be configured around different business objectives. A pricing team may prioritize product prices and promotions, while a brand may focus on assortment, competitor products, availability, and pack sizes. A market research company may require a much broader historical dataset covering thousands of SKUs.
Ocado product data scraping can support the creation of structured product records containing identifiers, names, categories, brands, prices, pack sizes, descriptions, images, availability indicators, dietary information, and promotional attributes where publicly displayed.
Likewise, Waitrose product data scraping can help create a structured view of grocery assortment and commercial positioning. Historical records can reveal when products enter or leave an online catalog, when prices change, and how promotional activity varies across categories.
The value increases further when products are normalized. A retailer might sell comparable products in different package sizes, making direct price comparison misleading. Calculating unit prices per kilogram, litre, or item can provide a more meaningful competitive benchmark.
| Data Category | Dataset Field | Example | Purpose | Recommended Frequency | Analysis Level | Priority |
|---|---|---|---|---|---|---|
| Identification | Product ID | OC-45821 | Unique record matching | Daily | SKU | Critical |
| Identification | Product Name | British Strawberries | Product recognition | Daily | SKU | Critical |
| Identification | Brand | Waitrose | Brand benchmarking | Daily | Brand | Critical |
| Classification | Main Category | Fruit & Vegetables | Category analysis | Daily | Category | High |
| Classification | Subcategory | Fresh Berries | Detailed assortment analysis | Daily | Subcategory | High |
| Commercial | Regular Price | £3.50 | Benchmark pricing | Multiple daily | SKU | Critical |
| Commercial | Promotional Price | £2.75 | Promotion tracking | Multiple daily | SKU | Critical |
| Commercial | Discount Rate | 21.4% | Discount-depth analysis | Multiple daily | SKU | High |
| Commercial | Offer Type | Multibuy | Promotional strategy | Multiple daily | SKU | High |
| Packaging | Pack Size | 400g | Product comparison | Daily | SKU | Critical |
| Packaging | Unit Price | £6.88/kg | Normalized benchmarking | Daily | SKU | Critical |
| Availability | Stock Status | Available | Stock monitoring | Multiple daily | SKU | Critical |
| Availability | Delivery Eligibility | Available | Delivery analysis | Multiple daily | SKU | High |
| Content | Product Description | Fresh British berries | Catalog enrichment | Weekly | SKU | Medium |
| Content | Dietary Attribute | Vegan | Consumer segmentation | Weekly | SKU | Medium |
| Nutrition | Energy | 35 kcal/100g | Nutritional analysis | Weekly | SKU | Medium |
| Media | Image URL | Product image | Visual catalog research | Weekly | SKU | Low |
| Reputation | Rating | 4.5/5 | Product evaluation | Weekly | SKU | Medium |
| Reputation | Review Count | 180 | Popularity indicator | Weekly | SKU | Medium |
| Tracking | First Seen | 2026-06-10 | Product launch detection | Continuous | SKU | High |
| Tracking | Last Seen | 2026-08-19 | Catalog continuity | Continuous | SKU | High |
| Tracking | Collection Timestamp | 19-Aug-2026 09:00 | Historical analysis | Every extraction | Dataset | Critical |
Pricing is one of the most valuable dimensions of grocery data because even small changes can affect competitiveness, customer perception, and category performance.
A historical dataset allows organizations to compare regular prices with promotional prices and calculate discount depth. Instead of simply recording that a product is discounted, analysts can determine how often the discount occurs, how long it remains active, and whether competing products experience similar changes.
Unit-price normalization is equally important. Comparing a 500g product with a 750g product using headline prices can produce an inaccurate conclusion. Converting prices into standardized units allows analysts to compare equivalent products more effectively.
Promotional intelligence can also identify recurring patterns. For instance, a dataset may reveal that certain categories receive heavier discounts during weekends, holidays, seasonal events, or specific shopping periods.
| KPI | Period 1 | Period 2 | Change | Change % | What It Indicates | Business Application | Alert Level |
|---|---|---|---|---|---|---|---|
| Products Tracked | 52,400 | 54,150 | +1,750 | +3.34% | Catalog expansion | Assortment planning | Medium |
| Average SKU Price | £5.14 | £5.28 | +£0.14 | +2.72% | General price movement | Pricing strategy | High |
| Median SKU Price | £3.49 | £3.59 | +£0.10 | +2.87% | Typical product movement | Market benchmarking | High |
| Promotional SKUs | 7,280 | 8,140 | +860 | +11.81% | Increased promotional activity | Promotion strategy | High |
| Average Discount | 15.6% | 17.2% | +1.6 pp | +10.26% | Deeper promotional pricing | Competitive analysis | High |
| Out-of-Stock Rate | 3.8% | 4.6% | +0.8 pp | +21.05% | Availability pressure | Inventory planning | Critical |
| New SKUs Detected | 610 | 790 | +180 | +29.51% | New product introductions | Innovation tracking | Medium |
| Removed SKUs | 420 | 510 | +90 | +21.43% | Assortment rationalization | Portfolio analysis | Medium |
| Private-Label SKUs | 13,850 | 14,460 | +610 | +4.40% | Own-brand expansion | Retail strategy | High |
| Organic SKUs | 4,620 | 4,910 | +290 | +6.28% | Organic assortment growth | Consumer trend research | Medium |
| Plant-Based SKUs | 3,180 | 3,540 | +360 | +11.32% | Emerging category growth | Category forecasting | High |
| Multibuy Offers | 2,460 | 2,920 | +460 | +18.70% | Stronger multibuy activity | Promotion benchmarking | High |
| Seasonal SKUs | 1,150 | 1,480 | +330 | +28.70% | Seasonal range expansion | Seasonal planning | Medium |
| Average Unit Price | £8.42/kg | £8.67/kg | +£0.25 | +2.97% | Normalized inflation | Price comparison | High |
| Beverage SKUs | 7,180 | 7,460 | +280 | +3.90% | Beverage assortment movement | Category analysis | Medium |
| Fresh Food SKUs | 9,240 | 9,580 | +340 | +3.68% | Fresh-category expansion | Assortment planning | High |
| Household SKUs | 6,140 | 6,390 | +250 | +4.07% | Non-food grocery growth | Portfolio analysis | Medium |
| Average Availability | 94.7% | 93.9% | -0.8 pp | -0.84% | Slight availability deterioration | Supply monitoring | Critical |
| New Brands Identified | 95 | 124 | +29 | +30.53% | Greater brand diversity | Market discovery | Medium |
| Price Changes Detected | 8,620 | 10,240 | +1,620 | +18.79% | Higher pricing volatility | Dynamic monitoring | Critical |
The figures in both tables are illustrative examples showing how a grocery intelligence system can structure and analyze product-level metrics; they are not live measurements of Ocado or Waitrose.
Competitive Intelligence: Retailers and brands can compare product prices, promotional intensity, category breadth, and product availability. This enables teams to identify competitive advantages and areas where their own digital shelf position may need improvement.
Assortment Intelligence: Counting products by category, brand, pack size, and product type can reveal where competitors are expanding or reducing their range. This information can support assortment planning and portfolio decisions.
Price-Change Detection: Automated monitoring can detect changes between successive product observations. Businesses can establish alerts when important products move beyond predefined price thresholds.
Promotion Analysis: Historical promotional records can reveal discount frequency, average discount depth, promotional duration, and offer types. This helps companies understand how aggressively competitors use promotions.
Availability Monitoring: Repeated observations can be used to calculate product availability rates. Brands can identify recurring stock-out patterns and examine whether specific categories or products are consistently affected.
Product Launch Tracking: Comparing historical catalog snapshots can reveal newly introduced products and brands. This creates an early-warning mechanism for emerging categories and competitor assortment expansion.
A successful scraping project should not treat every extraction as an isolated task. Each observation should be timestamped and associated with a stable product identifier wherever possible.
Historical storage makes it possible to reconstruct the digital shelf at a particular point in time. Analysts can then investigate questions such as when a price changed, how long a promotion lasted, whether a product disappeared temporarily, and whether an assortment expansion was permanent.
Data quality is equally important. Duplicate products, inconsistent categories, changing product names, incomplete pack-size information, and temporary availability messages can create analytical errors if they are not handled systematically.
A robust pipeline should therefore include extraction, validation, normalization, deduplication, product matching, historical storage, and quality checks. Price fields should be converted into numeric formats, pack sizes standardized, and timestamps retained for every observation.
Scrape Online Ocado Grocery Delivery App Data to focus on product names, categories, prices, and availability, while an advanced project can include promotional information, nutritional attributes, pack sizes, product identifiers, and historical snapshots.
For applications requiring frequent intelligence, scheduled collection can create multiple observations throughout the day. This is particularly useful for detecting short-lived promotional changes or availability movements.
Data can subsequently be delivered in formats such as CSV, Excel, JSON, relational databases, cloud storage, or API-compatible structures. The appropriate delivery format depends on whether the final objective is reporting, dashboarding, analytics, machine learning, or integration with another business system.
Waitrose Grocery Dataset From UK can provide a structured foundation for examining online grocery assortment, category composition, pricing, product availability, and promotional activity.
Researchers can organize the dataset around product identifiers, product names, brands, categories, subcategories, pack sizes, prices, unit prices, offers, and collection timestamps. Over time, these observations can become a historical research resource for understanding digital supermarket behavior.
The dataset can also support brand-level analysis. Businesses can identify the number of products associated with different brands, compare price positioning, track new product introductions, and evaluate how product ranges evolve.
Once collected and validated, grocery data can be integrated into business intelligence platforms and automated workflows. A pricing team may receive daily price-change feeds, while a research organization may require a historical database containing millions of observations.
An API-oriented delivery model can provide structured records to dashboards, applications, pricing engines, or internal analytics systems. Cloud-based storage can also support large historical datasets while allowing multiple teams to access standardized information.
The most valuable systems combine data collection with analytics. Instead of delivering thousands of raw product records, the platform can calculate price changes, promotional rates, availability percentages, category movements, and competitor benchmarks automatically.
Digital grocery platforms have transformed supermarket intelligence by making product-level information increasingly accessible for structured market analysis. Regularly collected data can reveal changes in pricing, promotions, assortment, availability, packaging, and competitive positioning that are difficult to identify through occasional manual research.
An Ocado Grocery Dataset can support detailed analysis of product assortment, pricing, promotions, availability, brands, categories, and historical market movements. When maintained over time, it can become a valuable foundation for competitive intelligence, pricing analytics, category research, and digital shelf monitoring.
A Waitrose Alcohol Products Dataset can provide structured information for studying beverage assortment, pack sizes, pricing, promotional patterns, and availability, while ensuring that any downstream use complies with applicable age-related, legal, platform, and data-use requirements.
An Ocado Grocery Scraping API can further streamline the movement of structured grocery intelligence into dashboards, databases, pricing systems, research platforms, and analytical applications. The strongest solution combines consistent extraction with normalization, historical storage, validation, monitoring, and automated reporting.
Ultimately, the competitive advantage does not come from collecting product records alone. It comes from converting continuously changing digital grocery information into reliable historical intelligence. By tracking the right fields at the right frequency, businesses can understand competitive price movements, discover assortment opportunities, monitor promotional strategies, identify availability risks, and make faster evidence-based decisions across the UK grocery market.
Are you in need of high-class scraping services? Food Data Scrape should be your first point of call. We are undoubtedly the best in Food Data Aggregator and Mobile Grocery App Scraping service and we render impeccable data insights and analytics for strategic decision-making. With a legacy of excellence as our backbone, we help companies become data-driven, fueling their development. Please take advantage of our tailored solutions that will add value to your business. Contact us today to unlock the value of your data.