

Introduction
Ten minutes changed everything.
Quick commerce did not simply compress delivery times — it rewrote the retail rulebook. When groceries arrive in ten minutes, the shopping basket shrinks, the purchase becomes impulsive, brand loyalty weakens, and price comparison happens on a single screen. India's quick commerce market has scaled past the USD 5 billion mark and continues to compound, and it has done so by fragmenting the country into thousands of tiny, independently managed dark store catchments.
That fragmentation is the central fact that most brands still fail to grasp. There is no such thing as "Blinkit's price" for your product. There is a price in this pin code, a different price two kilometres away, an out-of-stock in a third, and a competitor's product occupying your shelf slot in a fourth. Your national brand manager sees one number. Reality contains ten thousand.
Q-Commerce Data Scraping is the only practical way to see that reality. At FoodDataScrape, we crawl 220M+ pages of food and grocery data every week, including pin-code-level catalogue extraction across Blinkit, Zepto, Swiggy Instamart and BigBasket. This article compares the four platforms structurally, shows what the extracted data actually looks like, and explains what CPG brands, retailers and investors do with it.
The Four Platforms Are Not Competing on the Same Axis
A surface reading says these are four apps doing the same thing. The data says otherwise.
Blinkit operates the widest dark store footprint and the deepest general merchandise expansion, which means its assortment stretches well beyond groceries. For a brand, this means shelf competition is not only from your direct category rivals but from an ever-expanding SKU universe fighting for the same limited dark store space.
Zepto has historically pushed hardest on speed and on aggressive assortment growth in dense urban catchments. Its private label expansion is a strategic threat to national brands in commodity categories.
Swiggy Instamart benefits from cross-pollination with a mature food delivery user base, which shifts its basket composition toward convenience and impulse.
BigBasket originates from planned, large-basket grocery and has adapted into quick commerce. Its catalogue depth in staples and its subscription behaviour differ structurally from the instant-first players.
The strategic consequence: the same SKU performs completely differently across these four platforms in the same city, because the shopper intent, the basket size and the shelf competition are different on each. A brand that manages all four with a single price and a single assortment strategy is leaving margin and volume on the table simultaneously.
The Dark Store Is the Real Unit of Competition
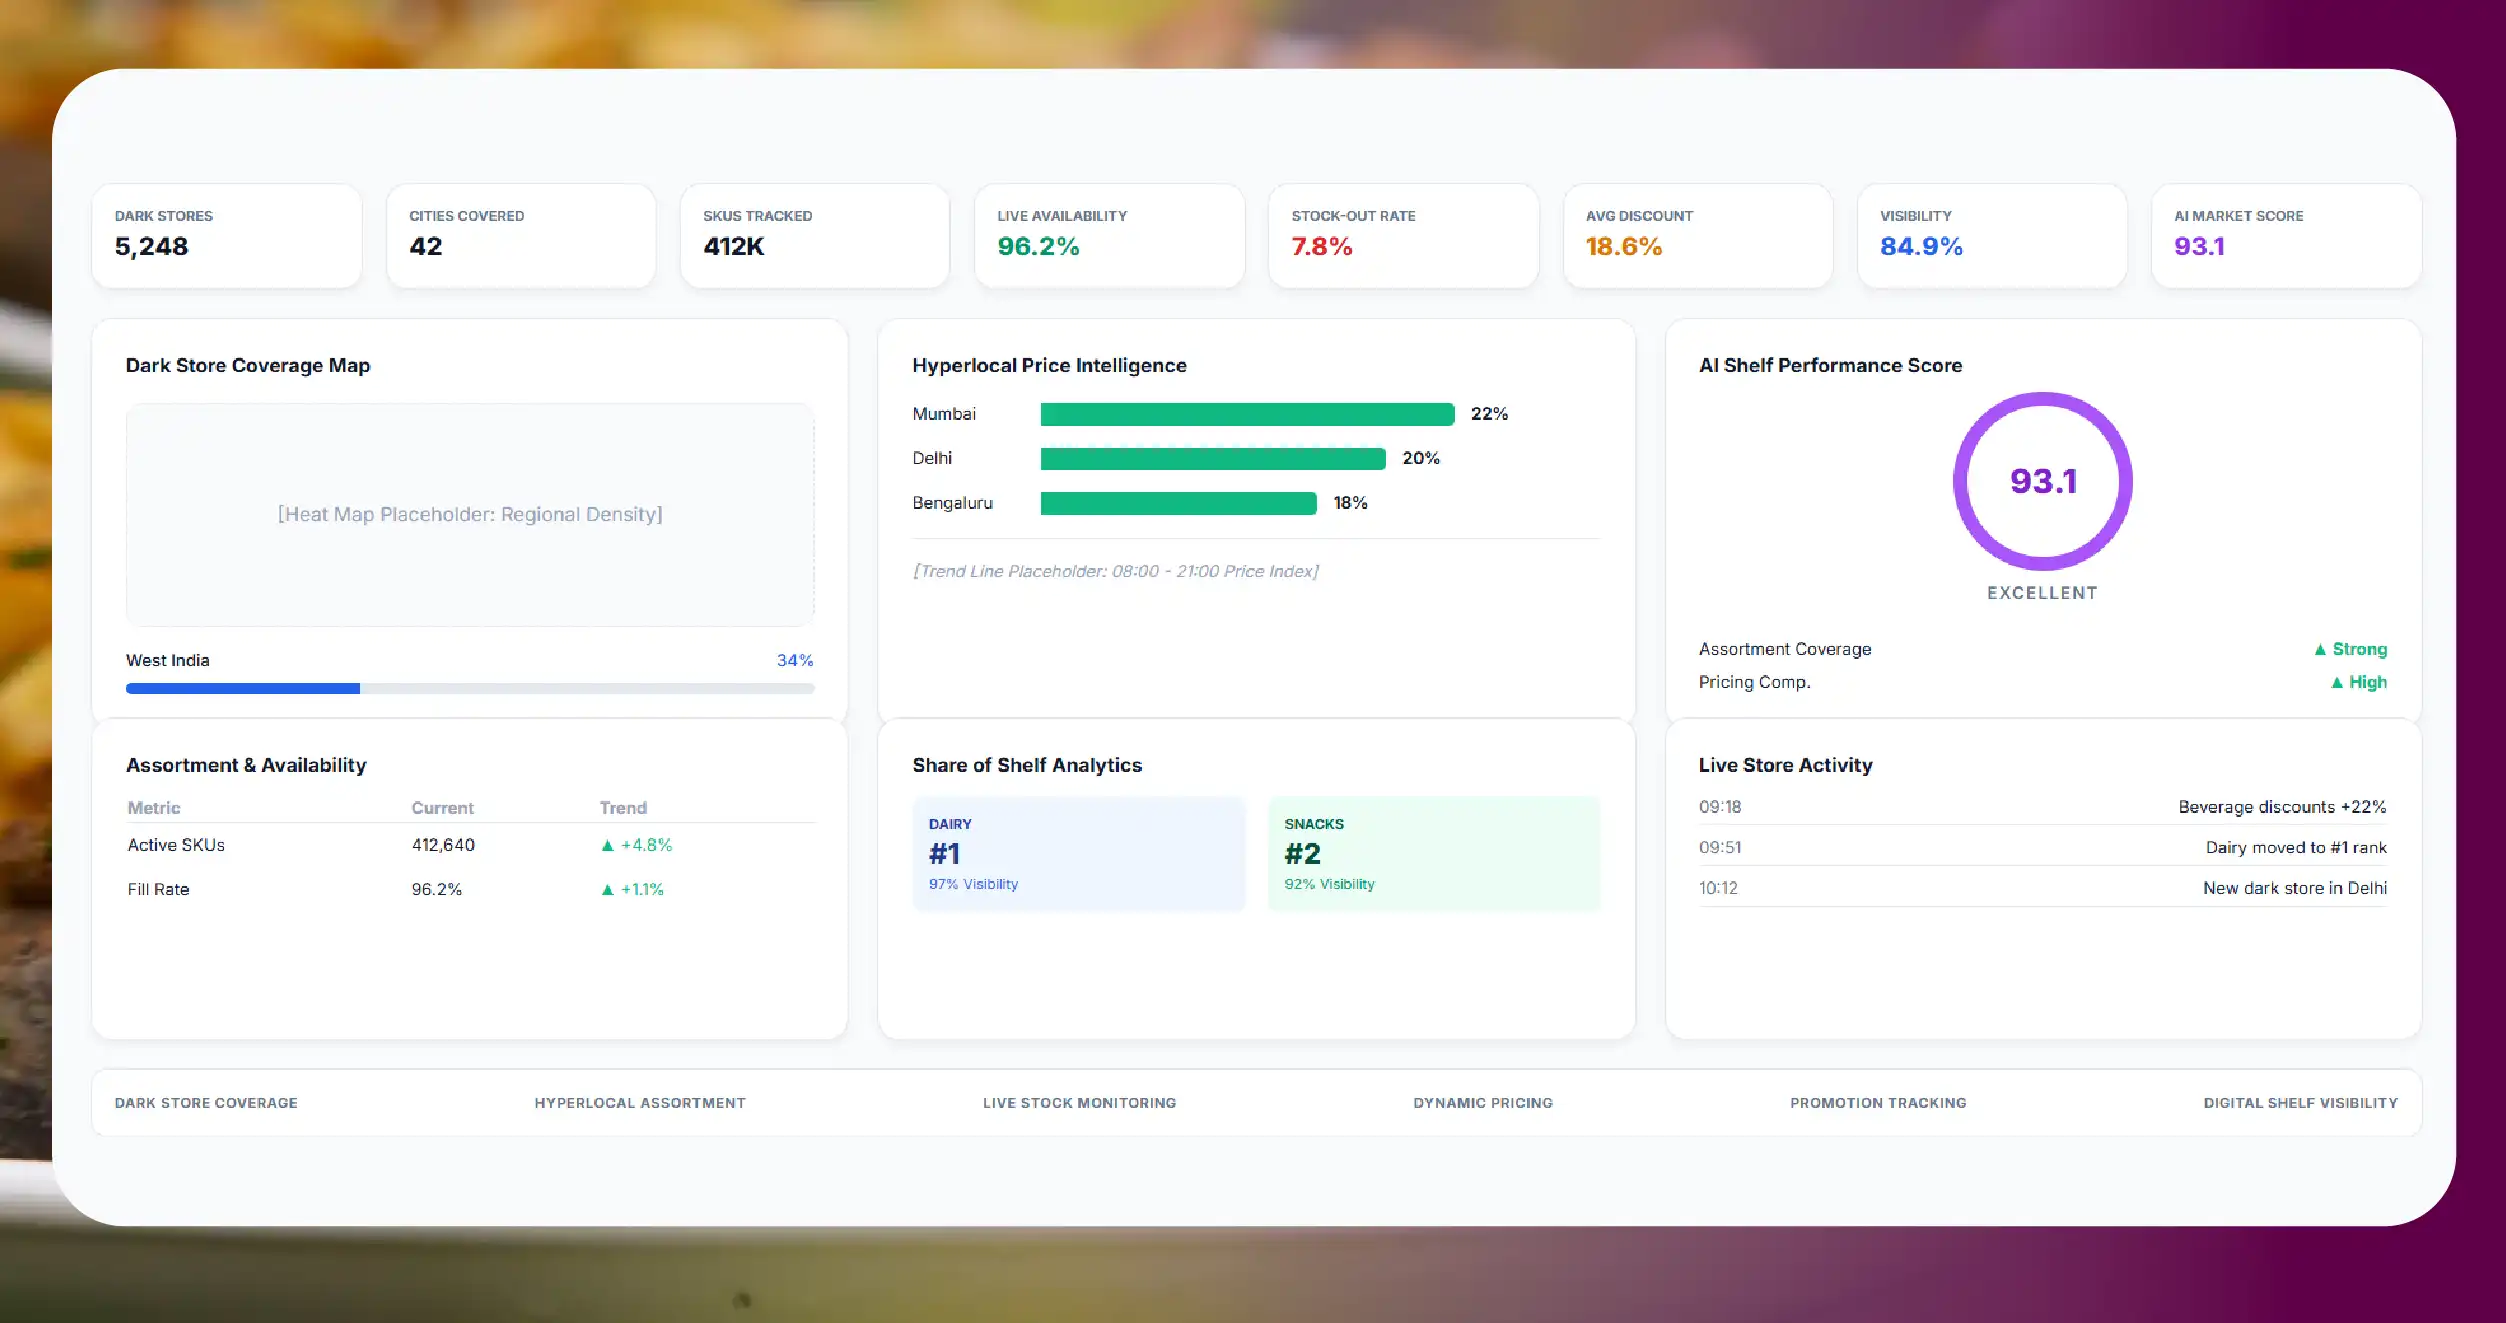
A dark store is a micro-warehouse serving a delivery radius of roughly two to three kilometres. It carries a limited SKU count — dramatically fewer than a supermarket — which means every listing slot is contested.
This creates four consequences that only granular quick commerce data extraction can measure:
-
Assortment varies by pin code. Your SKU may be listed in 60% of a platform's dark stores in Mumbai and 20% in Chennai. Your national listing count is a fiction.
-
Stock-outs are local and constant. An out-of-stock in a high-density pin code during peak hours is lost revenue that never appears in any report you receive.
-
Pricing and discounting are localised. Platforms adjust price and promotional depth by catchment based on competition and demand.
-
Share of shelf is measurable but only from the outside. Where you rank in a category listing, what appears above you, and what the platform's private label is doing to your slot — all visible, none reported to you.
Sample Data: Cross-Platform SKU Comparison
The record below shows the structure of a FoodDataScrape q-commerce extract for a single SKU across four platforms in one pin code. Values are illustrative.
                            {
  "sku_name": "Example Brand — Cold Pressed Groundnut Oil 1L",
  "category": "Edible Oils",
  "city": "Bengaluru",
  "pin_code": "560095",
  "platform_data": [
    {
      "platform": "Blinkit",
      "listed": true,
      "mrp_inr": 420,
      "selling_price_inr": 379,
      "discount_pct": 9.8,
      "in_stock": true,
      "category_rank": 4,
      "delivery_promise_min": 11
    },
    {
      "platform": "Zepto",
      "listed": true,
      "mrp_inr": 420,
      "selling_price_inr": 365,
      "discount_pct": 13.1,
      "in_stock": true,
      "category_rank": 7,
      "delivery_promise_min": 9
    },
    {
      "platform": "Swiggy Instamart",
      "listed": true,
      "mrp_inr": 420,
      "selling_price_inr": 389,
      "discount_pct": 7.4,
      "in_stock": false,
      "category_rank": 11,
      "delivery_promise_min": 13
    },
    {
      "platform": "BigBasket",
      "listed": true,
      "mrp_inr": 420,
      "selling_price_inr": 399,
      "discount_pct": 5.0,
      "in_stock": true,
      "category_rank": 3,
      "delivery_promise_min": 16
    }
  ]
}
Read that carefully. The same product, same city, same pin code, same MRP — and a ₹34 spread between the cheapest and most expensive platform, an out-of-stock on one, and a category rank ranging from 3rd to 11th.
Every one of those four numbers is a decision. The ₹34 spread is a channel conflict and a margin leak. The out-of-stock is lost revenue. The 11th-place rank is invisibility.
Sample Data: Pin-Code Assortment and Availability Grid
| Pin Code | Blinkit | Zepto | Instamart | BigBasket | Availability Score |
|---|---|---|---|---|---|
| 560095 | In Stock ₹379 | In Stock ₹365 | OOS | In Stock ₹399 | 75% |
| 560034 | In Stock ₹385 | In Stock ₹369 | In Stock ₹389 | In Stock ₹399 | 100% |
| 560066 | Not Listed | In Stock ₹375 | In Stock ₹395 | In Stock ₹409 | 75% |
| 560001 | In Stock ₹389 | OOS | In Stock ₹385 | Not Listed | 50% |
| 560078 | In Stock ₹379 | In Stock ₹365 | In Stock ₹389 | In Stock ₹399 | 100% |
Availability Score — the percentage of platform-pin-code combinations where the SKU is both listed and in stock — is the single most under-used metric in Indian CPG. Most brands cannot calculate it because they cannot see it. It is a direct multiplier on revenue: a 25-point availability gap in a high-density catchment is a quarter of that catchment's demand handed to whoever is on the shelf instead.
Sample Data: Share-of-Shelf and Competitive Displacement
Category: Edible Oils — Pin Code 560095 — Blinkit
| Rank | Product | Type | Price (₹) | Discount |
|---|---|---|---|---|
| 1 | Competitor A — Sunflower 1L | National Brand | 349 | 15% |
| 2 | Platform Private Label — Groundnut 1L | Private Label | 329 | 18% |
| 3 | Competitor B — Mustard 1L | National Brand | 359 | 12% |
| 4 | Example Brand — Groundnut 1L | Your SKU | 379 | 9.8% |
| 5 | Competitor A — Groundnut 1L | National Brand | 369 | 14% |
| 6 | Platform Private Label — Sunflower 1L | Private Label | 315 | 20% |
Two private label SKUs in the top six. Your product is priced highest in its own sub-category and discounted least. That combination is not a pricing strategy — it is a slow displacement, and it is only visible if someone is watching the shelf every day.
The Economics of Ten Minutes — And Why They Punish Brands
Understanding why q-commerce behaves this way requires understanding what the ten-minute promise costs to keep.
A dark store is expensive. It carries rent, staffing, inventory holding cost and a rider fleet, and it must recover all of that from a basket that is structurally smaller than a supermarket trip. The platform's response is to maximise throughput per SKU slot. Every listing that does not turn fast enough is a candidate for removal.
This produces three behaviours that directly affect brands:
Ruthless assortment pruning. A dark store carries a fraction of a supermarket's SKU count. Slow-moving variants get delisted quietly, often without any communication to the brand. A brand discovers a delisting weeks later, from a sales dip it cannot explain.
Private label preference. Platform-owned labels carry higher margin and no negotiation friction. Given a limited slot, the commercial logic favours the private label, and the ranking algorithm follows. This is not a conspiracy — it is arithmetic, and it is happening in every high-volume commodity category.
Discount-led rank manipulation. Deeper discounts drive velocity, velocity drives rank, and rank drives further velocity. A competitor who discounts 5% deeper than you for three weeks can permanently displace you in category rank, and the effect persists after the discount ends.
None of these three behaviours will be reported to you by the platform. All three are visible, daily, in public catalogue data.
Building the Metrics That Actually Matter
Most brands entering q-commerce measure the wrong things. They track sell-out revenue by platform, which is reported to them, and stop there. The metrics that actually predict revenue are the ones that must be observed externally:
Availability Score. Percentage of platform × pin-code combinations where your SKU is both listed and in stock. This is a direct revenue multiplier and the fastest-payback metric in the entire q-commerce stack.
Listing Penetration. Percentage of a platform's active dark stores in a city that carry your SKU at all. A brand can be at 100% in-stock and still be at 40% penetration — meaning 60% of the city cannot buy the product regardless of demand.
Share of Shelf. Your SKU count and rank position within the category listing, versus competitors and versus private label. Rank below position eight in a mobile category listing means most shoppers never scroll to you.
Price Spread. Maximum minus minimum selling price for the same SKU across platforms and pin codes. A wide spread signals channel conflict and erodes brand price perception.
Stock-Out Duration. Not just whether you were out of stock, but for how long, in which catchment, and at what hour. A four-hour stock-out in a dense pin code on a Sunday evening is worth more lost revenue than a two-day stock-out in a low-density catchment on a Tuesday.
Private Label Encroachment Rate. The rate at which platform-owned SKUs are gaining rank in your category over time. This is the leading indicator of long-term category displacement, and it is almost never tracked.
Each of these is calculable from public catalogue data. None is available from a platform's own reporting.
What Q-Commerce Data Is Used For
CPG brands use it for price compliance and channel conflict detection, availability and stock-out monitoring, share-of-shelf tracking, private label threat monitoring, promotional effectiveness measurement, and new product launch tracking across catchments.
Retailers and platforms use it for competitive price benchmarking, assortment gap identification and dark store range optimisation.
Distributors use it to identify catchments where their brands are under-listed and to prove the case to platform category managers with evidence rather than assertion.
Investors and analysts use it to size platform assortment, measure private label penetration, track discount intensity as a proxy for burn, and validate growth claims independently.
Market research and consulting teams use it to build category maps that reflect what is actually on the digital shelf today, not what a survey said last quarter.
The FoodDataScrape Q-Commerce Data Model
- Product identity: SKU name, brand, normalised product name, category and sub-category, pack size, variant, product identifiers, images
- Platform presence: listed status per platform, listing URL, first-seen and delisting detection
- Pricing: MRP, selling price, discount percentage, promotional tags, bundle and combo pricing, price history
- Availability: in-stock or out-of-stock status by pin code and dark store catchment, availability score, stock-out duration
- Shelf position: category rank, search rank for target keywords, sponsored placement detection
- Competitive context: competing SKUs above and below, private label presence, category price ladder
- Geography: pin code, city, catchment, delivery promise time
- Change tracking: price changes, new listings, delistings, stock-out events, rank movements
Delivery via API, CSV, JSON, Parquet, cloud storage or direct BI/database integration. Refresh cadence from daily to multiple times per day for high-volatility pricing fields.
Methodology and Compliance
- We collect publicly accessible catalogue and pricing information only. No authenticated content, no private data, no personal consumer data.
- We crawl at pin-code granularity, because a national average is a number that describes nothing that actually exists.
- Products are normalised across platforms, so that the same SKU listed with four different names resolves to a single entity — without this, cross-platform comparison is meaningless.
- We operate rate-limited crawlers designed not to degrade the platforms we collect from.
- Data is validated and deduplicated before delivery.
Measurable Outcomes
| Metric | Without Data | With FoodDataScrape |
|---|---|---|
| Stock-out visibility | Reported after the fact, if at all | Detected within hours, by pin code |
| Price compliance monitoring | Manual spot-checks, sub-5% coverage | Full catalogue, daily |
| Share-of-shelf tracking | Not measurable | Ranked, daily, by catchment |
| Private label threat detection | Anecdotal | Quantified per category |
| Cross-platform price spread | Unknown | Exact, per SKU, per pin code |
| Time to build a category map | Weeks | Days |
Conclusion
Quick commerce did not create one new sales channel. It created thousands of them, each with its own catalogue, its own price and its own shelf — and it handed none of that visibility back to the brands whose products fill it.
The gap between what a brand believes is happening on Blinkit, Zepto, Instamart and BigBasket and what is actually happening in a given pin code at a given hour is where margin quietly disappears, where competitors take shelf slots, and where private labels expand.
Q-Commerce Data Scraping closes that gap. Not with a quarterly report, but with a daily, pin-code-level, cross-platform view of exactly where your product stands.
FoodDataScrape crawls 220M+ pages of food and grocery data every week so that you always know what your shelf actually looks like.
Questions
Frequently Asked Questions
Blinkit, Zepto, Swiggy Instamart and BigBasket, with additional quick commerce and e-grocery platforms available on request across India and international markets.
Pin-code level. This is essential — dark store catalogues differ meaningfully between adjacent pin codes, so anything coarser hides the exact problems you are trying to find.
Daily by default. Multiple daily refreshes are available for categories with high promotional volatility.
Yes. Most clients scope to a defined SKU basket plus a competitive set, which keeps the feed focused and cost-efficient.
Yes, where the platform labels them publicly.
Yes — API, database push, cloud storage drop or flat files, matched to your ingestion schema.
Get a Free Food Data Sample in 48 Hours.
Tell us your platforms, target markets and required fields — we'll map exactly what's possible with food data scraping, recommend the right approach, and send a working sample so you can verify quality before any commitment.
Request a strategy call
Thanks — our data team will reach out within 48 hours with your sample.



