
About The Client
The client was a fast-growing retail intelligence and e-commerce strategy company seeking deeper visibility into the rapidly expanding 10-minute delivery market. Its primary objective was to understand how product assortments, pricing, availability, brands, and pack sizes varied across leading quick-commerce platforms. The client needed reliable market data to support assortment planning, competitor benchmarking, and category expansion decisions. To achieve this, the organization required structured quick-commerce SKU assortment data scraping covering thousands of products across multiple categories and locations. The collected information enabled the client to identify assortment gaps, monitor product additions and removals, and understand changing catalog patterns. With q commerce assortment tracking across delivery apps, the client could compare product coverage, availability, pricing, and promotional activity across competing platforms. The resulting dataset became an important foundation for quick-commerce competitive intelligence, helping the business evaluate competitors, identify market opportunities, optimize assortments, and make faster data-driven decisions in the highly dynamic quick-commerce ecosystem.
Key Challenges
-
Real-Time Price and Availability Changes
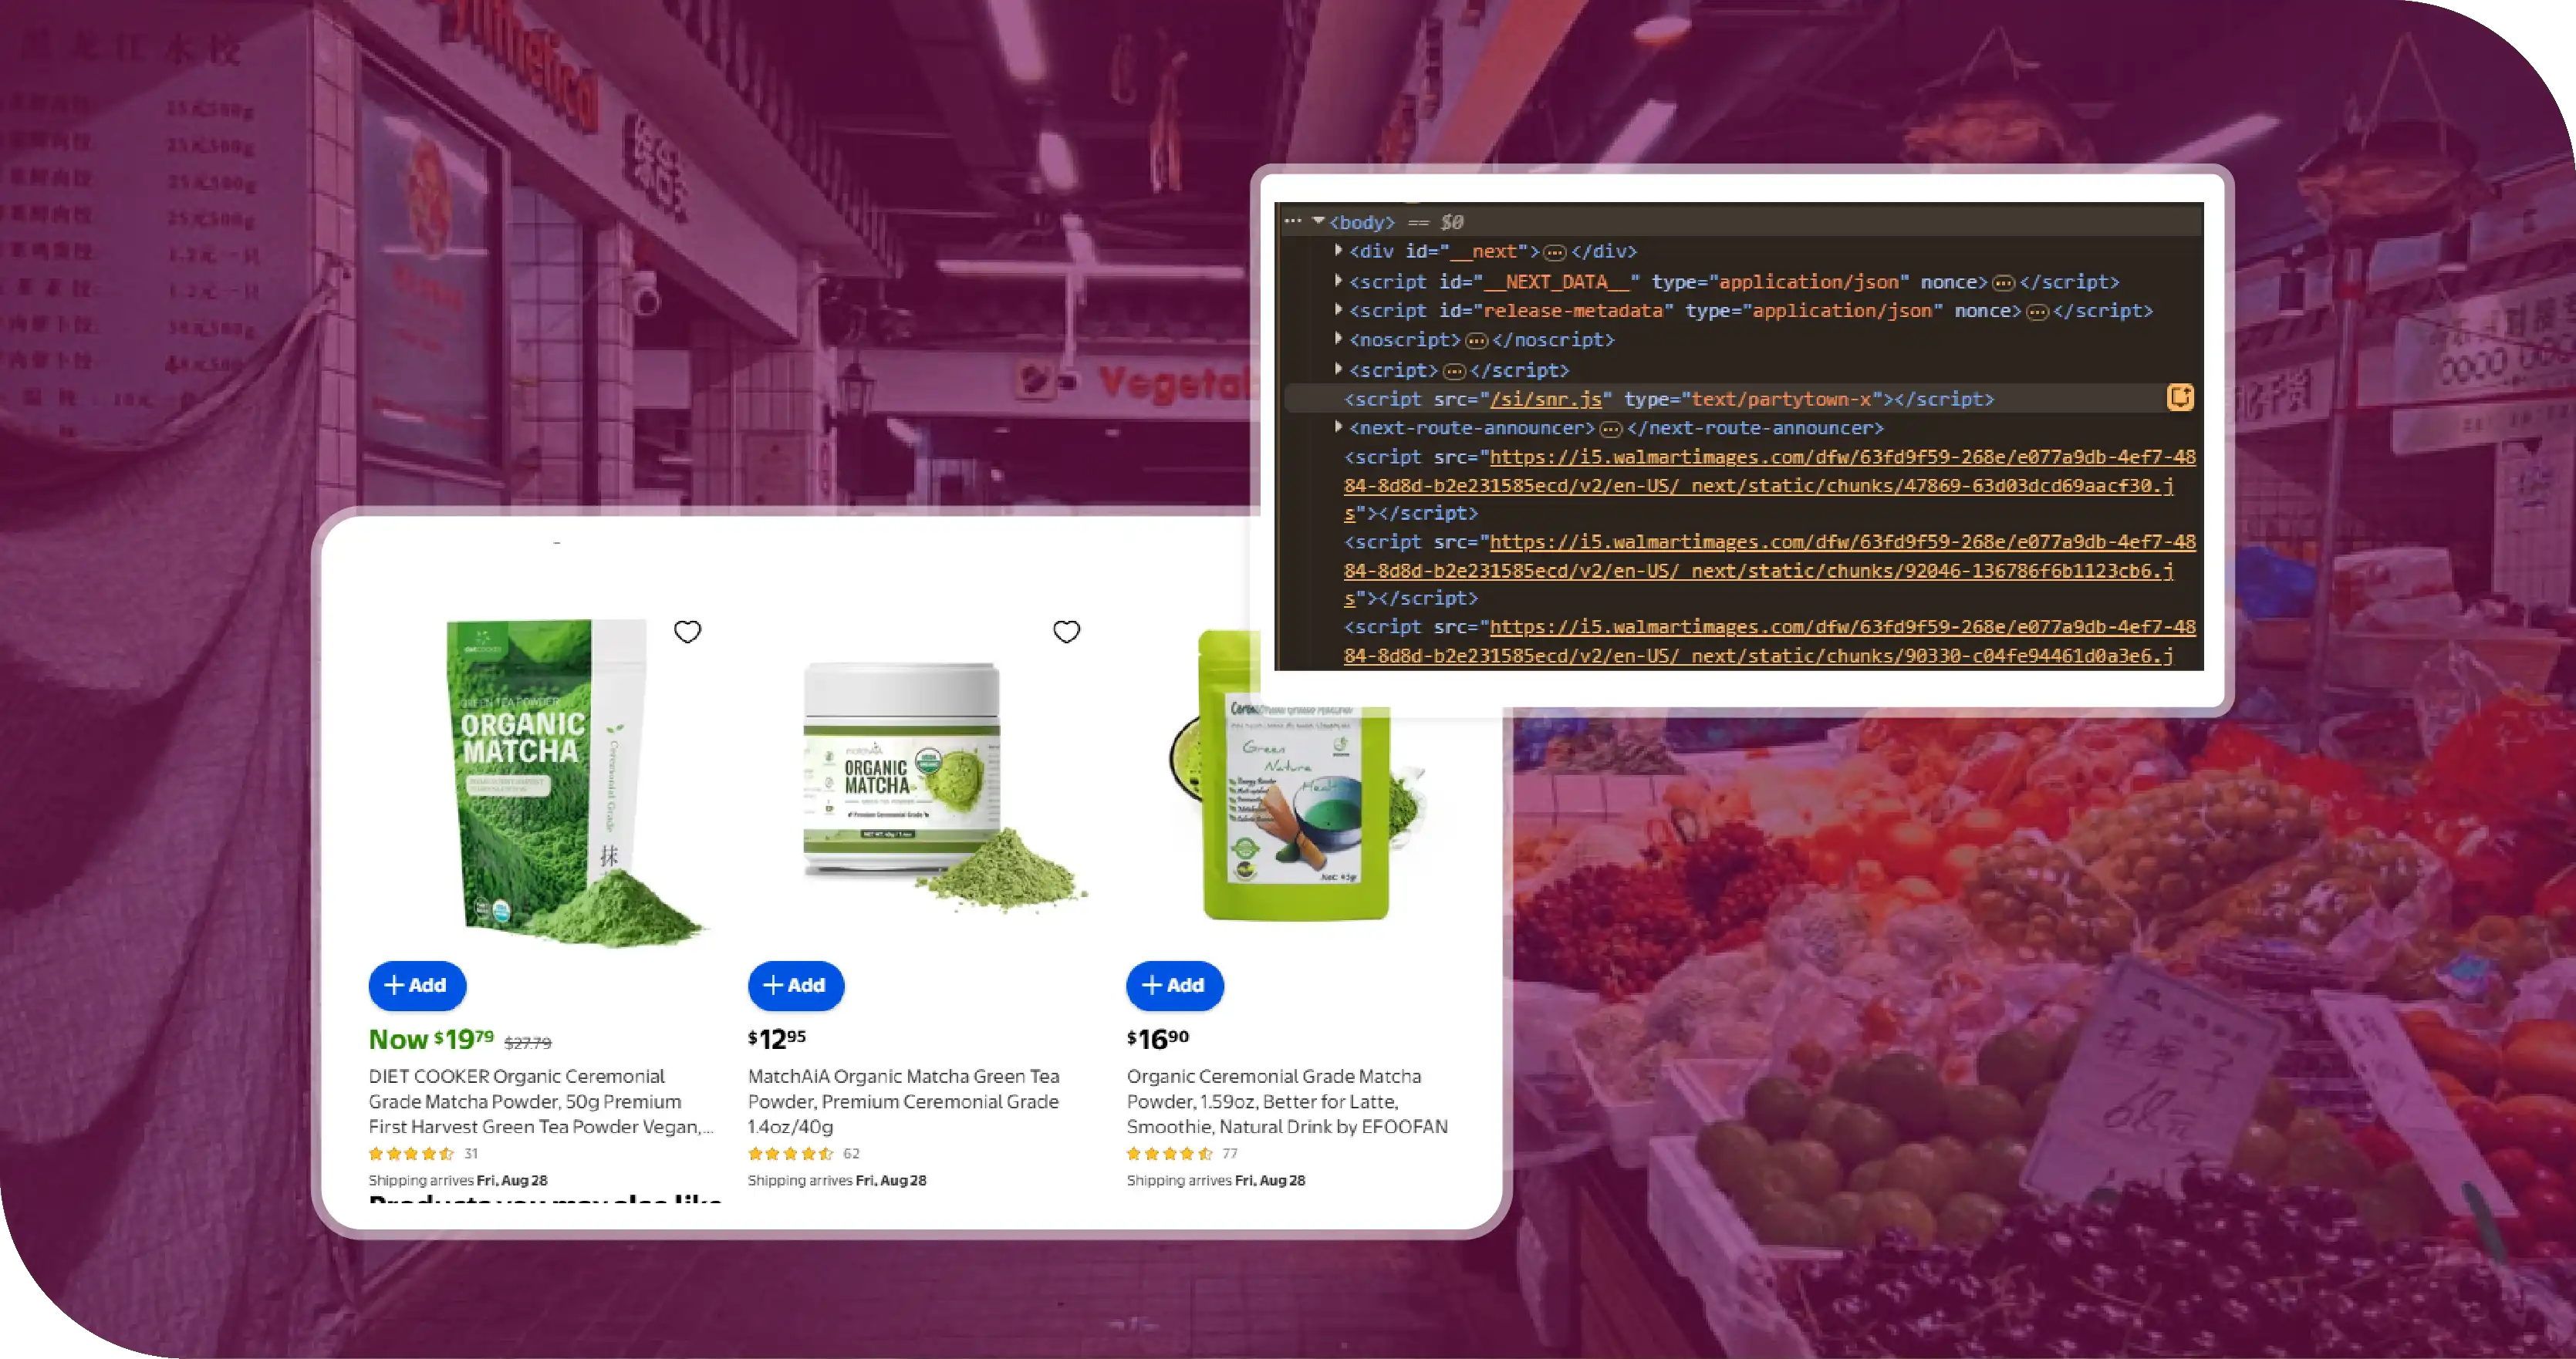
Maintaining accurate quick-commerce price and availability tracking was challenging because prices, discounts, stock levels, and product visibility changed frequently. The project required continuous monitoring to capture time-sensitive updates and minimize discrepancies between collected datasets and live platform information. -
Multi-Platform Data Collection
The method to Scrape Quick Commerce Data across multiple delivery platforms required handling different website structures, product categories, location-based catalogs, and dynamic content. Ensuring consistent extraction fields across platforms was essential for creating standardized datasets that could support meaningful comparisons and analysis. -
Data Quality and Standardization
Creating reliable Q-Commerce Data for Product & Price Insights required cleaning duplicate records, normalizing product names, matching brands and pack sizes, and validating pricing information. These processes were necessary to produce accurate, comparable, and analysis-ready datasets for competitive research and assortment decisions.
Key Solutions
-
Real-Time Price and Availability Tracking
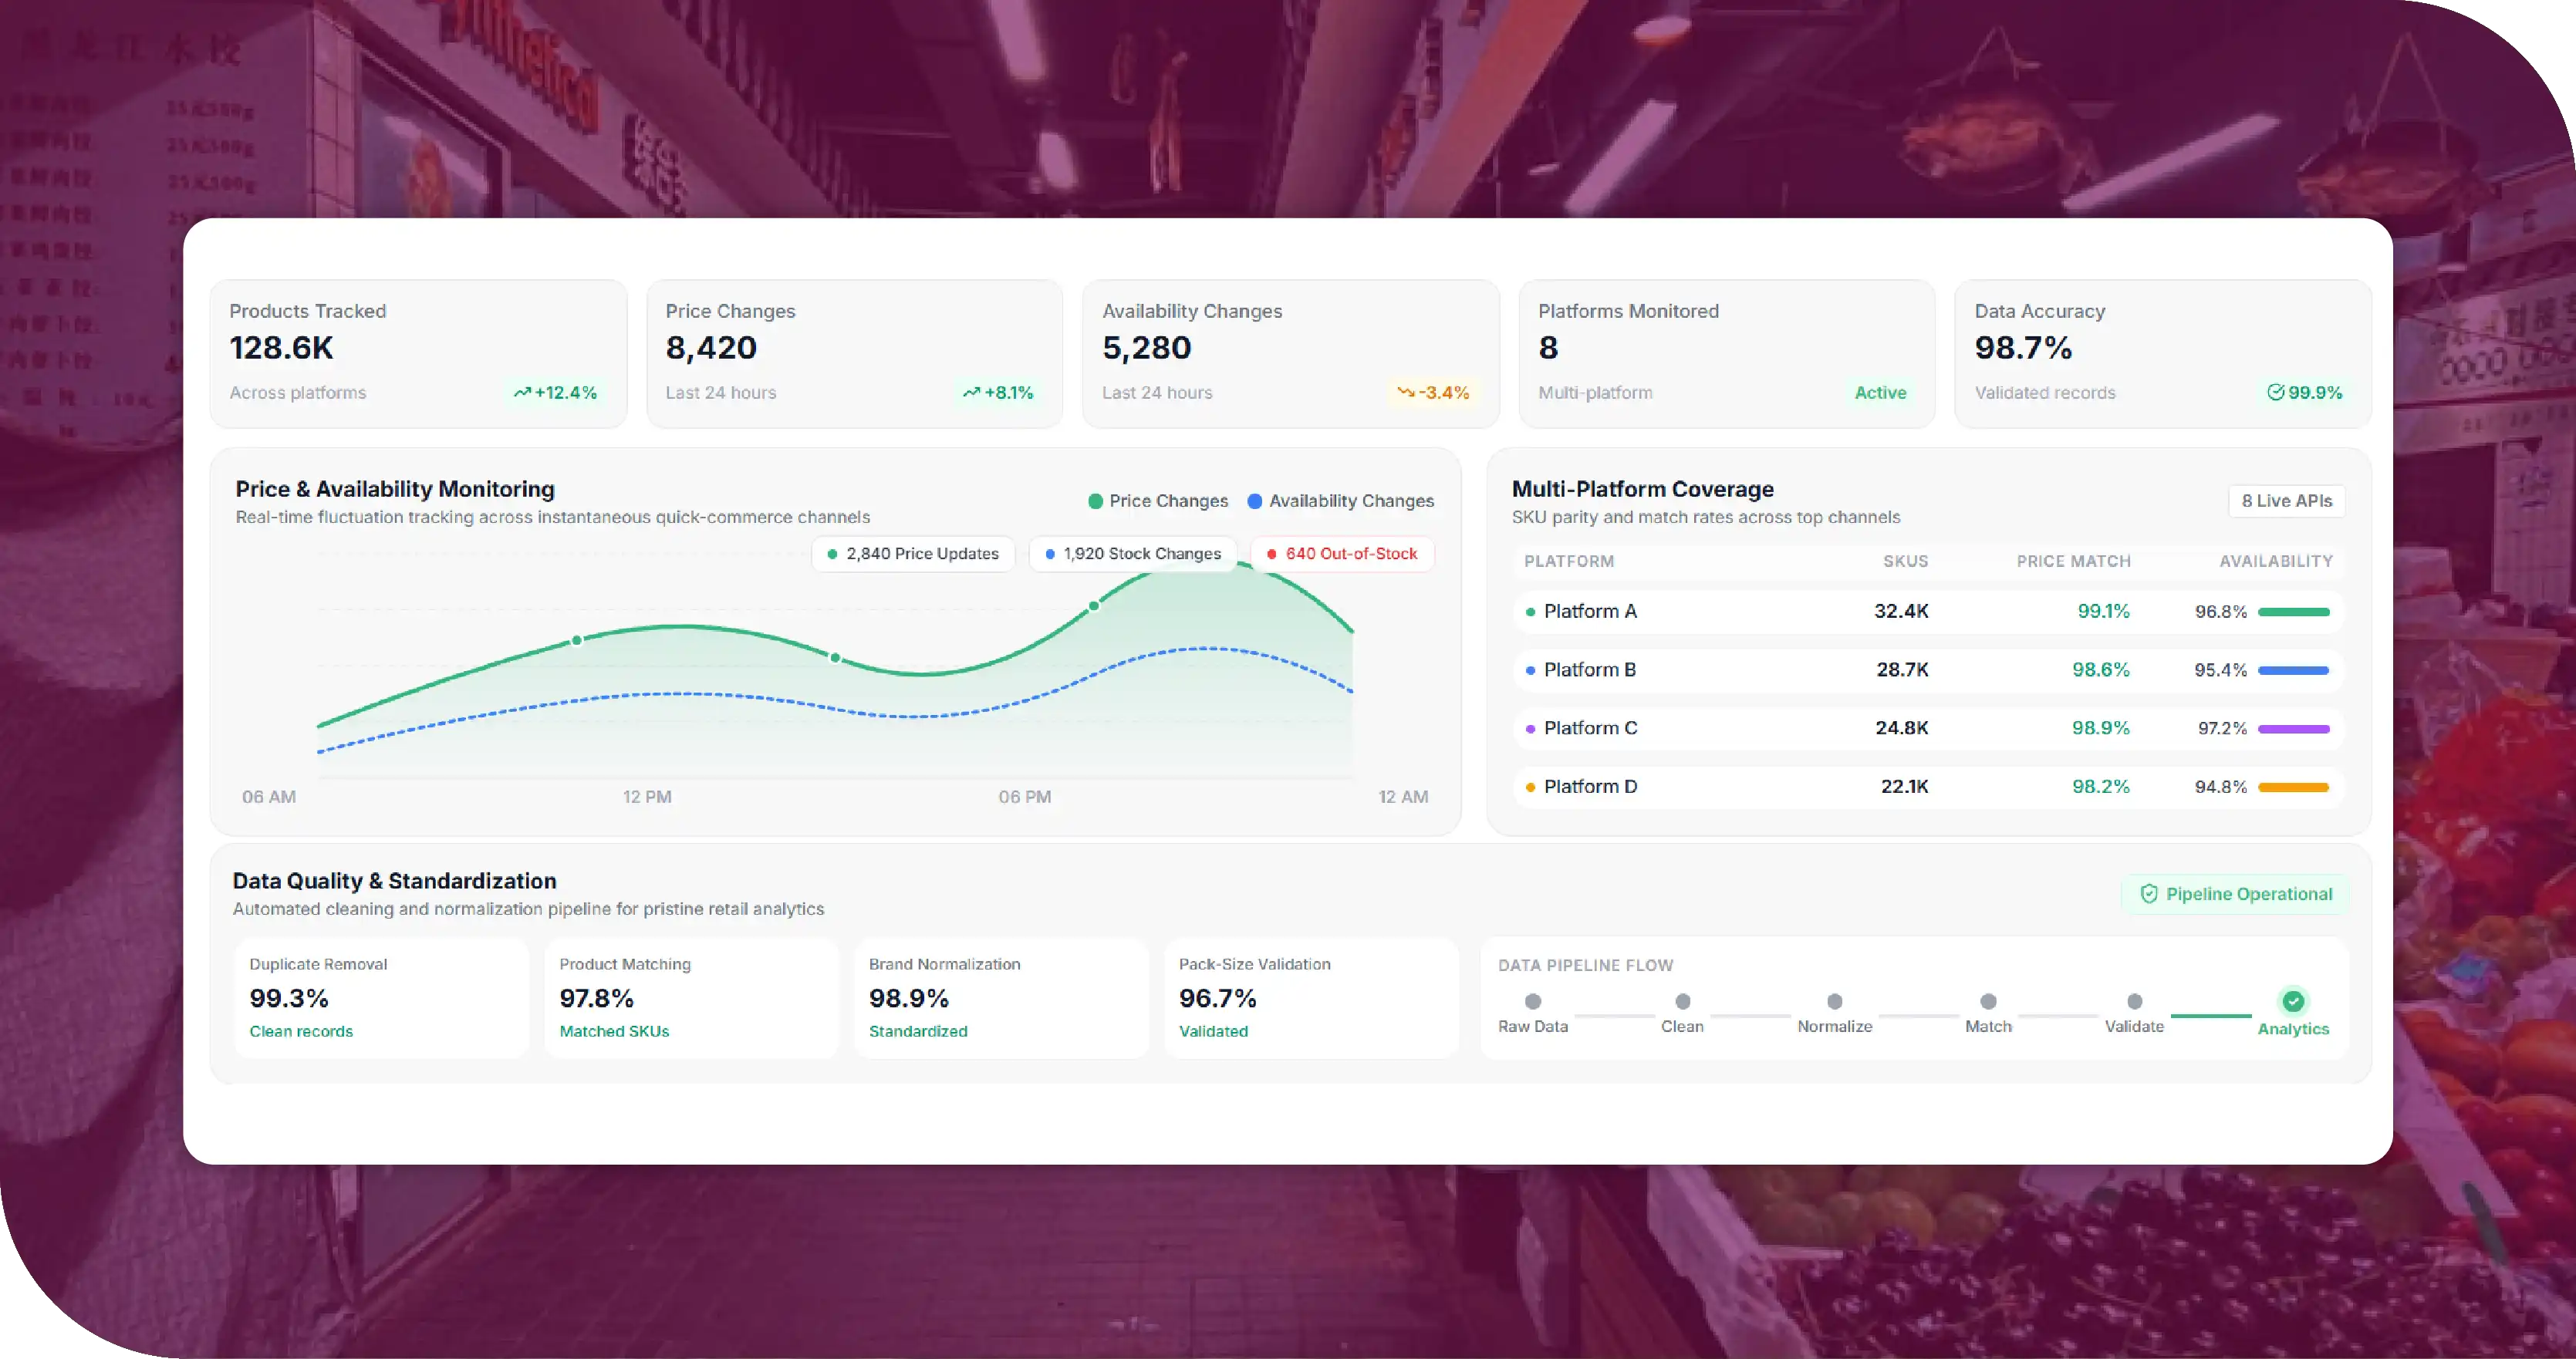
Maintaining accurate quick-commerce price and availability tracking was achieved through continuous monitoring to capture time-sensitive updates and minimize discrepancies between collected datasets and live platform information. -
Multi-Platform Data Collection
The method to Scrape Quick Commerce Data across multiple delivery platforms handled different website structures, product categories, location-based catalogs, and dynamic content. Consistent extraction fields across platforms created standardized datasets for meaningful comparisons and analysis. -
Data Quality and Standardization
Creating reliable Q-Commerce Data for Product & Price Insights involved cleaning duplicate records, normalizing product names, matching brands and pack sizes, and validating pricing information to produce accurate, comparable, and analysis-ready datasets for competitive research and assortment decisions.
Data Collection Snapshot
| Platform | Cities Covered | Dark Stores | Categories | SKUs Tracked | Products Available | Out-of-Stock SKUs | Price Records | Images Captured | Availability Records | Discount Records |
|---|---|---|---|---|---|---|---|---|---|---|
| Blinkit | 18 | 245 | 42 | 58,420 | 51,860 | 6,560 | 72,300 | 55,910 | 68,740 | 21,480 |
| Zepto | 16 | 218 | 39 | 52,680 | 46,925 | 5,755 | 65,420 | 49,870 | 61,315 | 19,260 |
| Swiggy Instamart | 14 | 196 | 37 | 47,350 | 42,180 | 5,170 | 58,760 | 44,625 | 55,930 | 17,840 |
| BigBasket Now | 12 | 174 | 35 | 43,910 | 38,745 | 5,165 | 53,680 | 41,290 | 50,875 | 15,920 |
| Total | 60 | 833 | 153 | 202,360 | 179,710 | 22,650 | 250,160 | 191,695 | 236,860 | 74,500 |
Methodologies Used
-
Automated Catalog Extraction
We developed automated scraping workflows to collect product information from multiple quick-commerce platforms. The process captured product names, brands, categories, pack sizes, prices, discounts, availability, images, and product identifiers while maintaining consistent extraction structures across different website layouts. -
Multi-Platform Data Standardization
Data collected from different platforms was transformed into a unified format for comparison. Product names, categories, brands, quantities, and pricing attributes were normalized, helping eliminate inconsistencies and creating a standardized dataset suitable for assortment benchmarking and competitive analysis. -
Product Matching and Deduplication
We applied product matching techniques to identify identical or closely related products across platforms. Brand names, product descriptions, pack sizes, and other attributes were compared to reduce duplicate records and improve the accuracy of cross-platform assortment analysis. -
Location-Based Data Collection
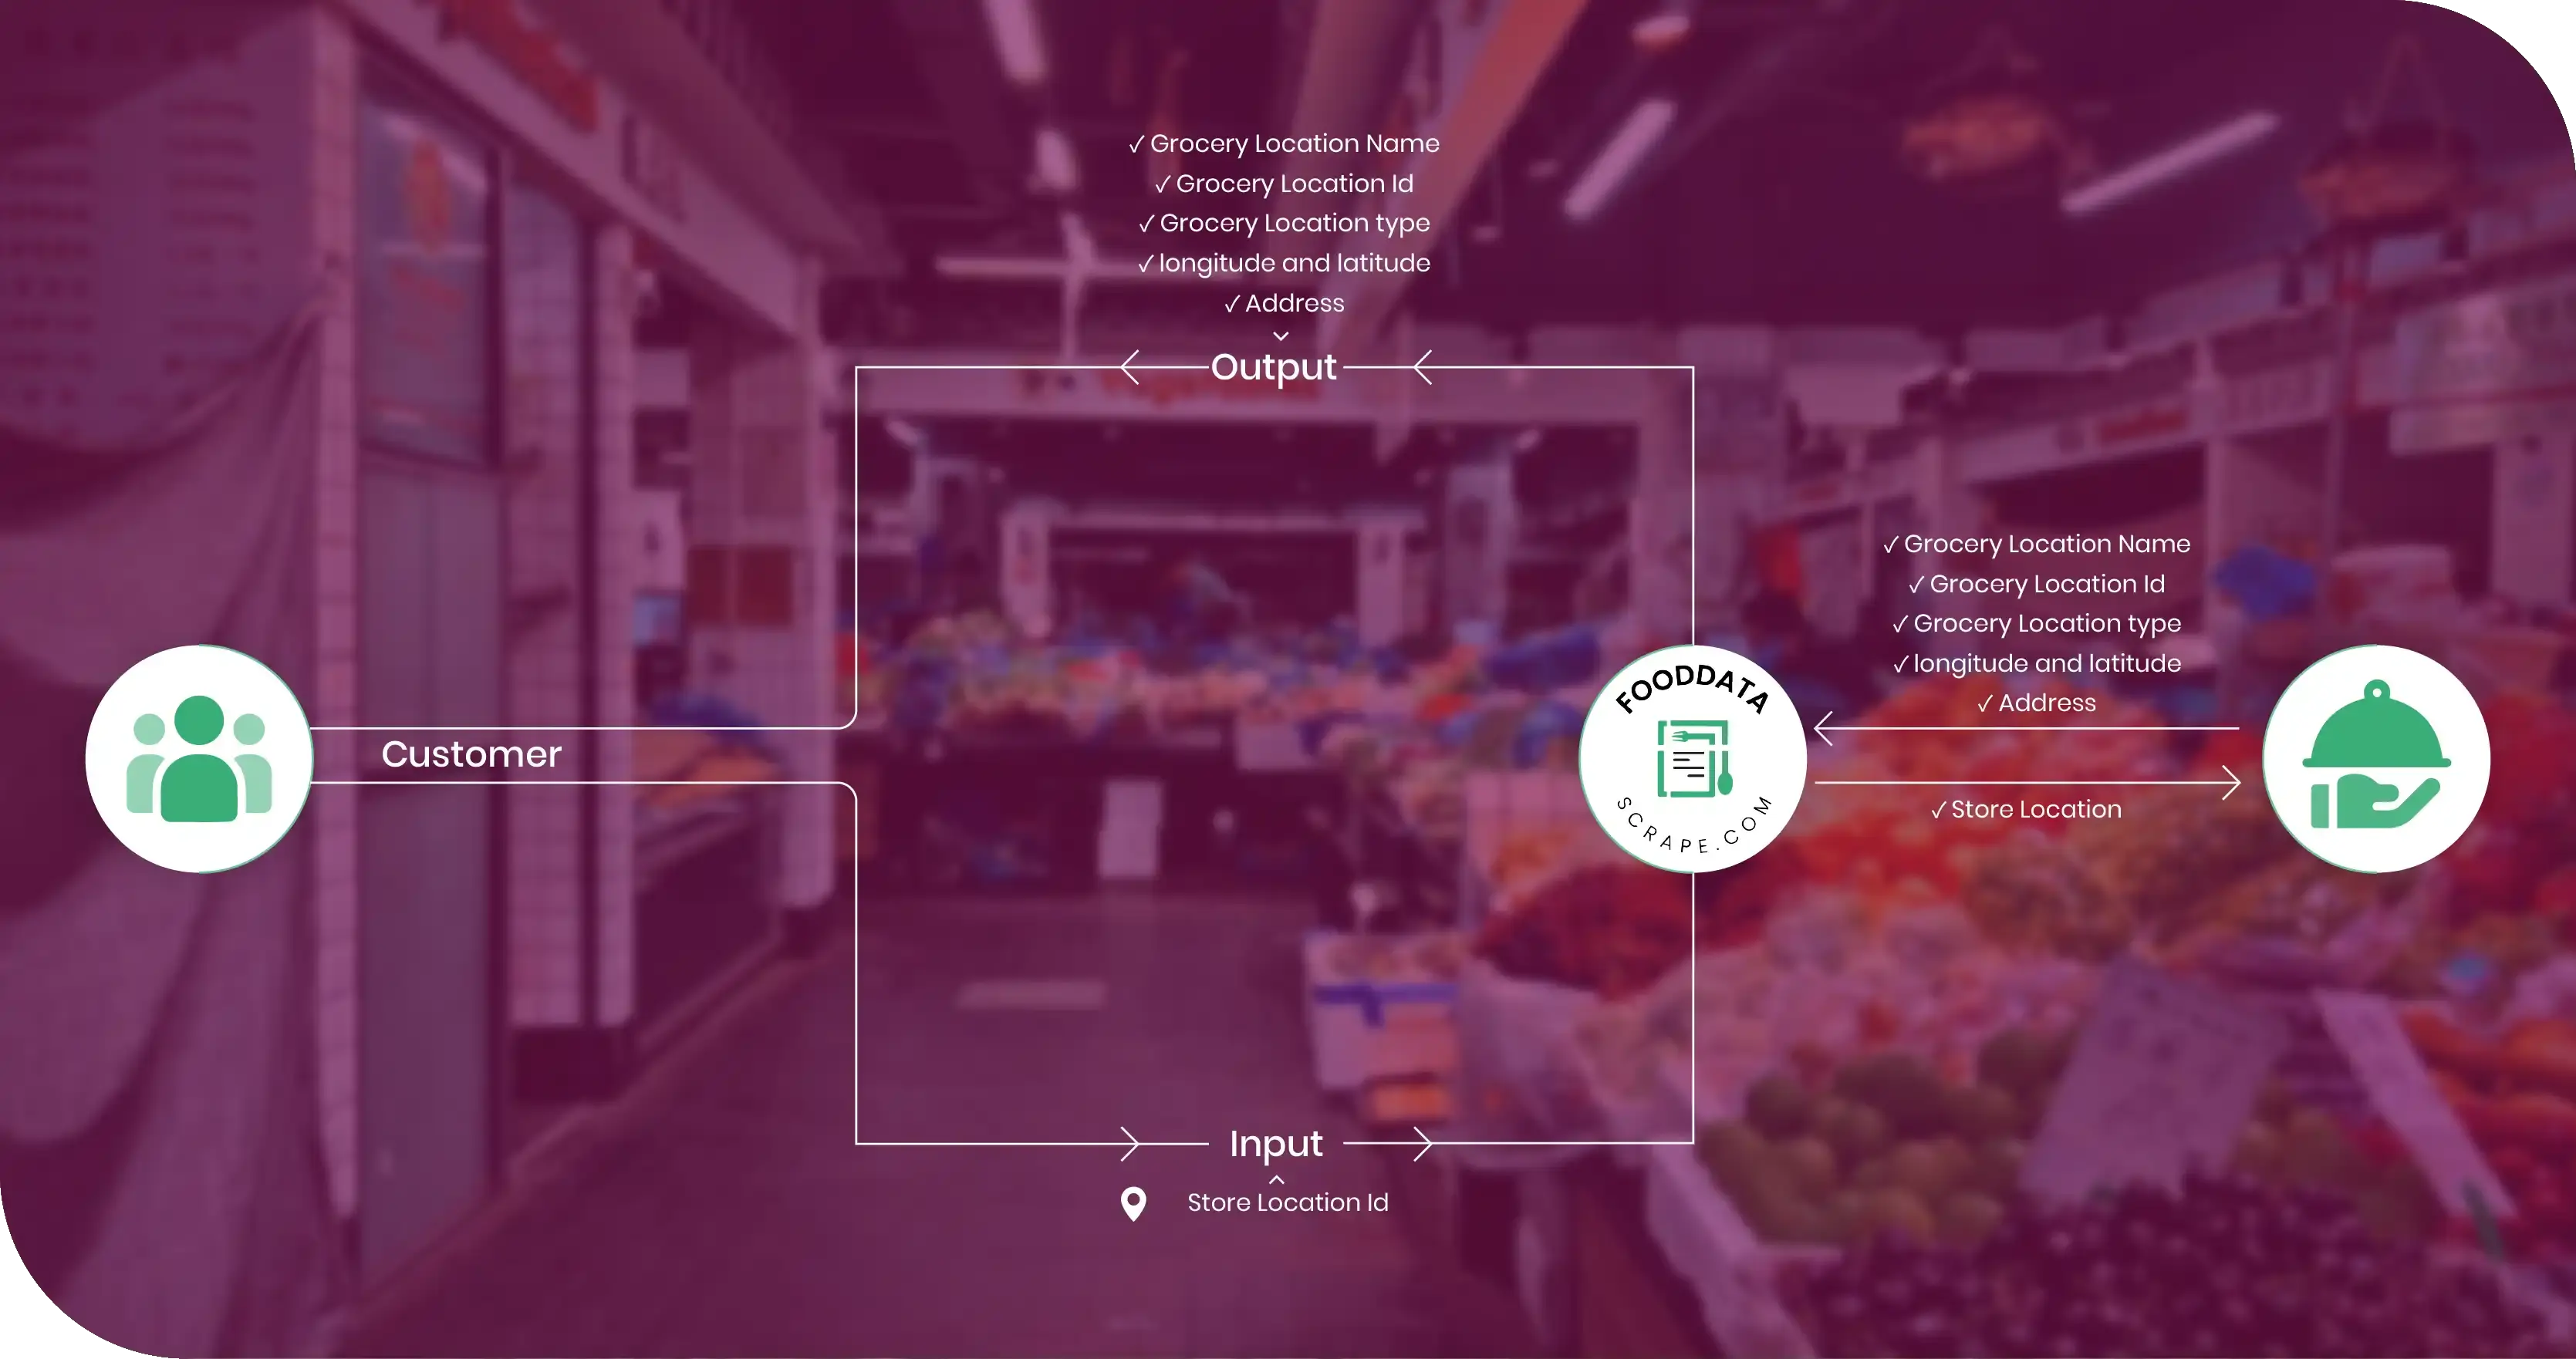
The methodology incorporated location-specific extraction to capture differences in product availability and pricing across service areas. Store-level and geographic information was associated with product records, enabling analysis of regional assortment variations, coverage gaps, and localized inventory patterns. -
Data Validation and Quality Checks
Multiple validation procedures were applied to identify missing values, duplicate entries, incorrect prices, and inconsistent availability statuses. Automated checks and structured cleaning processes improved dataset reliability, ensuring the final information was accurate, organized, and ready for business intelligence applications.
Advantages of Collecting Data Using Food Data Scrape
-
Comprehensive Market Visibility
Our services provide structured visibility into products, prices, brands, categories, discounts, and availability across multiple platforms. This comprehensive information helps businesses understand market conditions, identify assortment differences, and recognize emerging opportunities without relying on fragmented or manually collected information. -
Faster Competitive Benchmarking
Automated data collection enables businesses to compare competitors efficiently across products, pricing, promotions, and availability. Regularly refreshed datasets help decision-makers identify pricing movements, assortment changes, and promotional patterns faster, supporting timely responses to competitive developments and changing customer expectations. -
Improved Assortment Planning
Detailed product datasets help businesses evaluate which products are consistently available, frequently unavailable, newly introduced, or removed. These insights support better assortment planning, category expansion, product selection, and inventory decisions while helping organizations align offerings with market demand. -
Better Data Accuracy
Our structured extraction and validation processes reduce manual errors commonly associated with collecting large volumes of information. Standardized fields, duplicate removal, quality checks, and regular updates create dependable datasets that teams can confidently use for analysis, reporting, and strategic decision-making. -
Scalable Business Intelligence
Our solutions can handle large volumes of product and location data across multiple markets and platforms. Scalable collection processes allow businesses to expand monitoring coverage as requirements grow, providing consistent intelligence for market research, competitive analysis, pricing strategies, and operational planning.
Client's Testimonial
"Working with the data scraping team transformed how we monitor the quick-commerce market. Previously, our teams spent significant time manually checking products, prices, availability, and assortment changes across different platforms. The structured datasets we received gave us a much clearer and more reliable view of market movements. We were able to compare competitors, identify assortment gaps, monitor regional availability, and make faster pricing and product decisions. The data quality, consistency, and regular delivery exceeded our expectations. Their ability to handle large volumes of information while maintaining accuracy made the entire process highly efficient. This solution has become an important part of our market intelligence and planning workflow."
— Head of Market Intelligence
Final Outcome
The project delivered a comprehensive and structured dataset that gave the client clear visibility into quick-commerce assortment, pricing, availability, promotions, and location-level product coverage. Automated collection significantly reduced the effort required for manual monitoring while enabling consistent tracking across multiple delivery platforms. The client could identify assortment gaps, compare competitor offerings, detect price differences, monitor out-of-stock patterns, and evaluate regional product availability more efficiently. Standardized and validated records also improved the reliability of downstream analysis and reporting. With regularly refreshed data, the organization gained a stronger foundation for competitive benchmarking, assortment optimization, category planning, and market expansion decisions. Overall, the solution transformed fragmented marketplace information into actionable intelligence, helping the client respond faster to market changes and make more informed decisions within the rapidly evolving 10-minute delivery ecosystem.



