

The Quick Commerce & Grocery Deal Intelligence Across India & US Markets report analyzes evolving pricing strategies, delivery models, promotional campaigns, and consumer purchasing behavior across digital grocery ecosystems. The study examines how quick commerce platforms, grocery retailers, and FMCG brands leverage real-time retail intelligence to optimize pricing, monitor competitors, and improve customer retention. It highlights operational differences between India’s ultra-fast hyperlocal delivery networks and the United States’ warehouse-driven grocery fulfillment systems. The report further evaluates SKU-level pricing trends, category-specific discounting patterns, inventory availability, and delivery fee fluctuations across multiple grocery categories. Businesses increasingly utilize advanced analytics, automated monitoring tools, and predictive intelligence systems to track market changes and strengthen retail competitiveness. The research also explores the growing role of AI-driven pricing optimization, demand forecasting, and digital commerce analytics in improving operational efficiency and strategic decision-making within rapidly expanding grocery delivery markets.
Order Patterns – India records higher order frequency while US markets show significantly larger grocery basket values and subscription penetration.
Pricing Volatility – Grocery pricing fluctuations occur multiple times daily due to inventory shifts, demand surges, and promotional competition.
Delivery Expansion -Hyperlocal delivery infrastructure in India enables 10–20 minute deliveries across densely populated metropolitan regions efficiently.
Retail Automation – Retailers increasingly deploy automated intelligence systems for SKU-level pricing analysis, discount tracking, and inventory monitoring activities.
Predictive Analytics – AI-powered analytics and real-time grocery intelligence improve pricing optimization, demand forecasting, and customer retention strategies globally.

The grocery retail industry is undergoing a major transformation as consumers increasingly shift toward app-based ordering and instant delivery ecosystems. Across India and the United States, quick commerce platforms are competing aggressively on delivery speed, pricing strategy, assortment diversity, and discount campaigns. Retailers are continuously analyzing competitor movements to retain customers and improve profitability in highly dynamic digital grocery environments.
Quick Commerce & Grocery Deal Intelligence Across India & US Markets plays a critical role in helping retailers, FMCG brands, analytics providers, and investment firms monitor pricing fluctuations, delivery charges, promotional campaigns, and inventory movement across digital commerce platforms. Businesses now depend on automated intelligence systems that collect millions of product-level observations daily from grocery apps, dark stores, and online supermarkets.
The increasing deployment of Quick Commerce Price Monitoring India & US Markets systems allows enterprises to compare category-wise pricing trends, benchmark promotional activity, and understand regional consumer purchasing behavior in real time. Additionally, Product Pricing Benchmarks Across India and US Markets are helping organizations evaluate inflation trends, supplier costs, operational efficiency, and digital retail competitiveness across both economies.
India’s quick commerce ecosystem has grown rapidly due to high mobile penetration, urban density, and consumer preference for ultra-fast delivery. In contrast, the US grocery delivery market emphasizes subscription-driven retention, larger basket values, and centralized fulfillment operations. Despite these structural differences, both markets increasingly rely on retail intelligence to drive pricing decisions and operational planning.
The expansion of quick commerce has changed traditional grocery shopping patterns worldwide. Consumers now expect groceries, beverages, household items, and personal care products to be delivered within minutes rather than hours or days.
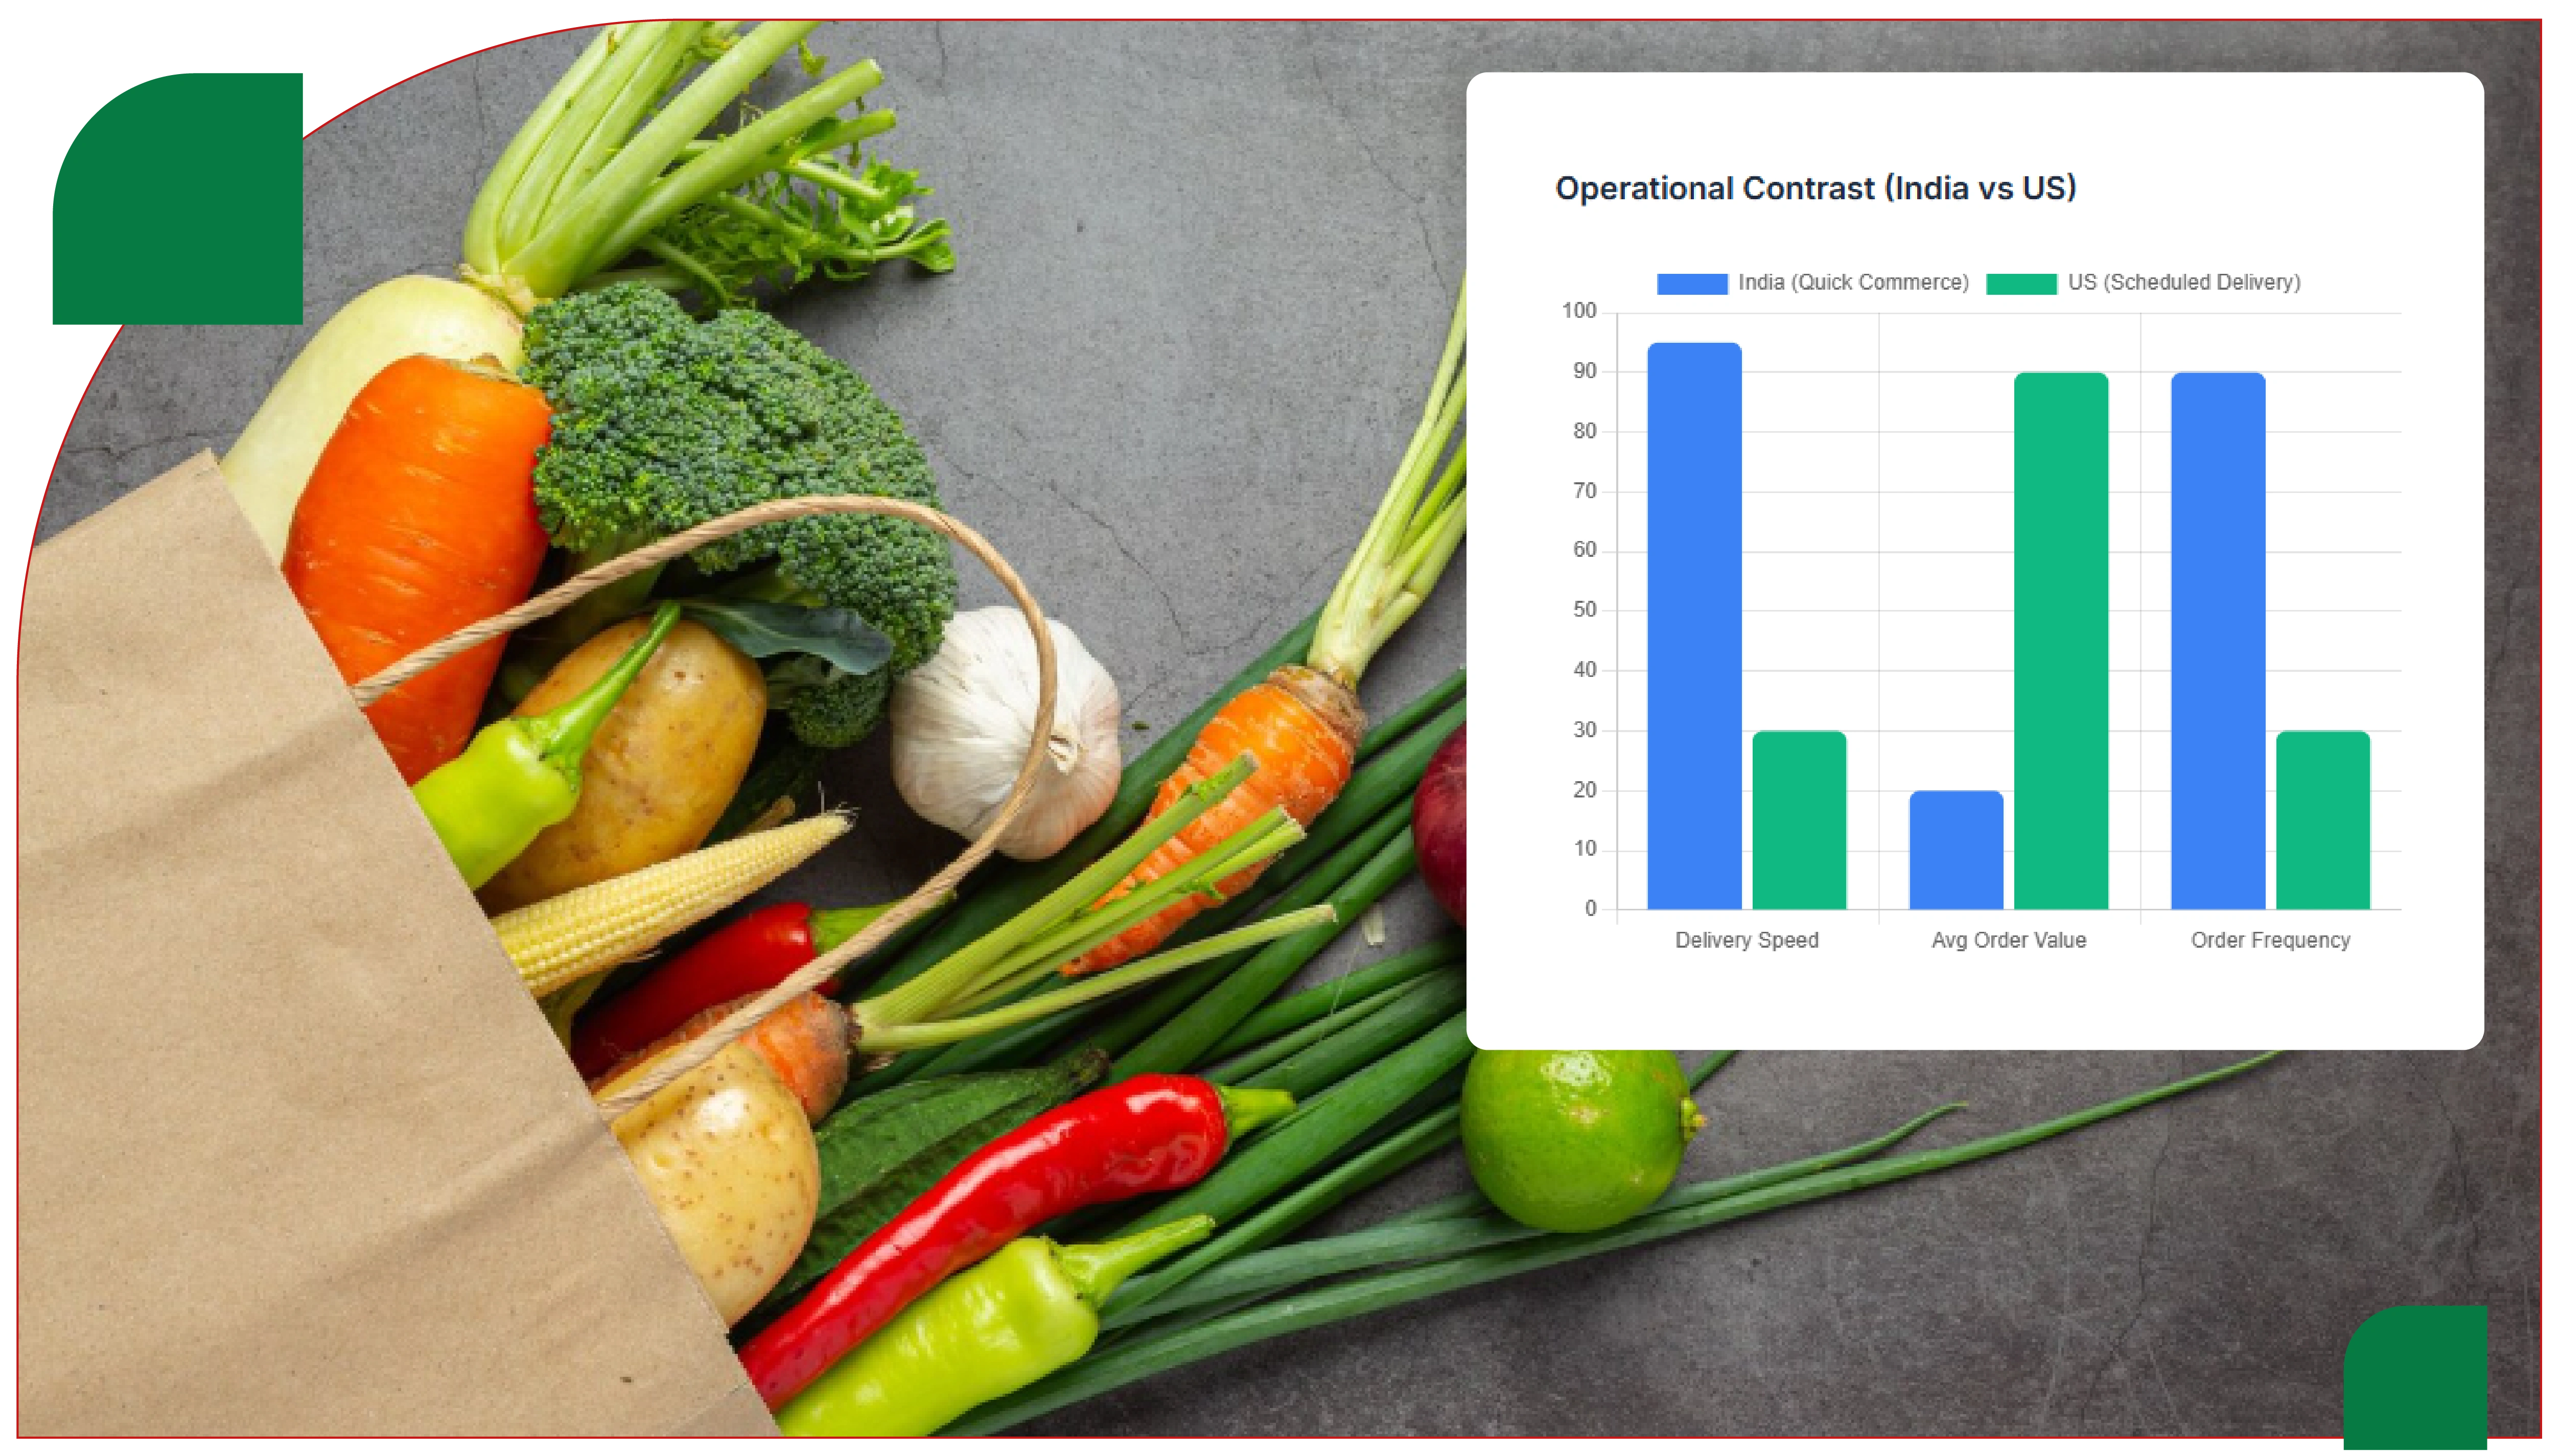
Indian platforms operating in major metropolitan cities focus heavily on low-order-value transactions with extremely fast fulfillment cycles. Delivery platforms often update prices several times a day depending on demand, stock availability, and competitor campaigns.
The US grocery ecosystem follows a different operational model centered around scheduled deliveries, warehouse fulfillment, and premium membership subscriptions. American consumers generally place larger grocery orders with higher average cart values and lower order frequency.
The growing importance of Quick Commerce & Grocery Discount Data Tracking has enabled businesses to identify discount intensity, flash-sale performance, and category-specific pricing strategies across different regional markets.
Retail pricing behavior differs significantly between India and the United States because of taxation systems, logistics infrastructure, consumer spending habits, and supply chain structures.
| Metrics | India Market Data | United States Market Data | Growth Trend | Consumer Behavior | Operational Model | Technology Adoption | Pricing Strategy | Delivery Infrastructure | Market Maturity |
|---|---|---|---|---|---|---|---|---|---|
| Average Grocery App Users | 165–210 million active monthly users | 82–115 million active monthly users | Rapid Growth | High daily usage | Quick commerce focused | High mobile penetration | Aggressive acquisition offers | Dense urban coverage | Emerging high-scale market |
| Average Delivery Radius | 1.5–4 km from dark stores | 8–20 km from fulfillment centers | Expanding locally | Preference for instant delivery | Micro-warehouse networks | AI route optimization | Low-cost rapid delivery | Bike-based delivery systems | Still scaling infrastructure |
| Average Delivery Speed | 10–18 minutes in metro cities | 35–95 minutes depending on city | Ultra-fast delivery expansion | Impulse ordering behavior | Hyperlocal dispatch systems | Real-time tracking widely used | Speed-driven pricing | High rider density | Competitive rapid-commerce sector |
| Daily Orders Processed | 4.5–7 million orders daily | 1.8–3.2 million orders daily | Consistent upward trend | Frequent small-basket orders | Dark store optimization | Automated inventory systems | Discount-heavy campaigns | Large rider workforce | Highly fragmented competition |
| Average Cart Value | $8–16 per order | $42–105 per order | Steady increase | Frequent convenience shopping | Small basket optimization | Digital wallet adoption | Low-margin volume model | Compact urban logistics | Developing profitability model |
| Monthly Repeat Order Frequency | 12–22 orders per customer | 3–8 orders per customer | High engagement growth | Daily grocery dependence | Subscription-lite approach | Personalized app recommendations | Cashback and loyalty offers | Flexible gig workforce | Rapid consumer habit shift |
| Average Discount Percentage | 12–38% across grocery categories | 5–18% across grocery categories | Promotion-driven growth | High discount sensitivity | Vendor-funded promotions | Dynamic pricing engines | Heavy promotional activity | Localized demand forecasting | Price-war competitive market |
| Fastest Growing Category | Ready-to-eat meals and beverages | Frozen foods and organic groceries | Strong category expansion | Convenience-focused purchases | Specialized inventory management | Demand prediction tools | Category-specific promotions | Cold-chain delivery support | Diversifying product demand |
| Most Price-Sensitive Category | Packaged snacks and dairy | Household essentials | Stable demand pressure | Value-focused purchasing | Bulk supplier negotiations | Automated repricing systems | Competitive price matching | High-volume fulfillment | Highly competitive categories |
| Peak Shopping Window | 6 PM–11 PM | Weekend mornings and evenings | Demand spikes increasing | Evening convenience shopping | Shift-based fleet allocation | Predictive order scheduling | Surge pricing experiments | Peak-hour rider deployment | Maturing consumption patterns |
| Average Delivery Fee | $0.25–1.75 | $4.99–12.50 | Competitive pricing pressure | Low fee expectation | Subsidized delivery economics | Automated dispatch algorithms | Free-delivery incentives | Short-distance optimization | Cost-sensitive operations |
The rise of Real-time Price Comparison for Grocery Markets has enabled businesses to monitor competitive pricing changes instantly and optimize discounts according to regional demand behavior.
Digital grocery pricing is highly dynamic because of supplier costs, weather disruptions, regional demand surges, fuel prices, and seasonal purchasing trends. Retailers continuously adjust product pricing and promotional campaigns to remain competitive.
Advanced analytics systems track thousands of SKUs across grocery categories including dairy, beverages, packaged foods, frozen products, fresh produce, and household essentials.
| Product Category | India Avg Price Range | US Avg Price Range | Avg Discount India | Avg Discount US | Monthly Price Fluctuations India | Monthly Price Fluctuations US | Avg Daily Orders India | Avg Daily Orders US | Market Demand Trend |
|---|---|---|---|---|---|---|---|---|---|
| Milk 1L | $0.78–1.10 | $1.60–2.40 | 6–16% | 3–8% | 7–12 changes | 2–5 changes | 1.8M–2.4M | 320K–580K | Very High |
| Bread Loaf | $0.55–0.95 | $2.50–4.10 | 5–14% | 4–10% | 4–9 changes | 2–4 changes | 850K–1.2M | 240K–410K | High |
| Eggs 12 pcs | $1.10–1.95 | $3.20–5.80 | 4–12% | 3–9% | 6–11 changes | 3–6 changes | 720K–980K | 180K–360K | Stable |
| Rice 5kg | $5.00–9.20 | $12.50–19.50 | 10–24% | 2–6% | 8–15 changes | 2–5 changes | 520K–760K | 120K–250K | Growing |
| Cooking Oil 1L | $2.40–4.80 | $6.80–10.40 | 12–30% | 5–12% | 10–18 changes | 4–7 changes | 610K–930K | 150K–320K | High Volatility |
| Instant Noodles | $0.85–1.80 | $2.90–4.80 | 15–42% | 6–14% | 12–20 changes | 3–6 changes | 1.5M–2.8M | 210K–420K | Very High |
| Potato Chips | $0.90–1.70 | $2.80–4.60 | 18–45% | 8–20% | 10–19 changes | 4–8 changes | 1.2M–2.1M | 260K–510K | Impulse Driven |
| Soft Drinks | $0.75–1.45 | $2.20–4.20 | 15–35% | 6–16% | 8–15 changes | 3–7 changes | 1.4M–2.3M | 310K–540K | Seasonal Spike |
| Frozen Pizza | $3.10–5.90 | $7.80–12.60 | 5–15% | 12–28% | 5–9 changes | 6–11 changes | 160K–290K | 280K–460K | Strong in US |
| Ice Cream | $2.10–4.60 | $5.80–9.80 | 7–18% | 6–14% | 6–10 changes | 3–5 changes | 220K–410K | 180K–320K | Seasonal Demand |
| Fresh Fruits | $2.80–5.90 | $7.50–14.20 | 3–9% | 2–6% | 14–25 changes | 7–12 changes | 920K–1.6M | 210K–390K | Perishable High Demand |
| Breakfast Cereals | $3.60–6.90 | $6.20–11.80 | 4–10% | 8–22% | 4–8 changes | 4–9 changes | 180K–320K | 260K–430K | Health-Oriented Growth |
| Organic Vegetables | $4.20–8.80 | $9.20–16.40 | 2–8% | 3–10% | 12–20 changes | 6–10 changes | 140K–280K | 190K–350K | Premium Segment Growth |
| Chocolate Packs | $1.90–3.90 | $4.50–8.10 | 10–28% | 7–16% | 7–14 changes | 3–7 changes | 480K–790K | 140K–260K | Festive Sales Boost |
| Packaged Juice | $1.15–2.70 | $3.90–6.90 | 8–22% | 5–14% | 6–12 changes | 3–6 changes | 510K–820K | 170K–330K | Moderate Growth |
The growing availability of Grocery and Q-commerce Competitive Pricing data enables brands to identify pricing gaps, monitor promotional effectiveness, and improve category-level market positioning.
Modern grocery analytics systems collect and process large-scale retail information from websites, mobile apps, APIs, and digital storefronts. These systems capture pricing, discounts, inventory status, delivery timelines, search rankings, and assortment visibility across multiple geographic regions.
Retailers use these datasets for:
The use of large-scale Quick Commerce Datasets is helping businesses improve forecasting accuracy while reducing pricing inefficiencies across competitive grocery markets.
Similarly, advanced Grocery Data Intelligence platforms are enabling FMCG brands and retailers to understand changing purchasing patterns, category demand shifts, and regional pricing trends with greater precision.
The next phase of grocery intelligence will be driven by AI-powered recommendation systems, automated price optimization engines, hyperlocal assortment planning, and predictive demand analytics. Retailers will increasingly use machine learning algorithms to automate promotional planning and respond instantly to competitor actions.
Digital grocery ecosystems across India and the US are expected to become even more data-centric as retailers prioritize operational efficiency and customer retention.
The grocery and quick commerce sectors across India and the United States are rapidly evolving into highly competitive, data-driven ecosystems where pricing transparency, delivery efficiency, and promotional intelligence directly influence consumer loyalty and market share.
Technologies such as Web Scraping Quick Commerce Data are enabling organizations to automate large-scale retail intelligence collection while monitoring pricing changes, inventory shifts, and promotional campaigns in real time. Advanced Quick Commerce Data Scraping API solutions further support seamless integration between extraction systems, forecasting platforms, and analytics dashboards.
Businesses leveraging modern Quick Commerce Data Intelligence Services can optimize pricing strategies, strengthen competitive positioning, improve inventory planning, and enhance decision-making across fast-changing grocery commerce environments.
Are you in need of high-class scraping services? Food Data Scrape should be your first point of call. We are undoubtedly the best in Food Data Aggregator and Mobile Grocery App Scraping service and we render impeccable data insights and analytics for strategic decision-making. With a legacy of excellence as our backbone, we help companies become data-driven, fueling their development. Please take advantage of our tailored solutions that will add value to your business. Contact us today to unlock the value of your data.



