
Introduction
"How many Indo-Chinese restaurants are there in India, by pincode?" It sounds like a simple question. In practice, no government register or industry body publishes it. Yet consulting teams ask it all the time, because the answer drives decisions worth crores: where to launch a sauce brand, how many outlets a QSR chain can open in a city, which towns are under-served by a cuisine, and how large a distributor's addressable market really is.
In September and October 2026, Food Data Scrape received exactly this kind of request from global strategy consultancies. One wanted Indo-Chinese restaurant counts by pincode, city and state, with sales indicators where available. Another wanted outlet counts and rating counts city by city across Google Maps, Zomato and Swiggy. A third simply asked for "a dataset of all the restaurants in India." This guide explains how Restaurant Data Scraping by Pincode turns public listings into reliable market-sizing numbers.
Why pincode is the right unit
India has about 19,000 pincodes. They are granular enough to show differences between neighbourhoods but stable enough to compare over time. Pincode-level data lets you:
- Roll up to city, district and state totals with no extra collection.
- Compare density by joining to population or household data.
- Map catchments for new outlets, distributors or sales territories.
- Spot white space, where a cuisine is popular nationally but thin locally.
City-level counts hide too much. Bengaluru's Koramangala and its outer suburbs behave like different markets, and a pincode view shows that clearly.
The three main public sources
| Source | Strengths | Limits |
|---|---|---|
| Zomato | Wide coverage of delivery and dine-in restaurants, cuisine tags, cost for two, ratings | Mainly urban; some listings are inactive |
| Swiggy | Strong delivery coverage, cuisine tags, delivery ratings | Delivery-only view; outlets that do not deliver may be missing |
| Google Maps | Broadest coverage including small towns and non-delivery outlets; rating counts | Cuisine tagging is less consistent; categories are broad |
No single source is complete. A reliable count combines all three and removes duplicates.
How restaurant data scraping by pincode works
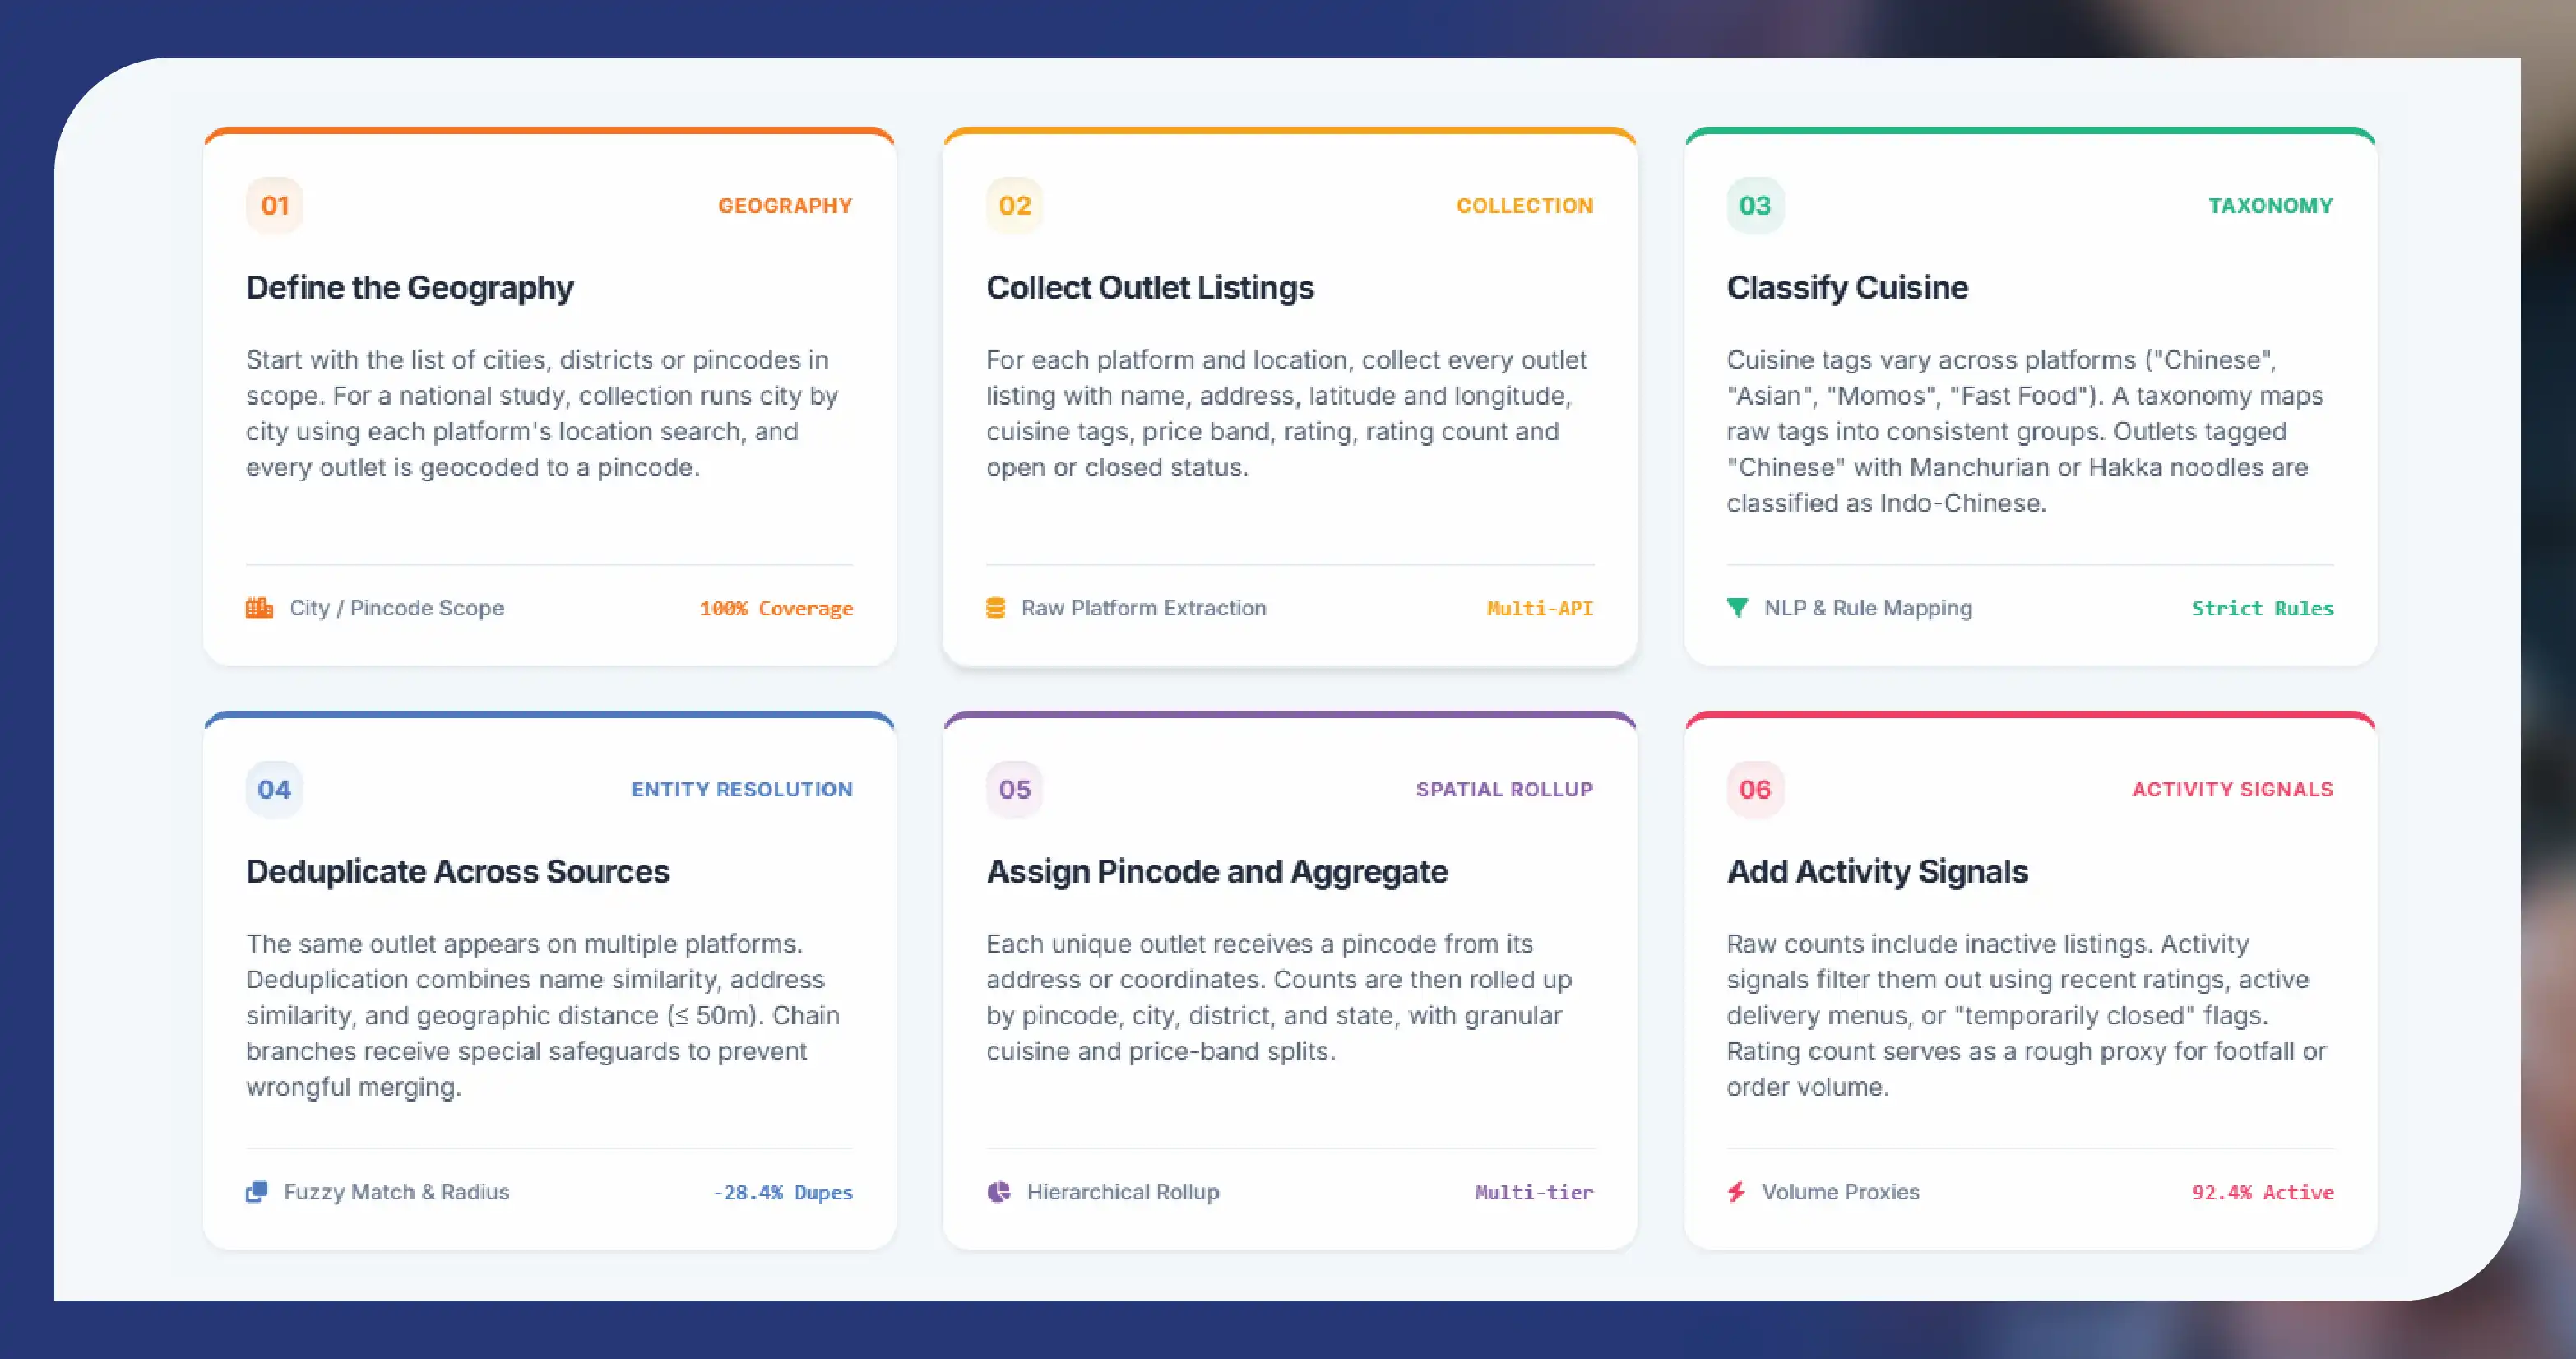
Step 1: Define the geography
Start with the list of cities, districts or pincodes in scope. For a national study, collection runs city by city using each platform's location search, and every outlet is geocoded to a pincode.
Step 2: Collect outlet listings
For each platform and location, collect every outlet listing with name, address, latitude and longitude, cuisine tags, price band, rating, rating count and open or closed status.
Step 3: Classify cuisine
Cuisine tags vary between platforms. "Chinese", "Asian", "Indo-Chinese", "Momos" and "Fast Food" may all describe similar outlets. A cuisine taxonomy maps raw tags into consistent groups. For a study focused on one cuisine, the rules are tightened. For example, an outlet tagged "Chinese" with menu items such as Manchurian, chili paneer or Hakka noodles is classified as Indo-Chinese.
Step 4: Deduplicate across sources
The same outlet often appears on all three platforms. Deduplication combines name similarity, address similarity and geographic distance. Two listings with similar names within 50 metres are usually the same outlet. Chains with many branches need extra care so separate branches are not merged.
Step 5: Assign pincode and aggregate
Each unique outlet receives a pincode from its address or coordinates. Counts are then rolled up by pincode, city, district and state, with cuisine and price-band splits.
Step 6: Add activity signals
Raw counts include some inactive listings. Activity signals help filter them: a recent rating, an active delivery menu or a "temporarily closed" flag. Rating count also serves as a rough proxy for footfall or order volume.
The record below is illustrative.
{
  "outlet_uid": "FDS-IN-0028841",
  "outlet_name": "Example Wok House",
  "pincode": "560034",
  "city": "Bengaluru",
  "state": "Karnataka",
  "latitude": 12.9352,
  "longitude": 77.6245,
  "cuisine_group": "Indo-Chinese",
  "raw_cuisine_tags": ["Chinese", "Momos", "Fast Food"],
  "price_band": "INR 300-600 for two",
  "sources": ["zomato", "swiggy", "google_maps"],
  "google_rating": 4.1,
  "google_rating_count": 1284,
  "zomato_rating": 3.9,
  "is_active": true
}
| Pincode | City | Indo-Chinese outlets | All restaurants | Share of total | Median rating count |
|---|---|---|---|---|---|
| 560034 | Bengaluru | 86 | 742 | 11.6% | 310 |
| 400053 | Mumbai | 64 | 615 | 10.4% | 280 |
| 110017 | Delhi | 71 | 690 | 10.3% | 295 |
| 700091 | Kolkata | 58 | 402 | 14.4% | 190 |
| 411014 | Pune | 39 | 388 | 10.1% | 205 |
All figures are illustrative.
Turning counts into market-sizing insight
Counts alone are not market size. Consultants usually combine outlet data with a few assumptions to estimate value:
- Outlet count by cuisine and pincode from restaurant data scraping by pincode.
- Activity weighting using rating count or delivery availability to separate busy outlets from small ones.
- Average ticket from the platform's cost-for-two band.
- Orders per day from industry benchmarks or primary research.
- Estimated revenue per pincode = active outlets × orders per day × average ticket × days.
The outlet data provides the hard, verifiable base. The assumptions are clearly separated so clients can test them.
Note: Food Data Scrape provides outlet counts, public ratings and price bands. Restaurant sales figures are not published by these platforms, so any sales estimate is a model built on public signals, not reported revenue.
A worked example: sizing Indo-Chinese in five cities
Imagine a sauce brand wants to launch a food-service pack of soy, chilli and schezwan sauce for Indo-Chinese restaurants. It needs to choose two launch cities out of five. Restaurant data scraping by pincode gives the base numbers:
| City | Indo-Chinese outlets | Active outlets (rated in last 90 days) | Outlets per lakh population | Median cost for two (INR) |
|---|---|---|---|---|
| Kolkata | 4,850 | 3,900 | 31 | 400 |
| Bengaluru | 4,200 | 3,600 | 32 | 450 |
| Mumbai | 5,100 | 4,100 | 25 | 500 |
| Pune | 2,300 | 1,950 | 30 | 400 |
| Hyderabad | 2,600 | 2,150 | 24 | 400 |
All figures are illustrative.
Mumbai has the most outlets, but Kolkata and Bengaluru show higher density per population and a large active base. Adding distributor coverage and price band, the brand might choose Kolkata and Bengaluru for the launch and use pincode clusters to plan its first sales routes. The same method works for any cuisine and product.
Indo-Chinese, momos and the problem of overlapping tags
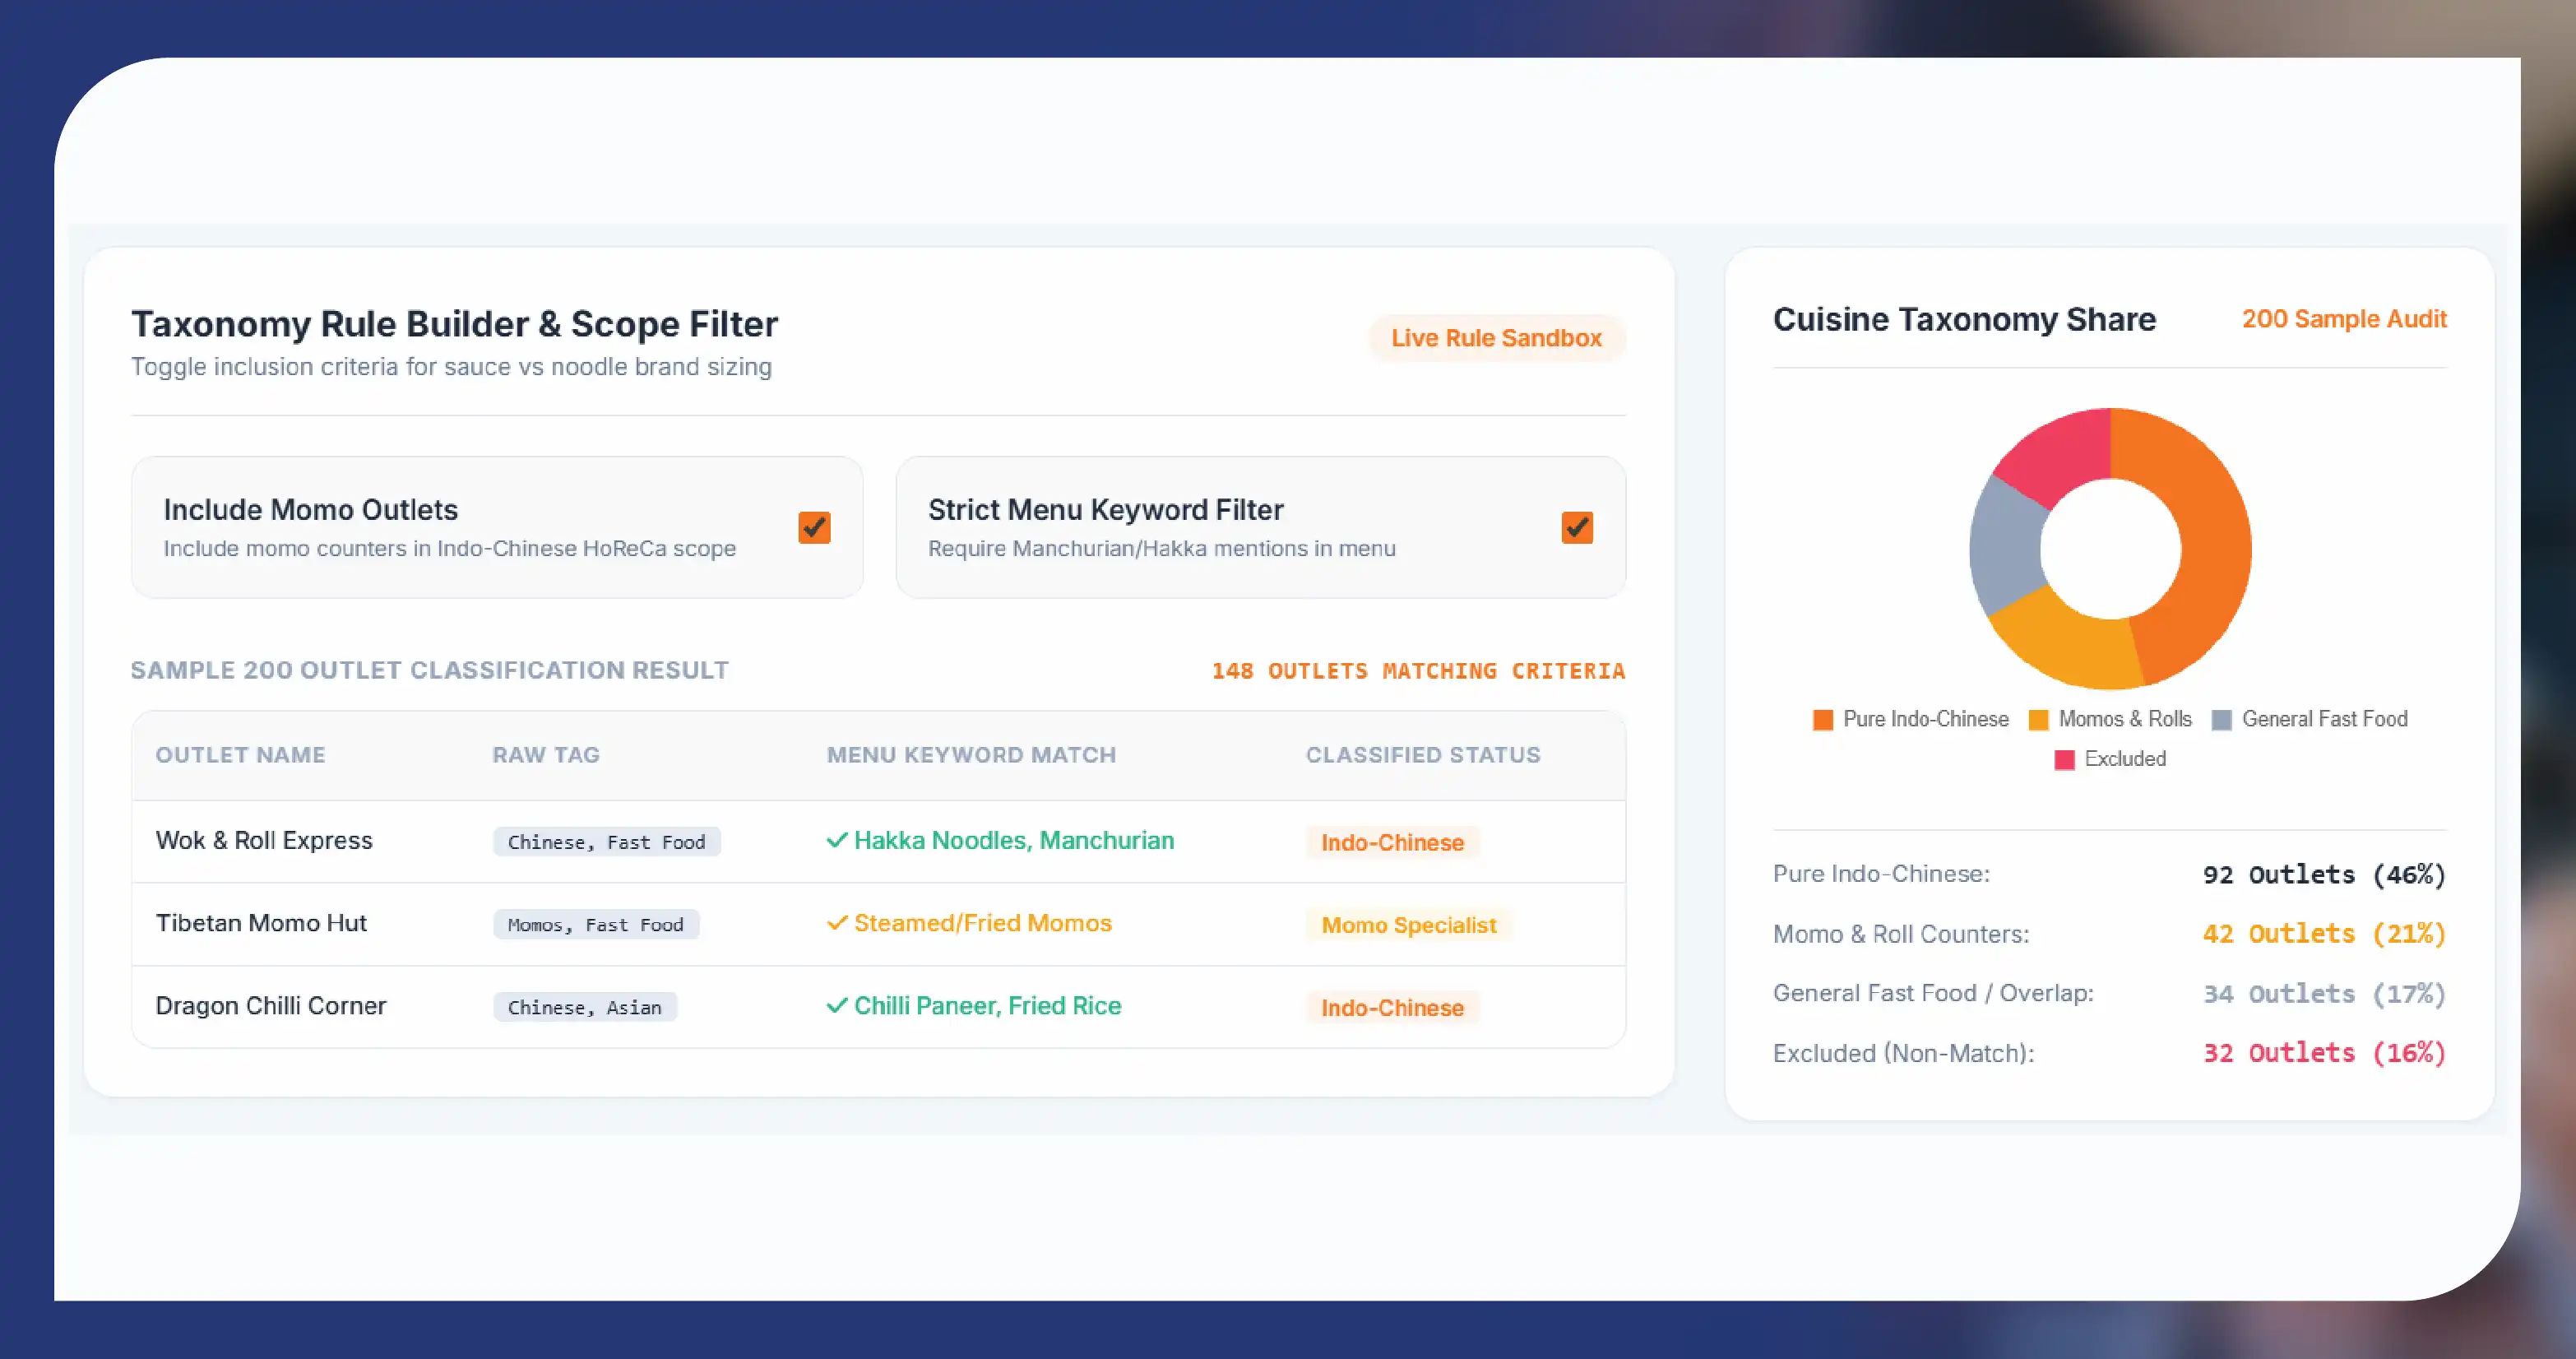
Cuisine tagging is where many market-sizing projects go wrong. In India, "Chinese" on a delivery platform almost always means Indo-Chinese, but many momo shops, roll counters and fast-food outlets also carry the tag. A sauce brand might want to include momo outlets; a noodle brand might not. The answer is to keep both the raw tags and the cleaned cuisine group, and to define the rule with the client before collection starts. Food Data Scrape typically shares a sample of 200 classified outlets for review so both sides agree on what each group means.
Common uses
- FMCG and sauce brands sizing the HoReCa channel for a cuisine before launching a food-service pack.
- QSR chains choosing expansion cities and pincodes where their cuisine is under-represented.
- Distributors planning sales territories by outlet density.
- Kitchen equipment and packaging suppliers estimating demand by city.
- Investors comparing cuisine growth across tier-1, tier-2 and tier-3 cities.
Data quality checks
| Check | Why it matters |
|---|---|
| Duplicate rate across sources | Over-counting inflates market size |
| Share of outlets with a valid pincode | Outlets without a pincode cannot be aggregated |
| Share of inactive or closed listings | Old listings make markets look bigger than they are |
| Cuisine classification sample review | Ensures the cuisine group means what the client expects |
| Chain branch check | Prevents separate branches being merged |
How often should you refresh?
A one-time snapshot is enough for a market-entry study. For tracking growth, a quarterly refresh shows net openings and closures by pincode. Brands running sales programmes often prefer a monthly refresh in their priority cities.
Questions
Frequently Asked Questions
Yes. Google Maps coverage extends well beyond the big metros, and combining it with Zomato and Swiggy gives the most complete view.
Food Data Scrape provides business-level information that outlets publish, such as outlet name, address and public business phone where listed. Personal phone numbers of individuals are not provided.
A national snapshot typically takes two to four weeks, depending on the number of cities and the cuisine rules.
Yes. The cuisine taxonomy covers all major groups, so a single dataset can answer questions for North Indian, South Indian, Indo-Chinese, pizza, biryani, cafes, bakeries and more.
Key takeaways
- No public register gives restaurant counts by cuisine and pincode in India; combining Zomato, Swiggy and Google Maps data does.
- Cuisine classification and cross-source deduplication are what make the numbers reliable.
- Rating counts and price bands add activity and value signals for market sizing.
- Sales figures are modelled from public signals, not reported.
Get your cuisine-by-pincode dataset
Food Data Scrape builds restaurant data scraping by pincode projects for consultants, FMCG brands and QSR chains across India. Tell us your cuisines, cities and deadline, and we will share a sample pincode-level dataset within days.
Get a Free Food Data Sample in 48 Hours.
Tell us your platforms, target markets and required fields — we'll map exactly what's possible with food data scraping, recommend the right approach, and send a working sample so you can verify quality before any commitment.
Request a strategy call
Thanks — our data team will reach out within 48 hours with your sample.



