

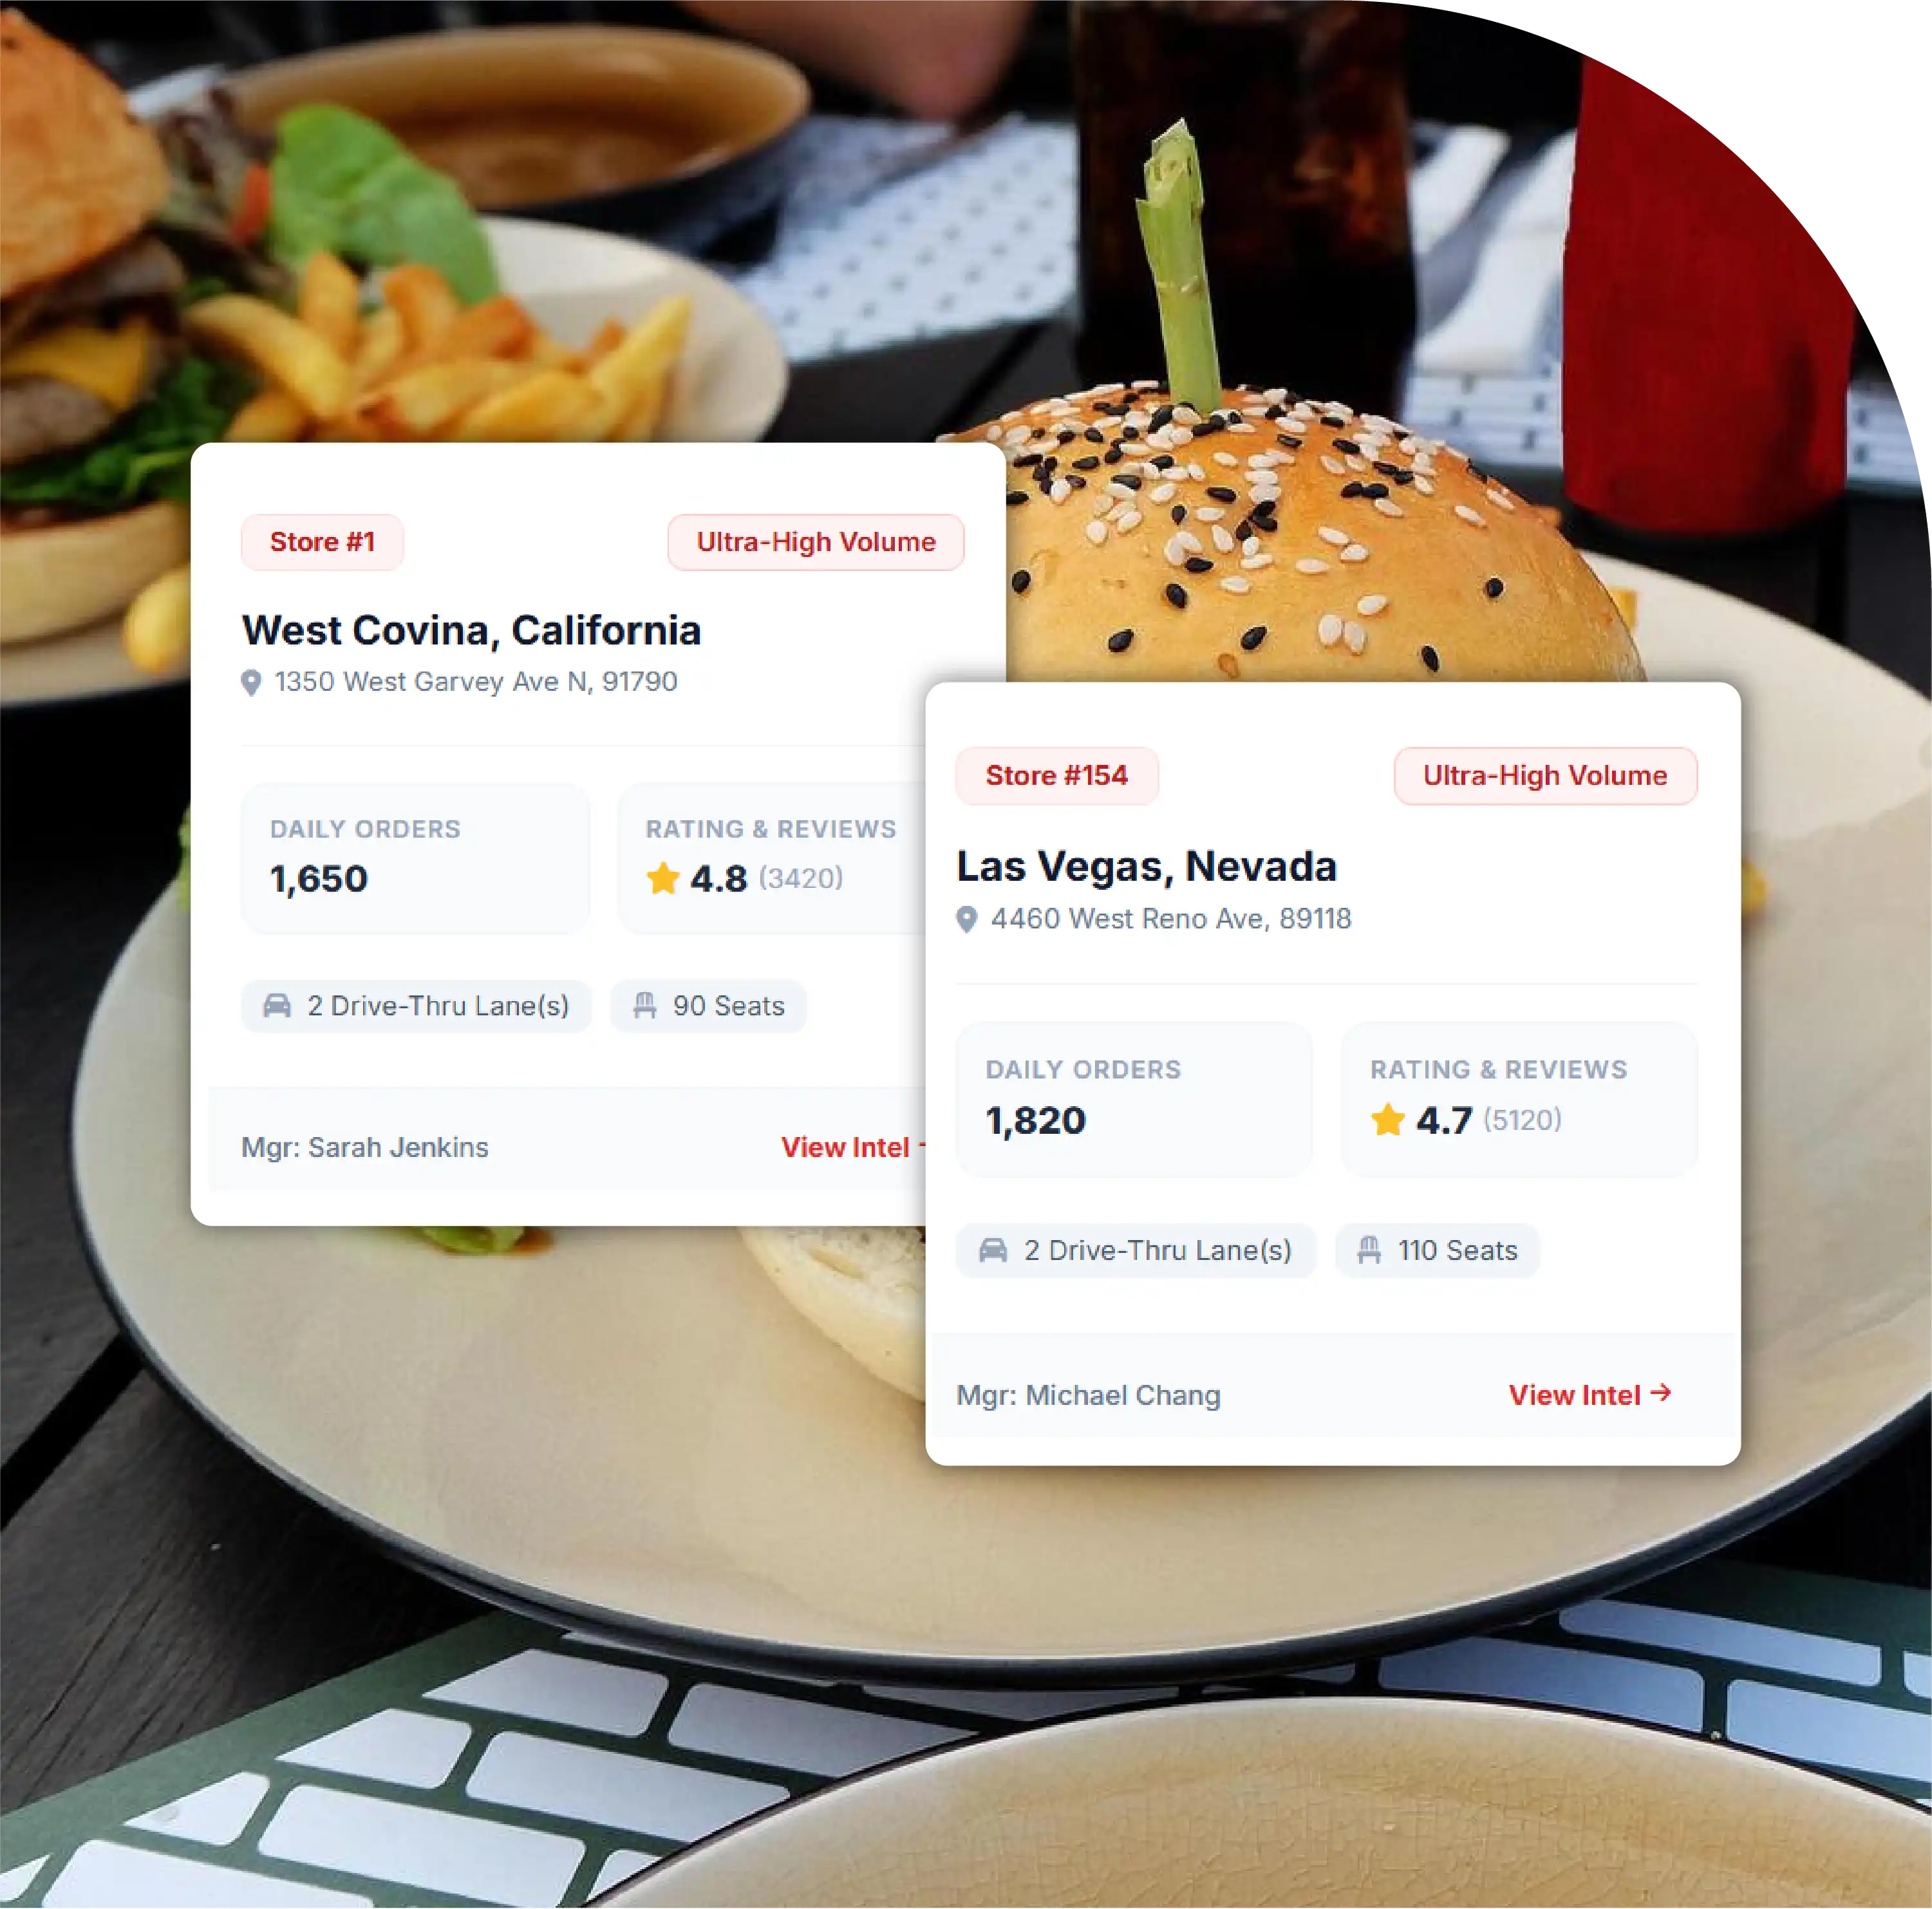
442 Restaurant Locations: In-N-Out Burger operates 442 restaurants across ten U.S. states.
California Market Dominance: California contains 289 restaurants, representing approximately 65% nationally.
Texas And Arizona: Texas has 43 locations, while Arizona operates 40 restaurants.
314 Cities Covered: The restaurant network extends across 314 cities nationwide.
Las Vegas Leadership: Las Vegas has the highest concentration, with 15 restaurant locations.

The United States restaurant market continues to evolve around geographic expansion, population concentration, consumer demand, and strategic store placement. In-N-Out Burger remains a distinctive example of a regional restaurant chain with a highly concentrated footprint across selected American states. As of August 19, 2026, the chain has 442 restaurants across 10 states and territories and 314 cities in the United States.
For businesses analyzing restaurant expansion, competitive positioning, and local food-service demand, Scrape In-N-Out Burger Restaurant Data In United States 2026 provides a structured way to understand where the chain operates, how locations are distributed, and which markets contain the greatest concentration of restaurants.
Similarly, organizations can Extract In-N-Out Burger Location Data to evaluate addresses, cities, states, ZIP codes, geographic coordinates, and location-level market coverage. Such structured information can support restaurant site-selection studies, territory analysis, competitor mapping, and regional market research.
Another important application is In-N-Out Burger Store Locator Data Extraction USA, which can transform store-locator information into standardized datasets suitable for geographic analysis, dashboards, and business intelligence workflows.
The August 2026 dataset shows that California dominates the chain's footprint, accounting for 289 restaurants, or approximately 65% of its U.S. locations. Texas follows with 43 restaurants, while Arizona has 40. Nevada, Utah, and Colorado also represent meaningful markets, demonstrating that the chain's footprint extends beyond its traditional California base while remaining concentrated within a limited geographic territory.
The 442-location footprint provides an important snapshot of the chain's physical presence in the U.S. restaurant industry. Rather than distributing restaurants evenly across the country, In-N-Out Burger operates in 10 states and territories, creating a highly concentrated network.
California alone accounts for 289 locations. This means nearly two out of every three In-N-Out Burger restaurants in the analyzed dataset are located within California. The concentration reflects the importance of California to the brand's restaurant network and creates substantial location density across major metropolitan and suburban markets.
Texas has 43 restaurants, representing approximately 10% of the national footprint. Arizona follows closely with 40 locations, accounting for approximately 9%. Nevada has 24 restaurants, while Utah and Colorado each have 15.
The remaining four operating states—Tennessee, Oregon, Idaho, and Washington—have considerably smaller footprints. Tennessee and Oregon each contain five locations, Idaho has four, and Washington has two.
This distribution provides useful insight into how restaurant chains can establish strong regional networks before expanding into additional markets.
The following table organizes the major location indicators from the supplied 2026 dataset.
| Rank | State / Territory | Restaurant | Share of U.S. Location (%) | Population (M) | Population per Restaurant | Approx. Location per 1M People | Relative Footprint |
|---|---|---|---|---|---|---|---|
| 1 | California | 289 | 65 | 39.35 | 136,180 | 7.34 | Very High |
| 2 | Texas | 43 | 10 | 31.71 | 737,440 | 1.36 | High |
| 3 | Arizona | 40 | 9 | 7.62 | 190,600 | 5.25 | Very High |
| 4 | Nevada | 24 | 5 | 3.28 | 136,750 | 7.31 | Very High |
| 5 | Utah | 15 | 3 | 3.54 | 235,930 | 4.24 | High |
| 6 | Colorado | 15 | 3 | 6.01 | 400,870 | 2.49 | |
| 7 | Tennessee | 5 | 1 | 7.32 | 1,460,000 | 0.68 | |
| 8 | Oregon | 5 | 1 | 4.27 | 854,800 | 1.17 | |
| 9 | Idaho | 4 | 1 | 2.03 | 507,500 | 1.97 | |
| 10 | Washington | 2 | 0 | 8.00 | 4,000,000 | 0.25 | |
| 10 States/Territories | 442 | 100 | — | — | — |
The population-per-restaurant figures demonstrate how differently the chain is positioned across its operating markets. California has approximately one restaurant for every 136,180 residents, while Texas has approximately one restaurant for every 737,440 residents.
Arizona also has a relatively dense footprint, with approximately one restaurant for every 190,600 residents. Nevada has a similar population-per-location ratio to California at approximately 136,750 residents per restaurant.
These differences are important for restaurant market intelligence because raw location counts alone do not reveal the complete market picture. Comparing restaurants against population can help analysts understand geographic penetration and potential market density.
At the city level, the dataset contains 314 cities. Las Vegas leads the listed markets with 15 restaurants, followed by Phoenix with eight and San Diego with seven.
Mesa, Fresno, Tucson, Dallas, Fort Worth, and Sacramento each have five restaurants. Los Angeles has four.
The city-level concentration highlights the importance of metropolitan markets in the chain's distribution strategy. Large population centers provide substantial customer pools, while established suburban corridors can support multiple locations within relatively compact geographic areas.
City-level restaurant data can also help businesses analyze local competition, restaurant saturation, potential delivery coverage, commercial real-estate opportunities, and consumer accessibility.
| Rank | City | State | Locations | Share of 442 (%) | Population-Market Context | Location Density Category | Primary Market Type |
|---|---|---|---|---|---|---|---|
| 1 | Las Vegas | Nevada | 15 | 3.39 | Major metro | Very High | Urban / Tourism |
| 2 | Phoenix | Arizona | 8 | 1.81 | Major metro | High | Urban / Suburban |
| 3 | San Diego | California | 7 | 1.58 | Major metro | High | Urban / Coastal |
| 4 | Mesa | Arizona | 5 | 1.13 | Large metro suburb | High | Suburban |
| 5 | Fresno | California | 5 | 1.13 | Regional city | High | Urban / Regional |
| 6 | Tucson | Arizona | 5 | 1.13 | Major regional market | High | Urban / Suburban |
| 7 | Dallas | Texas | 5 | 1.13 | Major metro | High | Urban / Suburban |
| 8 | Fort Worth | Texas | 5 | 1.13 | Major metro | High | Urban / Suburban |
| 9 | Sacramento | California | 5 | 1.13 | State capital / Metro | High | Urban / Suburban |
| 10 | Los Angeles | California | 4 | 0.90 | Major metro | Moderate | Urban |
| — | Other 304 cities | Multiple | 388 | 87.78 | Diverse markets | Mixed | Urban / Suburban / Regional |
| Total | 314 Cities | 10 States/Territories | 442 | 100 | U.S. Network | Mixed | Multi-market |
The leading cities collectively account for 54 locations, equivalent to approximately 12.2% of the total U.S. network. The remaining 388 restaurants are distributed among 304 cities, showing that the chain's footprint extends considerably beyond its highest-density city markets.
California's 289 restaurants are the most significant component of the 2026 network. At approximately 65% of total locations, the state contains more than six times the number of restaurants found in Texas, the second-largest market.
The geographic breadth of California also creates opportunities for more granular location analysis. Researchers can examine restaurant distribution by metropolitan area, city, ZIP code, latitude and longitude, and population density.
For businesses studying In-N-Out Burger Restaurant Market Intelligence, state-level counts can be combined with city-level information to identify concentrated markets, emerging territories, and areas with limited brand presence.
A comprehensive In-N-Out Burger Store Location Dataset can further support geospatial visualization, competitor benchmarking, territory planning, and restaurant expansion analysis.
The supplied data identifies 46 states and territories without an In-N-Out Burger restaurant. These include large population markets such as Florida, New York, Illinois, Pennsylvania, Ohio, Georgia, Michigan, North Carolina, and New Jersey, alongside smaller states and U.S. territories.
The absence of locations does not necessarily indicate consumer demand or market attractiveness. Instead, it demonstrates the geographic boundaries of the chain's current operating footprint.
For analysts, comparing operating states with non-operating states can help create expansion-market datasets. Businesses can combine restaurant locations with population, income, real-estate costs, traffic patterns, food-service demand, and competitor presence to conduct broader market assessments.
Location-level restaurant records can contain multiple attributes, including restaurant name, street address, city, state, ZIP code, telephone number, latitude, longitude, country, and last-updated date.
The supplied sample illustrates how geographic coordinates can complement conventional address information. Latitude and longitude enable businesses to plot locations on interactive maps, calculate distances between restaurants, identify clusters, and analyze proximity to competitors or commercial areas.
For companies undertaking US Restaurant Chain Location Data Scraping, standardized fields can make thousands of restaurant records easier to compare across markets and brands.
The information can also contribute to location intelligence dashboards. For example, a business could visualize restaurant counts by state, calculate location density by population, identify cities with multiple outlets, and monitor changes in the restaurant network over time.
Restaurant location data becomes more valuable when it is combined with broader competitive datasets. Analysts can compare restaurant chains by geographic footprint, store density, city penetration, expansion pace, and market overlap.
Through In-N-Out Burger Competitive Data Scraping, businesses can develop structured datasets for comparing the chain with other quick-service restaurant brands. These comparisons may include restaurant locations, menu categories, pricing, ratings, operating hours, promotions, delivery availability, and geographic coverage.
This approach transforms static restaurant lists into a broader competitive intelligence resource. It can support franchise research, commercial real-estate analysis, food-delivery market studies, restaurant technology projects, and regional expansion planning.
The U.S. restaurant sector contains thousands of brands and hundreds of thousands of locations, making structured data increasingly important for market research. Food Data Scraping in the USA can provide information needed to understand restaurant networks at state, city, ZIP-code, and neighborhood levels.
The same datasets can be enriched with menu and pricing information. Restaurant Menu Data Scraping Services can help organizations analyze menu items, prices, categories, ingredients, dietary labels, promotions, and other restaurant attributes alongside location information.
Modern analytics can further combine structured restaurant records with automated classification and monitoring. AI Restaurant Intelligence can help transform large restaurant datasets into searchable insights, market dashboards, competitive comparisons, and location-based business intelligence.
The August 19, 2026 snapshot highlights several important characteristics of In-N-Out Burger's U.S. network:
Together, these figures demonstrate a highly concentrated restaurant network with strong regional depth and comparatively limited national geographic coverage.
The number of In-N-Out Burger restaurants in the United States reached 442 locations as of August 19, 2026, with operations spanning 10 states and territories and 314 cities. California remains the dominant market with 289 restaurants, while Texas and Arizona form the next-largest components of the network.
For companies analyzing restaurant expansion, geographic penetration, and competitive positioning, the dataset provides a foundation for identifying market concentration and comparing restaurant coverage across cities and states. Location-level attributes such as addresses, ZIP codes, coordinates, and update dates make the information suitable for mapping and business intelligence applications.
Future analysis can expand beyond restaurant counts by integrating Cuisine-wise Menu Data with location, pricing, ratings, operating hours, and competitive information. Combining these elements with Food Data Scraping Services can create continuously updated restaurant intelligence for market researchers, food businesses, retailers, delivery platforms, and technology providers.
Organizations can also Scrape Restaurant API Data to integrate restaurant information directly into analytical systems, dashboards, applications, and automated monitoring workflows. As restaurant markets become increasingly data-driven, structured location intelligence can help businesses monitor geographic footprints, benchmark competitors, evaluate market opportunities, and build more comprehensive restaurant intelligence platforms.
If you are seeking for a reliable data scraping services, Food Data Scrape is at your service. We hold prominence in Food Data Aggregator and Mobile Restaurant App Scraping with impeccable data analysis for strategic decision-making.



