

The Scrape Matcha Latte Trends Data 2026 report provides comprehensive insights into global matcha beverage demand, pricing, menu innovation, consumer preferences, and competitive market intelligence. The report examines how matcha latte is expanding across cafés, QSRs, specialty tea chains, supermarkets, convenience stores, and food delivery platforms. It analyzes regional market performance across key markets including the United States, Australia, UAE, Japan, South Korea, Singapore, Canada, and European markets, covering average pricing, menu growth, consumer demand, premium-grade adoption, dairy-free orders, ready-to-drink growth, and customer ratings. The report also tracks consumer purchasing behavior, pricing strategies, product innovation, competitive benchmarking, and demand signals across matcha variants. Insights into flavors such as strawberry, mango, pistachio, vanilla, lavender, and brown sugar help businesses identify emerging opportunities and optimize product portfolios.
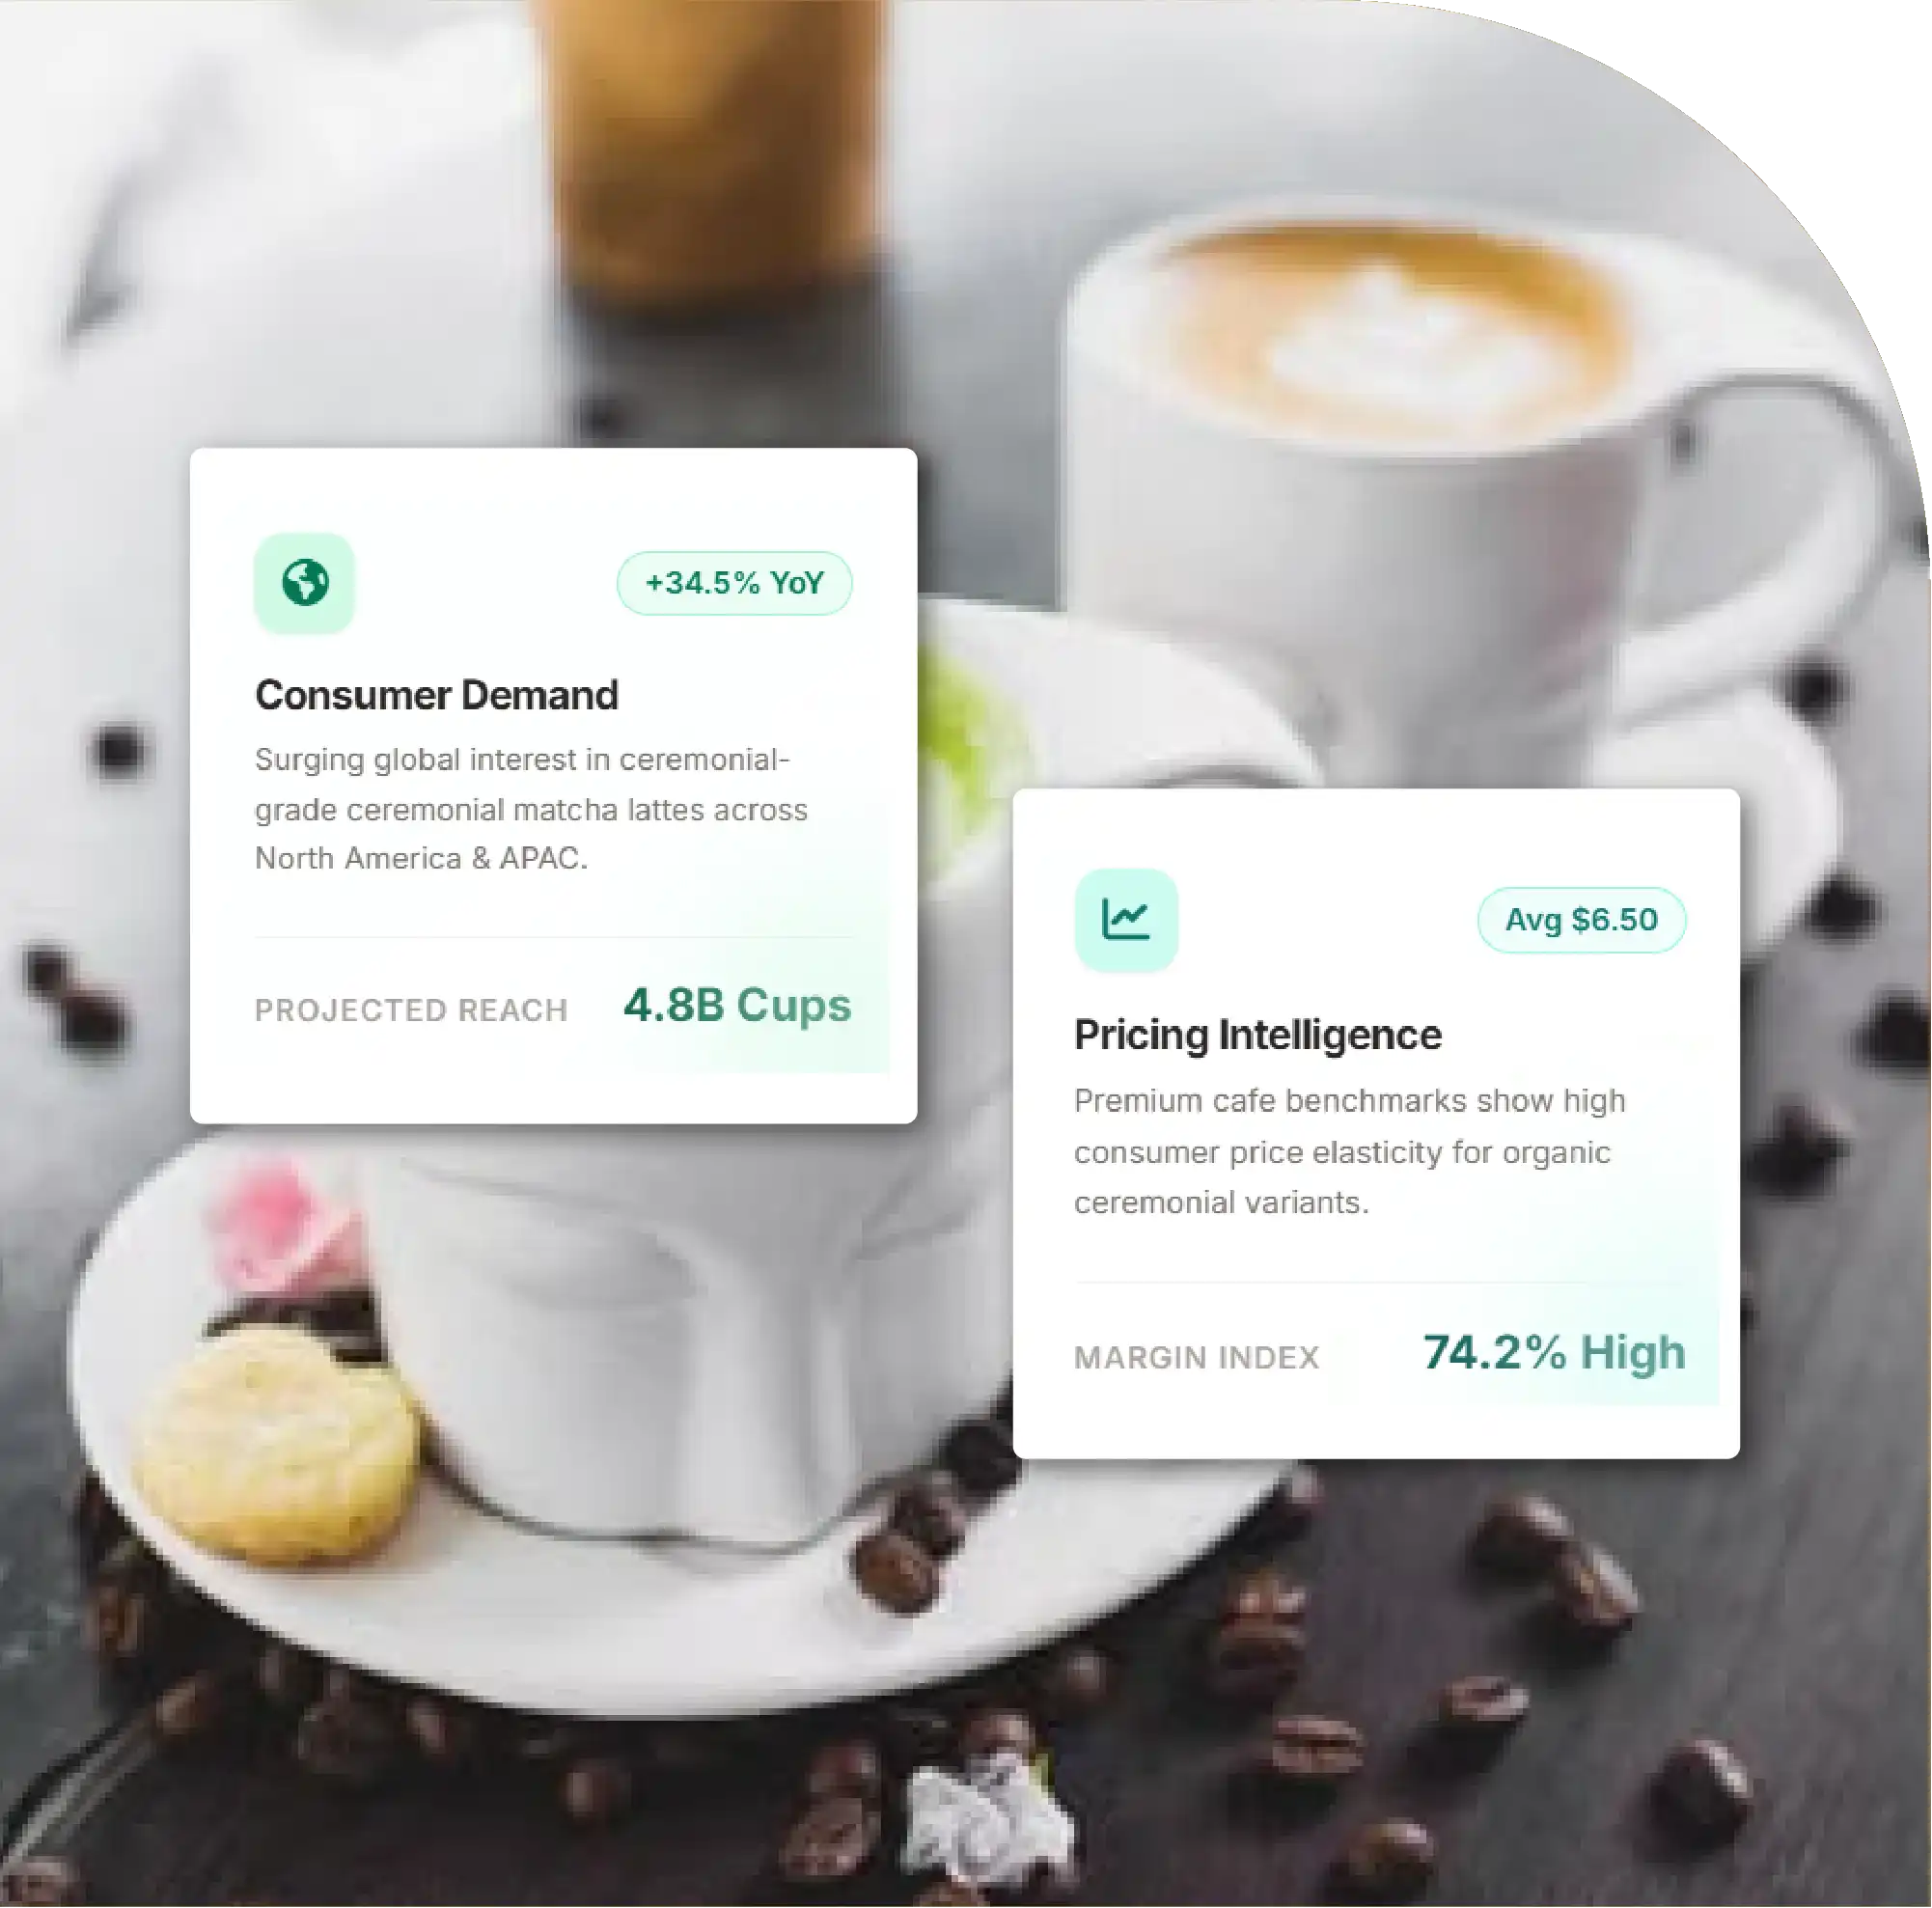
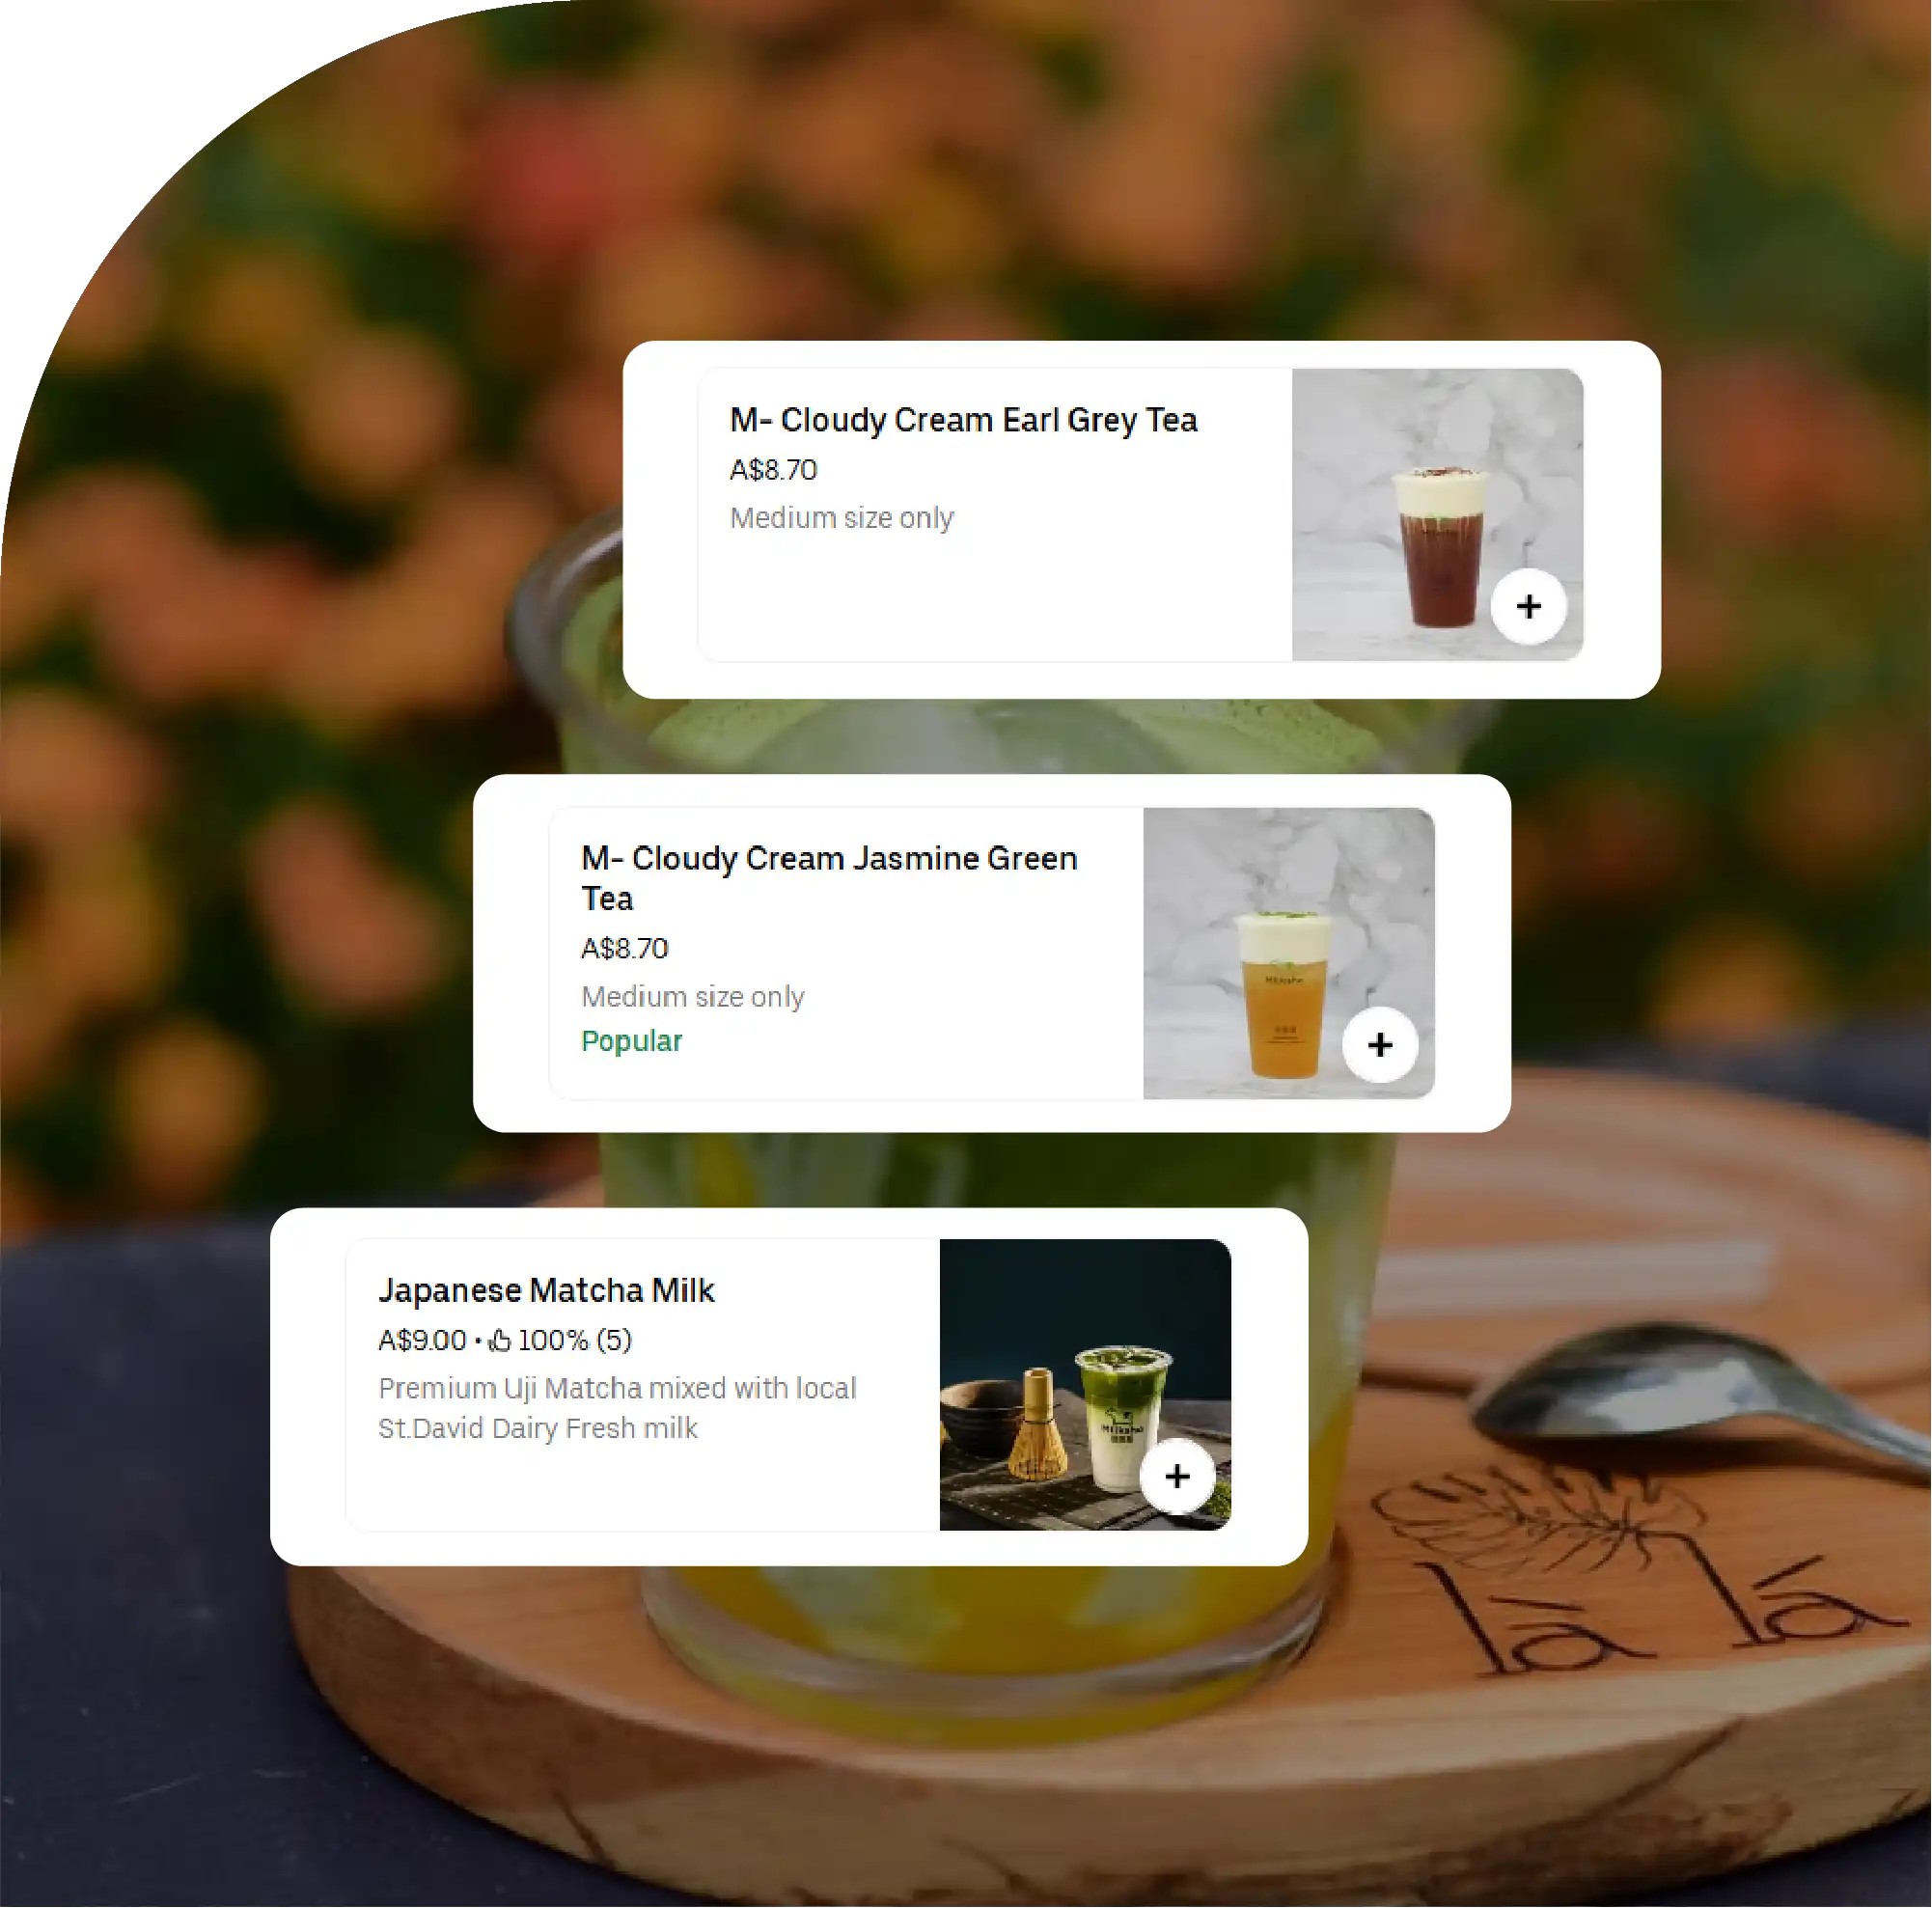
Menu Data Extraction
Automated collection of matcha menu offerings, product variants, pricing, availability, and promotional information across foodservice and retail channels.
Market Intelligence
Regional visibility into matcha demand, menu growth, consumer preferences, premium adoption, and market performance across major global markets.
Pricing Analytics
Track average prices, premium positioning, discounts, regional price variations, and pricing differences across cafés, retailers, and delivery platforms.
Consumer Insights
Analyze dairy-free preferences, flavor demand, customer ratings, repeat purchases, delivery orders, and changing consumer behavior around matcha beverages.

The global food and beverage industry is witnessing unprecedented demand for premium tea-based beverages, with matcha latte emerging as one of the fastest-growing menu categories in cafés, quick-service restaurants, specialty coffee chains, and retail outlets. Rising awareness of antioxidants, clean-label ingredients, plant-based lifestyles, and functional beverages has significantly accelerated market expansion across North America, Europe, Asia-Pacific, and the Middle East.
For restaurants, beverage manufacturers, retailers, and market intelligence companies, understanding evolving consumer preferences requires continuous access to structured market data. Scrape Matcha Latte Trends Data 2026 to monitor changing menu offerings, product launches, regional demand patterns, seasonal promotions, and pricing fluctuations across thousands of digital platforms. As competition intensifies among premium beverage brands, Matcha Latte Trends Data Scraping has become an essential tool for monitoring competitor innovation, identifying successful flavor combinations, and tracking menu expansion across different regions. At the same time, Matcha Pricing Data Scraping provides valuable visibility into pricing strategies, premium positioning, promotional discounts, and regional price variations, allowing businesses to optimize revenue while remaining competitive.
The commercial evolution of matcha has accelerated considerably over the past five years. Large coffee chains, independent cafés, supermarkets, convenience stores, and food delivery platforms have all expanded their matcha offerings to satisfy growing consumer demand. Unlike traditional green tea products, matcha has developed into a versatile ingredient that supports both beverage and culinary innovation. Hot lattes, iced beverages, smoothies, frappes, bakery products, desserts, protein drinks, and ready-to-drink canned beverages have all contributed to category expansion.
Consumer purchasing decisions increasingly reflect a preference for beverages that combine functionality with premium taste experiences. Matcha satisfies this expectation by offering sustained energy, lower perceived caffeine intensity than coffee, and a distinctive flavor profile that can be paired with ingredients such as vanilla, strawberry, pistachio, yuzu, lavender, chocolate, and oat milk. This versatility enables foodservice operators to continually introduce limited-time offerings while maintaining premium pricing.
Regional demand varies considerably depending on café culture, consumer awareness, purchasing power, and retail maturity. Markets with established specialty coffee industries have generally experienced faster adoption of premium matcha beverages, while emerging markets continue to demonstrate strong year-over-year growth through supermarket expansion and online food delivery services.
| Region | Average Latte Price (USD) | Menu Growth YoY | Consumer Demand Growth | Premium Grade Adoption | Dairy-Free Orders | Ready-to-Drink Growth | Average Customer Rating |
|---|---|---|---|---|---|---|---|
| United States | 6.45 | 31.8% | 34.5% | 61% | 64% | 29% | 4.8 |
| Canada | 5.98 | 27.2% | 30.1% | 56% | 59% | 25% | 4.7 |
| United Kingdom | 5.90 | 29.6% | 32.8% | 54% | 62% | 24% | 4.7 |
| Australia | 6.80 | 35.9% | 39.7% | 69% | 66% | 32% | 4.9 |
| Japan | 5.25 | 18.4% | 21.5% | 84% | 28% | 19% | 4.8 |
| South Korea | 6.18 | 32.4% | 36.8% | 63% | 49% | 34% | 4.8 |
| Singapore | 6.52 | 30.1% | 34.2% | 60% | 53% | 31% | 4.8 |
| Germany | 5.82 | 24.6% | 27.8% | 52% | 47% | 22% | 4.6 |
| France | 5.75 | 22.9% | 25.4% | 50% | 43% | 20% | 4.6 |
| UAE | 7.15 | 38.6% | 42.3% | 72% | 56% | 36% | 4.9 |
The data illustrates that Australia, the UAE, and the United States remain among the strongest premium markets, while Japan continues to lead in ceremonial-grade product adoption. Markets such as the United Kingdom and Canada demonstrate balanced growth driven by café expansion, plant-based beverages, and increasing supermarket availability.
Consumer behavior surrounding matcha has evolved beyond simple beverage preferences. Modern consumers increasingly associate matcha with wellness, sustainability, premium ingredients, and healthier lifestyles. Younger demographics, particularly Millennials and Generation Z, actively seek beverages that provide both functional benefits and social media appeal. The vibrant green color, distinctive presentation, and customizable flavors have transformed matcha into one of the most photographed café products worldwide.
Businesses collecting Matcha Consumer Trends Data gain valuable insights into regional purchasing behavior, seasonal demand fluctuations, customer sentiment, and repeat purchase patterns. These datasets enable restaurants and beverage manufacturers to identify emerging flavor preferences before they become mainstream, reducing product development risks while improving launch success rates.
Additionally, the growing popularity of dairy-free alternatives has significantly influenced menu design. Oat milk remains the dominant pairing for premium matcha beverages, followed by almond, soy, and coconut milk. Operators that regularly monitor consumer feedback are able to refine recipes and adjust ingredient sourcing to better align with evolving dietary preferences.
Price optimization has become one of the most important competitive strategies in the rapidly expanding matcha beverage market. While consumer demand continues to increase, pricing differs significantly across café chains, independent coffee shops, premium tea boutiques, supermarkets, and food delivery platforms. Factors such as ceremonial-grade powder, country of origin, organic certification, milk alternatives, seasonal ingredients, serving size, and delivery commissions all influence the final retail price. Businesses that continuously monitor pricing movements can identify premium pricing opportunities while maintaining competitiveness within their local markets.
The growing adoption of automated Matcha Food & Beverage Data Scraping allows businesses to capture real-time pricing from thousands of online menus and retail listings. Instead of relying on manual price audits, operators can monitor daily menu changes, promotional discounts, limited-time beverages, combo offers, and regional price differences across multiple competitors. This continuous intelligence supports dynamic pricing strategies and helps reduce the risk of losing customers due to uncompetitive pricing.
Innovation remains the strongest growth engine behind the global expansion of matcha beverages. While the traditional hot matcha latte continues to perform well, cafés increasingly rely on seasonal products to maintain customer engagement throughout the year. Strawberry matcha, mango matcha, vanilla cream matcha, brown sugar matcha, pistachio matcha, lavender matcha, and citrus-infused beverages have become highly successful menu additions across international markets.
Foodservice operators are also expanding matcha beyond beverages into desserts, pastries, breakfast items, frozen treats, and functional snacks. Matcha croissants, cheesecakes, cookies, pancakes, ice creams, protein smoothies, yogurt bowls, and premium chocolates have become important revenue drivers for cafés seeking to maximize ingredient utilization. This product diversification allows businesses to increase profitability while creating stronger brand differentiation in competitive markets.
Growing consumer interest in wellness has accelerated demand for beverages combining matcha with collagen, mushroom extracts, probiotics, vitamins, plant proteins, and botanical ingredients. Functional beverages now represent one of the fastest-growing premium beverage segments, positioning matcha as a versatile ingredient that supports both indulgence and health-focused consumption.
The rapid pace of menu innovation makes competitive benchmarking an essential business activity. Restaurant chains and beverage manufacturers monitor competitor menus to identify successful flavor launches, promotional campaigns, pricing strategies, and regional product performance. Automated data collection enables organizations to compare hundreds of brands simultaneously without requiring manual research.
Continuous Matcha Beverage Market Intelligence supports strategic decision-making by tracking product availability, seasonal launches, menu expansion, customer reviews, promotional frequency, and regional assortment differences. Rather than reacting to market changes after they occur, businesses can proactively identify emerging opportunities and adjust their product portfolios accordingly.
| Product Variant | Average Price (USD) | Monthly Sales Index | YoY Demand Growth | Repeat Purchase Rate | Delivery Orders | Retail Availability | Consumer Rating | Premium Menu Share |
|---|---|---|---|---|---|---|---|---|
| Classic Matcha Latte | 5.95 | 100 | 30% | 58% | 54% | 46% | 4.7 | 18% |
| Iced Matcha Latte | 6.25 | 121 | 37% | 64% | 61% | 39% | 4.8 | 22% |
| Oat Milk Matcha Latte | 6.55 | 132 | 41% | 68% | 60% | 40% | 4.9 | 24% |
| Almond Matcha Latte | 6.35 | 114 | 33% | 61% | 57% | 43% | 4.7 | 15% |
| Coconut Matcha Latte | 6.60 | 108 | 29% | 55% | 53% | 47% | 4.6 | 12% |
| Soy Matcha Latte | 6.20 | 102 | 27% | 53% | 51% | 49% | 4.6 | 10% |
| Strawberry Matcha Latte | 6.95 | 145 | 49% | 70% | 66% | 34% | 4.9 | 19% |
| Mango Matcha Latte | 6.88 | 136 | 45% | 67% | 63% | 37% | 4.8 | 16% |
| Vanilla Cream Matcha | 6.72 | 129 | 39% | 65% | 59% | 41% | 4.8 | 17% |
| Pistachio Matcha Latte | 7.20 | 118 | 44% | 63% | 57% | 43% | 4.8 | 11% |
| Lavender Matcha Latte | 6.85 | 104 | 31% | 57% | 49% | 51% | 4.7 | 9% |
| Brown Sugar Matcha | 6.90 | 123 | 36% | 60% | 58% | 42% | 4.8 | 13% |
| Matcha Smoothie | 7.45 | 117 | 34% | 59% | 56% | 44% | 4.7 | 14% |
| Matcha Frappé | 7.65 | 126 | 38% | 61% | 62% | 38% | 4.8 | 15% |
| Ready-to-Drink Matcha | 4.90 | 152 | 43% | 72% | 34% | 66% | 4.6 | 20% |
Consumer expectations continue to evolve as purchasing decisions become increasingly influenced by digital experiences. Mobile ordering platforms, food delivery applications, café loyalty programs, and social media recommendations now play a significant role in beverage discovery. As a result, brands are investing heavily in data-driven decision-making to understand not only what consumers purchase but also why they choose certain products over others.
Businesses using Matcha Consumer Insights can analyze customer reviews, flavor preferences, purchase frequency, seasonal demand patterns, sentiment scores, and regional consumption trends. These insights enable product development teams to create beverages that better align with changing consumer expectations while reducing the uncertainty associated with new product launches.
The growing overlap between premium coffee and specialty tea categories has also increased the importance of Coffee & Beverage Data Scraping. Monitoring both markets simultaneously provides a broader understanding of consumer substitution patterns, pricing benchmarks, menu innovation, and promotional activity, allowing brands to position matcha products more effectively against competing beverage categories.
The commercial success of matcha latte products in 2026 reflects broader shifts in global beverage consumption. Consumers are increasingly choosing premium beverages that combine health benefits, customization, and distinctive flavor profiles. This transition has encouraged cafés, quick-service restaurants, specialty tea chains, and convenience retailers to allocate more menu space to matcha-based beverages throughout the year rather than limiting them to seasonal offerings.
Continuous monitoring of Sales & Demand Trends enables businesses to understand how product performance changes across weekdays, weekends, holiday periods, weather conditions, and promotional campaigns. Historical sales combined with real-time menu intelligence allows operators to forecast inventory requirements, optimize procurement schedules, and reduce waste associated with short shelf-life ingredients. For multi-location restaurant chains, demand analytics also reveal regional consumption differences, enabling localized menu planning instead of applying a single nationwide strategy.
Food delivery platforms have become another major contributor to category growth. Consumers increasingly purchase iced matcha lattes, flavored beverages, and ready-to-drink products through digital ordering applications, creating additional demand signals that businesses can analyze. Delivery data helps identify high-performing neighborhoods, preferred beverage sizes, average basket values, and customer purchasing frequency. These insights improve marketing effectiveness while supporting expansion into new geographic markets.
Modern food businesses increasingly depend on integrated analytics rather than isolated datasets. Comprehensive Food Intelligence combines menu data, retail pricing, consumer reviews, promotional activity, social media engagement, delivery platform performance, and regional demand indicators into a unified analytical framework. This approach allows decision-makers to evaluate market conditions from multiple perspectives simultaneously.
For example, an increase in social media engagement surrounding strawberry matcha may initially indicate growing consumer interest. When that signal is supported by rising café menu adoption, increasing online search activity, stronger delivery orders, and higher supermarket sales, businesses gain greater confidence in launching similar products. Such integrated intelligence reduces product development risks while improving return on investment for new beverage introductions.
The rapid evolution of the matcha latte category demonstrates how consumer preferences, premium positioning, and digital commerce are reshaping the global beverage industry.
Solutions powered by Food Delivery Scraping API enable companies to monitor menu availability, delivery pricing, restaurant promotions, and regional assortment changes across major food ordering platforms in real time. When combined with an interactive Food Price Dashboard, businesses can benchmark competitor pricing, evaluate promotional effectiveness, and identify profitable pricing opportunities across thousands of locations. Access to comprehensive Food Datasets further supports predictive analytics, demand forecasting, assortment optimization, and long-term strategic planning, helping foodservice brands, retailers, and manufacturers capitalize on the growing global demand for premium matcha beverages in 2026 and beyond.
If you are seeking for a reliable data scraping services, Food Data Scrape is at your service. We hold prominence in Food Data Aggregator and Mobile Restaurant App Scraping with impeccable data analysis for strategic decision-making.



