
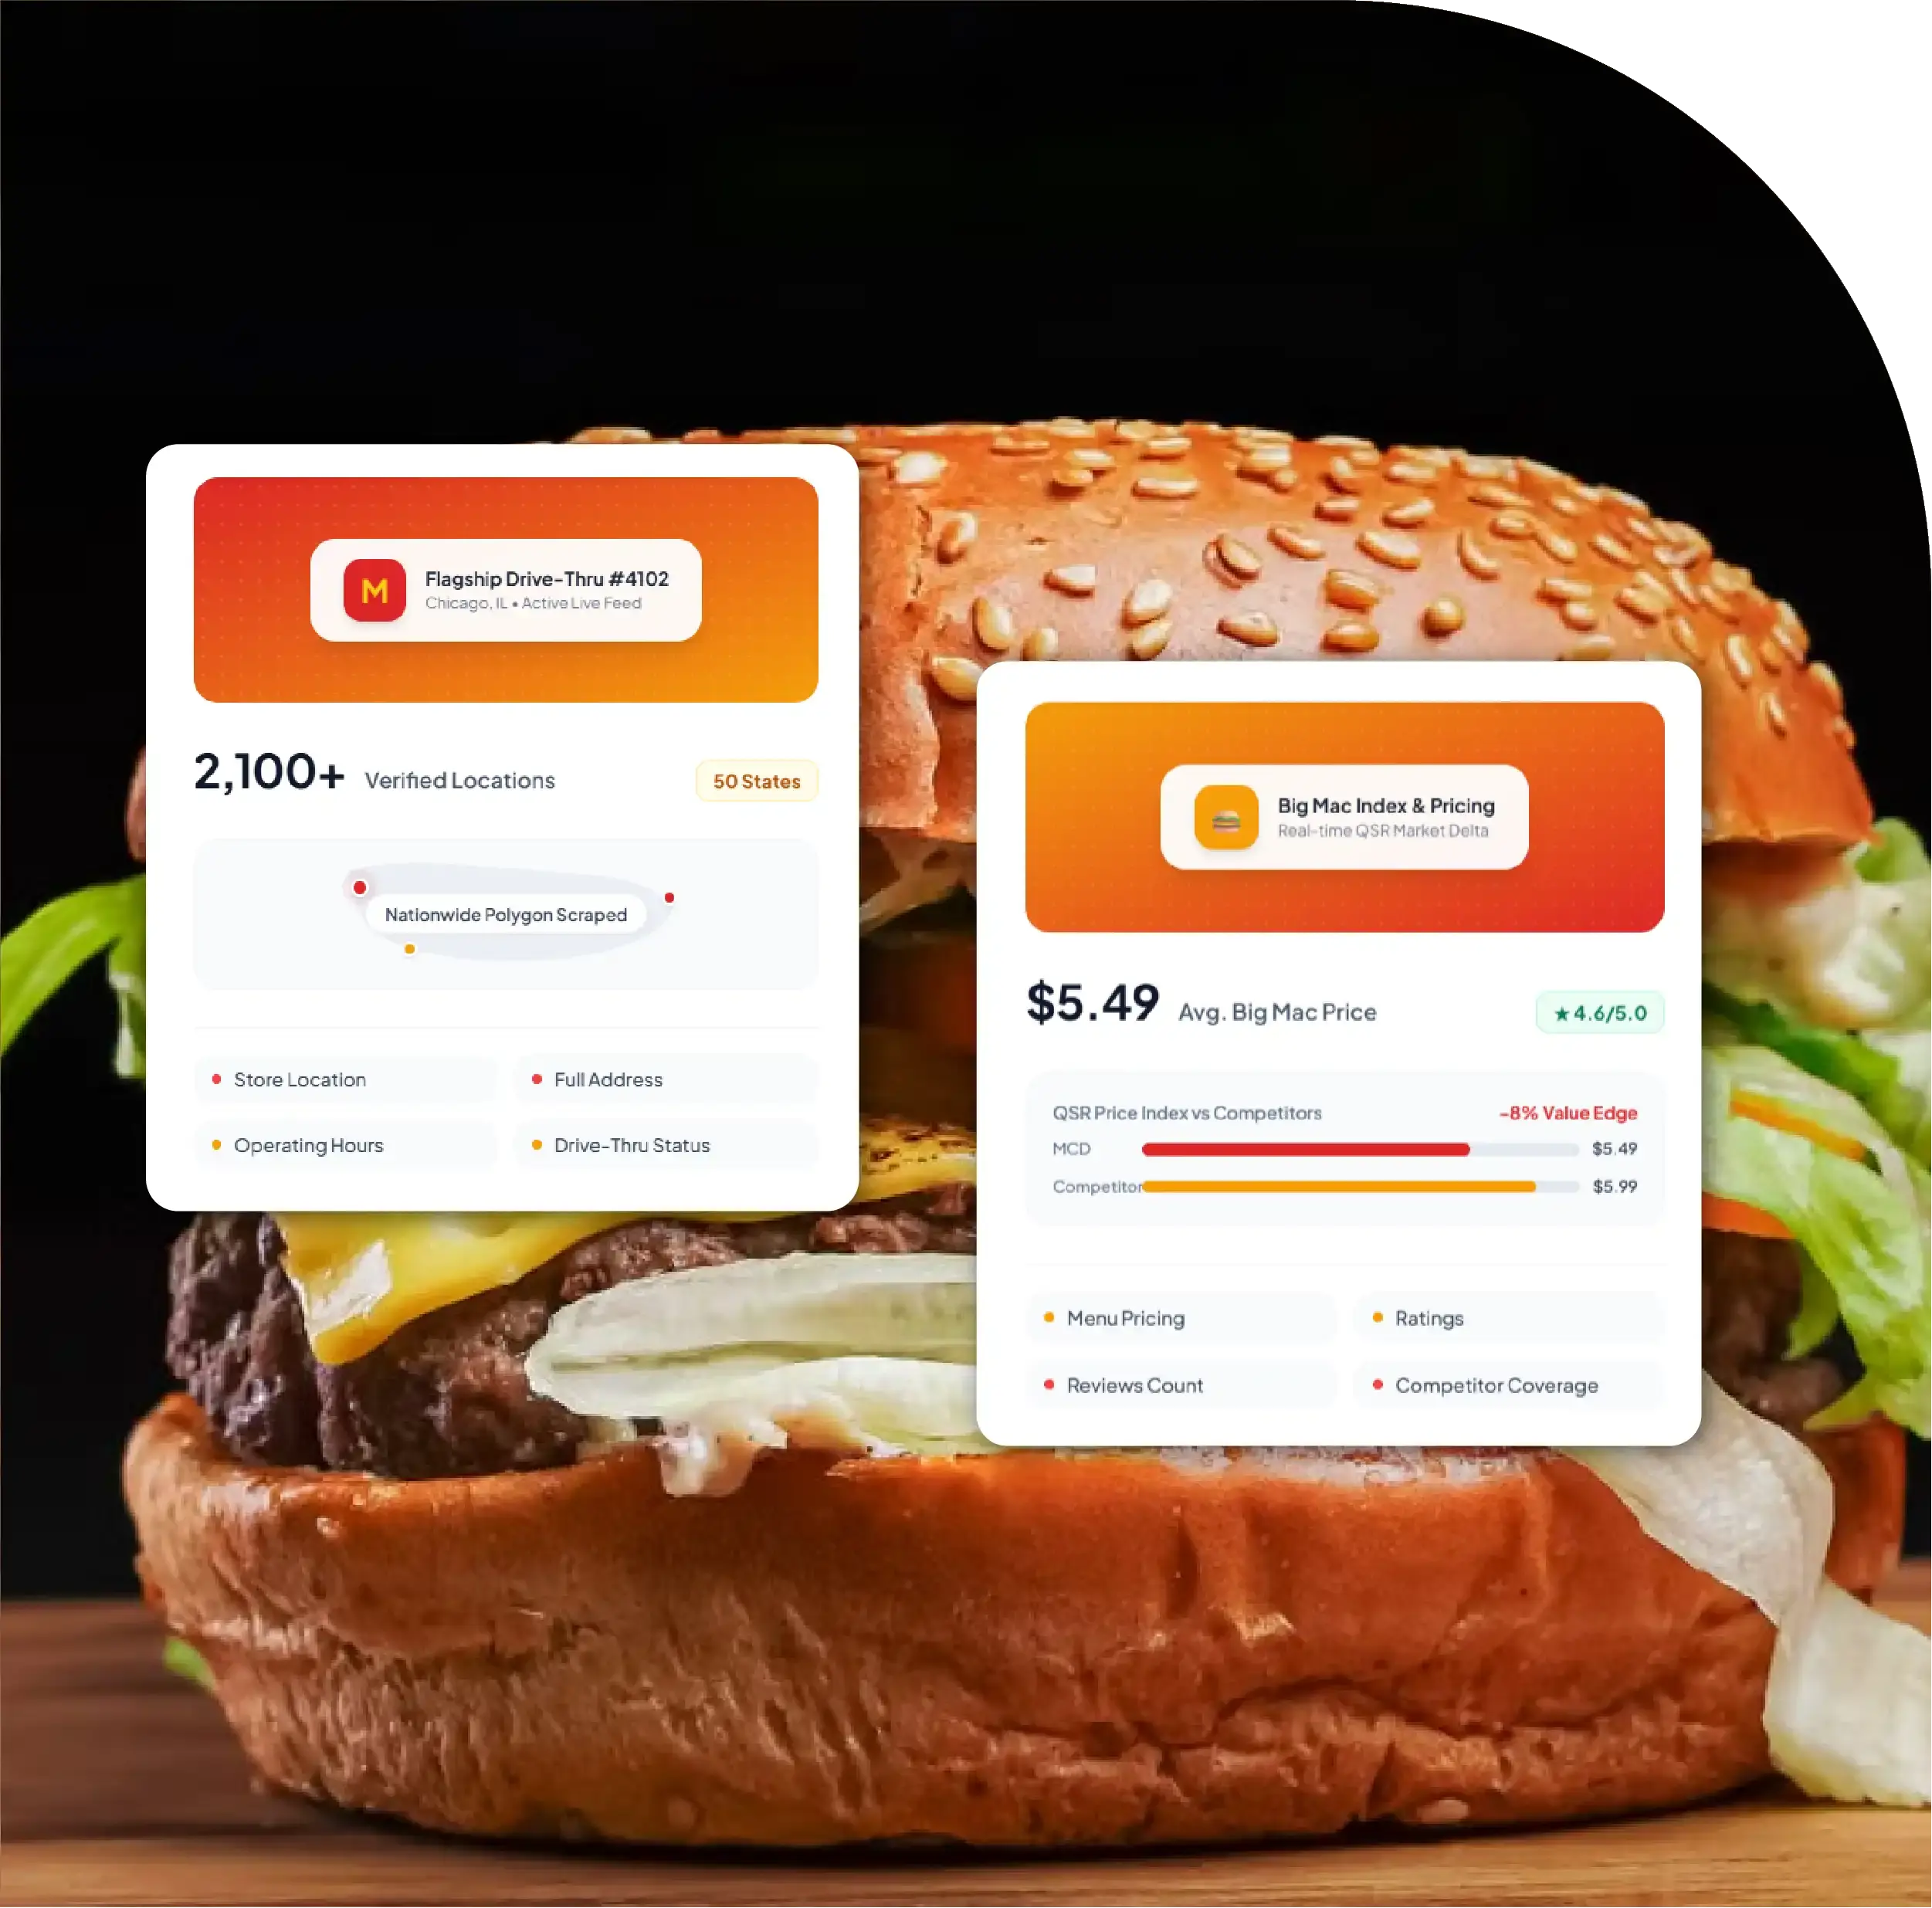
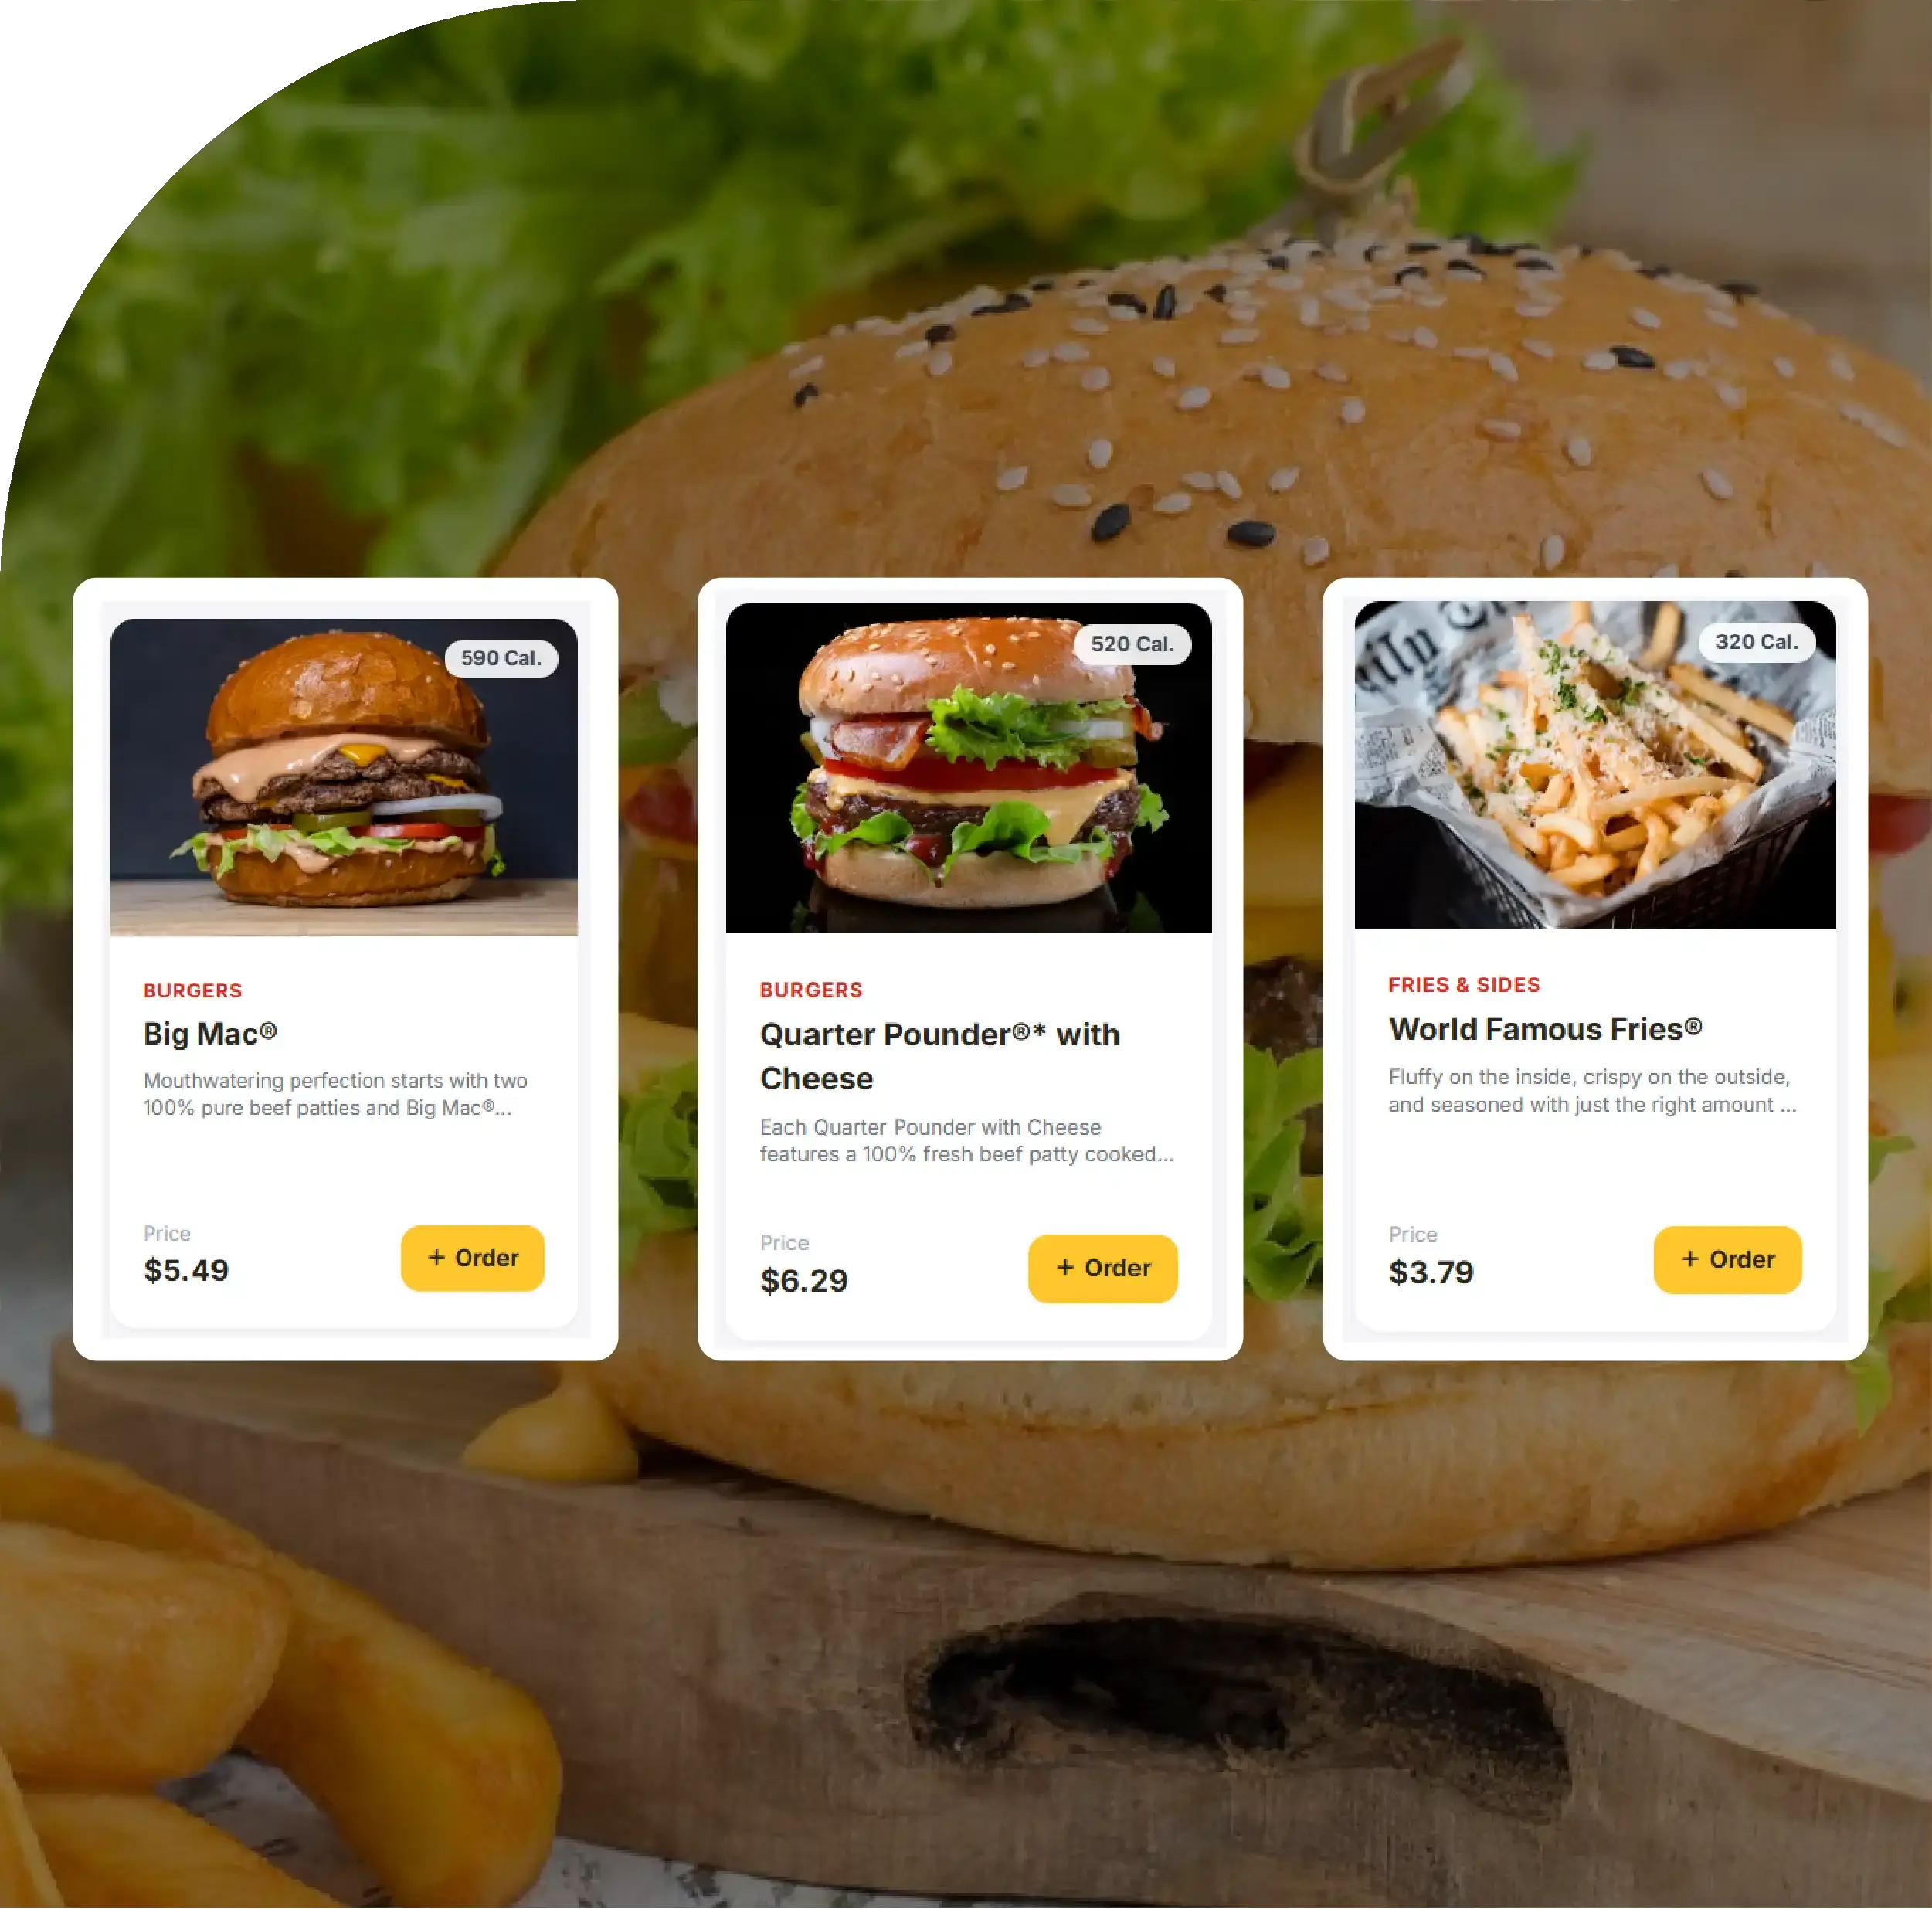
Restaurant Network: 13,882 McDonald's restaurants identified across the United States.
Leading State: Texas leads with 1,275 McDonald's restaurant locations.
Geographic Coverage: Dataset covers 5,041 cities across 54 territories.
Customer Ratings: Average customer rating reaches 3.46 across locations.
Data Attributes: Records include addresses, coordinates, phones, ZIP codes.

The U.S. quick-service restaurant market is highly competitive, making location-level intelligence essential for understanding brand scale, geographic concentration, customer sentiment, and market opportunities. Scrape McDonald's US Restaurant Data to build structured datasets covering restaurant addresses, cities, states, ZIP codes, phone numbers, coordinates, ratings, operating information, and other location attributes.
As of July 27, 2026, McDonald's has 13,882 restaurants across the United States, spanning 54 states and territories and 5,041 cities. Texas leads with 1,275 restaurants, followed by California with 1,237 and Florida with 908. This distribution provides a valuable foundation for evaluating restaurant density, market penetration, regional expansion, and competitive positioning.
McDonald's Restaurant Count Data Scraping USA 2026 can transform these location records into continuously updated datasets for restaurant chains, market researchers, franchise operators, real-estate analysts, delivery platforms, and investment teams.
McDonald's Locations Data Scraping In USA further supports geographic analysis by combining standardized addresses with latitude and longitude coordinates, allowing organizations to map restaurant networks and compare locations across markets.
McDonald's maintains one of the largest restaurant footprints among major food-service brands in the United States. The 13,882-location network demonstrates the scale at which restaurant location data can support business intelligence.
Texas accounts for approximately 9% of all U.S. McDonald's restaurants, with 1,275 locations. California follows closely with 1,237 locations, while Florida has 908. Together, these three states contain more than 3,400 restaurants, making them particularly important for regional benchmarking.
Population-adjusted restaurant density provides another perspective. Illinois has one McDonald's restaurant for approximately every 19,800 residents, while Ohio has approximately one for every 18,900 residents. Such measures can help identify markets where restaurant availability is relatively high or low compared with population.
Extract McDonald's Restaurants Data from structured location sources to support more than a simple store count. Businesses can analyze geographic clusters, identify underserved areas, evaluate competitive saturation, and monitor changes in restaurant networks.
The following dataset illustrates the leading U.S. markets by restaurant count.
| Rank | State / Territory | McDonald's Restaurants | Share of U.S. Network | Population | Population per Restaurant | Market Observation |
|---|---|---|---|---|---|---|
| 1 | Texas | 1,275 | 9% | 29.00M | 22.74K | Largest restaurant network |
| 2 | California | 1,237 | 9% | 39.51M | 31.94K | High absolute presence |
| 3 | Florida | 908 | 7% | 21.48M | 23.65K | Strong restaurant density |
| 4 | Illinois | 640 | 5% | 12.67M | 19.80K | High population coverage |
| 5 | Ohio | 619 | 4% | 11.69M | 18.88K | Strong density |
| 6 | New York | 574 | 4% | 19.45M | 33.89K | Large population market |
| 7 | Michigan | 524 | 4% | 9.99M | 19.06K | High location density |
| 8 | North Carolina | 482 | 3% | 10.49M | 21.76K | Expanding regional market |
| 9 | Pennsylvania | 475 | 3% | 12.80M | 26.95K | Broad geographic coverage |
| 10 | Georgia | 451 | 3% | 10.62M | 23.54K | Strong Southeast presence |
The geographic spread also highlights why McDonald's Location Data Intelligence can be valuable to companies assessing restaurant networks. A statewide restaurant count alone does not reveal whether locations are concentrated in major metropolitan areas or distributed throughout smaller communities.
Restaurant data becomes even more actionable when analyzed at the city level. Houston leads the U.S. cities with 129 McDonald's restaurants, followed by Chicago with 101 and San Antonio with 87.
Las Vegas has 74 restaurants, while Los Angeles has 67. Dallas, Phoenix, Orlando, Miami, and Indianapolis also rank among the cities with the largest McDonald's footprints.
City-level datasets can help organizations evaluate local competition, delivery coverage, restaurant density, customer accessibility, and potential expansion opportunities.
For example, a delivery company could use restaurant coordinates to estimate serviceable zones, while a commercial real-estate company could analyze the relationship between restaurant locations and population centers.
A comprehensive restaurant dataset can contain multiple attributes for each McDonald's location. Typical fields include:
US Restaurant Chain Data Scraping can extend this methodology beyond McDonald's. Organizations can create comparable datasets for Subway, Starbucks, Hunt Brothers Pizza, Dunkin', Taco Bell, and other major restaurant brands.
This makes cross-brand benchmarking possible without relying solely on high-level corporate announcements.
McDonald's had 13,882 U.S. restaurants in the referenced July 2026 dataset. Subway had 20,122 locations, Starbucks had 16,909, Hunt Brothers Pizza had 11,541, Dunkin' had 10,135, and Taco Bell had 8,248.
These figures show that restaurant network size varies considerably across brands. However, location count alone does not determine competitive strength. Businesses can combine restaurant counts with city coverage, state penetration, ratings, review volumes, menu information, pricing, and delivery availability.
Food Data Scraping in the USA can support this broader competitive intelligence framework by creating standardized datasets across multiple restaurant chains and markets.
Location-level reviews provide another dimension of restaurant intelligence. The referenced McDonald's dataset reports an average rating of 3.46 based on approximately 16.06 million customer reviews.
The reported customer satisfaction rate is 55.53%, while poor customer feedback accounts for 26.61%. These indicators can help analysts understand differences between restaurant locations rather than evaluating McDonald's solely at the national level.
The highest-rated examples in the referenced dataset include restaurants in Calexico, Orlando, Downey, San Diego, and Nogales, with ratings ranging from 4.0 to 4.2.
Lower-rated locations include restaurants in Saint Clair Shores, Euclid, Elkhart, Newnan, and Middlebury, with ratings between 2.3 and 2.6.
For businesses conducting location intelligence, these differences can identify markets requiring additional operational investigation.
The following sample demonstrates how restaurant-level records can be structured for analysis.
| Restaurant | City | State | ZIP Code | Phone | Latitude | Longitude | Address | Last Updated |
|---|---|---|---|---|---|---|---|---|
| McDonalds Breaux Bridge | Breaux Bridge | LA | 70517 | 337-332-0026 | 30.313165 | -91.831988 | 2999 Grand Point Hwy | 2026-07-27 |
| McDonalds Hummelstown | Hummelstown | PA | 17036 | 717-566-6041 | 40.267760 | -76.689691 | 611 E Main St | 2026-07-27 |
| McDonalds Spartanburg | Spartanburg | SC | 29301 | 864-576-0320 | 34.923908 | -81.976805 | 1598 John B White Sr Blvd | 2026-07-27 |
| McDonalds Newport | Newport | TN | 37821 | 423-623-3003 | 35.951206 | -83.201046 | 817 Cosby Rd | 2026-07-27 |
| McDonalds Wasilla | Wasilla | AK | 99654 | 907-376-4642 | 61.581584 | -149.430913 | 801 E Parks Hwy | 2026-07-27 |
| McDonalds Homer | Homer | AK | 99603 | 907-235-5400 | 59.642583 | -151.522907 | 3656 Ben Walters Ln | 2026-07-27 |
| McDonalds Shorter | Shorter | AL | 36075 | 334-724-0180 | 32.404224 | -85.956367 | 431 N Main Street | 2026-07-27 |
| McDonalds Mccalla | Mccalla | AL | 35111 | 205-477-1003 | 33.329767 | -87.000144 | 4746 Eastern Valley Rd | 2026-07-27 |
| McDonalds Mobile | Mobile | AL | 36608 | 251-633-7766 | 30.684221 | -88.225049 | 281 Schillinger Rd | 2026-07-27 |
| McDonalds Panama City | Panama City | FL | 32405 | 850-215-3442 | 30.187381 | -85.650393 | 2263 Martin Luther King Jr Blvd | 2026-07-27 |
The combination of geographic coordinates and standardized addresses makes these records suitable for mapping, territory analysis, proximity calculations, and location-based modeling.
Restaurant location data becomes significantly more valuable when connected with digital ordering information. Mcdonalds Food Delivery App Data Scraping can help businesses study how restaurant availability, menu offerings, delivery fees, estimated delivery times, promotions, and product prices differ across markets.
Delivery datasets can also reveal which restaurants are available within specific ZIP codes or delivery zones. This can support competitor monitoring, food delivery market analysis, and local pricing intelligence.
Mcdonalds Food Delivery Scraping API solutions can provide structured access to refreshed restaurant and ordering information for applications that require frequent updates. API-based delivery data can be integrated into dashboards, analytical systems, pricing engines, and market-monitoring workflows.
A structured McDonald's dataset can support several use cases:
Restaurant networks change continuously. New locations open, existing restaurants close or relocate, operating hours change, menus evolve, and digital ordering information can vary by market.
Manual collection is therefore difficult to maintain at scale. Automated extraction allows datasets to be refreshed according to business requirements and standardized for downstream analysis.
Data quality is equally important. Duplicate records, inconsistent addresses, missing coordinates, and outdated restaurant information can distort market calculations. A structured workflow should therefore include validation, normalization, deduplication, and geographic verification.
McDonald's extensive U.S. restaurant network provides a valuable foundation for location intelligence, competitive research, geographic analysis, and digital food-market monitoring. With 13,882 restaurants across 54 states and territories and 5,041 cities in the referenced July 2026 dataset, the brand offers a substantial dataset for evaluating restaurant distribution and market penetration.
Combining restaurant locations with delivery availability, menu information, pricing, ratings, reviews, and competitor datasets can create a much deeper view of the U.S. restaurant ecosystem. Restaurant Menu Data Scraping can extend location intelligence into product-level analysis, while AI Restaurant Intelligence can turn large restaurant datasets into automated insights, forecasts, and market recommendations. Organizations can further combine these capabilities with structured Food Datasets to build scalable restaurant intelligence systems for research, strategy, and competitive benchmarking.
If you are seeking for a reliable data scraping services, Food Data Scrape is at your service. We hold prominence in AI Restaurant Intelligence and Mobile Restaurant App Scraping with impeccable data analysis for strategic decision-making. Unlock richer grocery intelligence with flavor trends and ingredient insights to understand consumer preferences, product innovation, and emerging market opportunities.