
The Client
The client was a consumer intelligence and FMCG analytics company supporting brands, retailers, and distributors with digital-market insights. Its teams needed granular visibility into quick-commerce inventory but lacked a standardized system for continuously monitoring product availability across thousands of Indian pincodes.
The client wanted to strengthen its Pincode-Level Stock Data Monitoring capabilities and understand how inventory differed between major quick-commerce platforms. It also required Real-Time FMCG Stock Availability Data to identify stockouts, regional assortment differences, and emerging availability trends.
Another priority was developing Quick Commerce Inventory Intelligence Data that could be integrated into internal analytics workflows. Rather than relying on occasional manual checks, the client required structured, scalable, and consistently refreshed information covering Zepto, Blinkit, and Swiggy Instamart across multiple locations.
Key Challenges
-
Pincode-Level Platform Variations
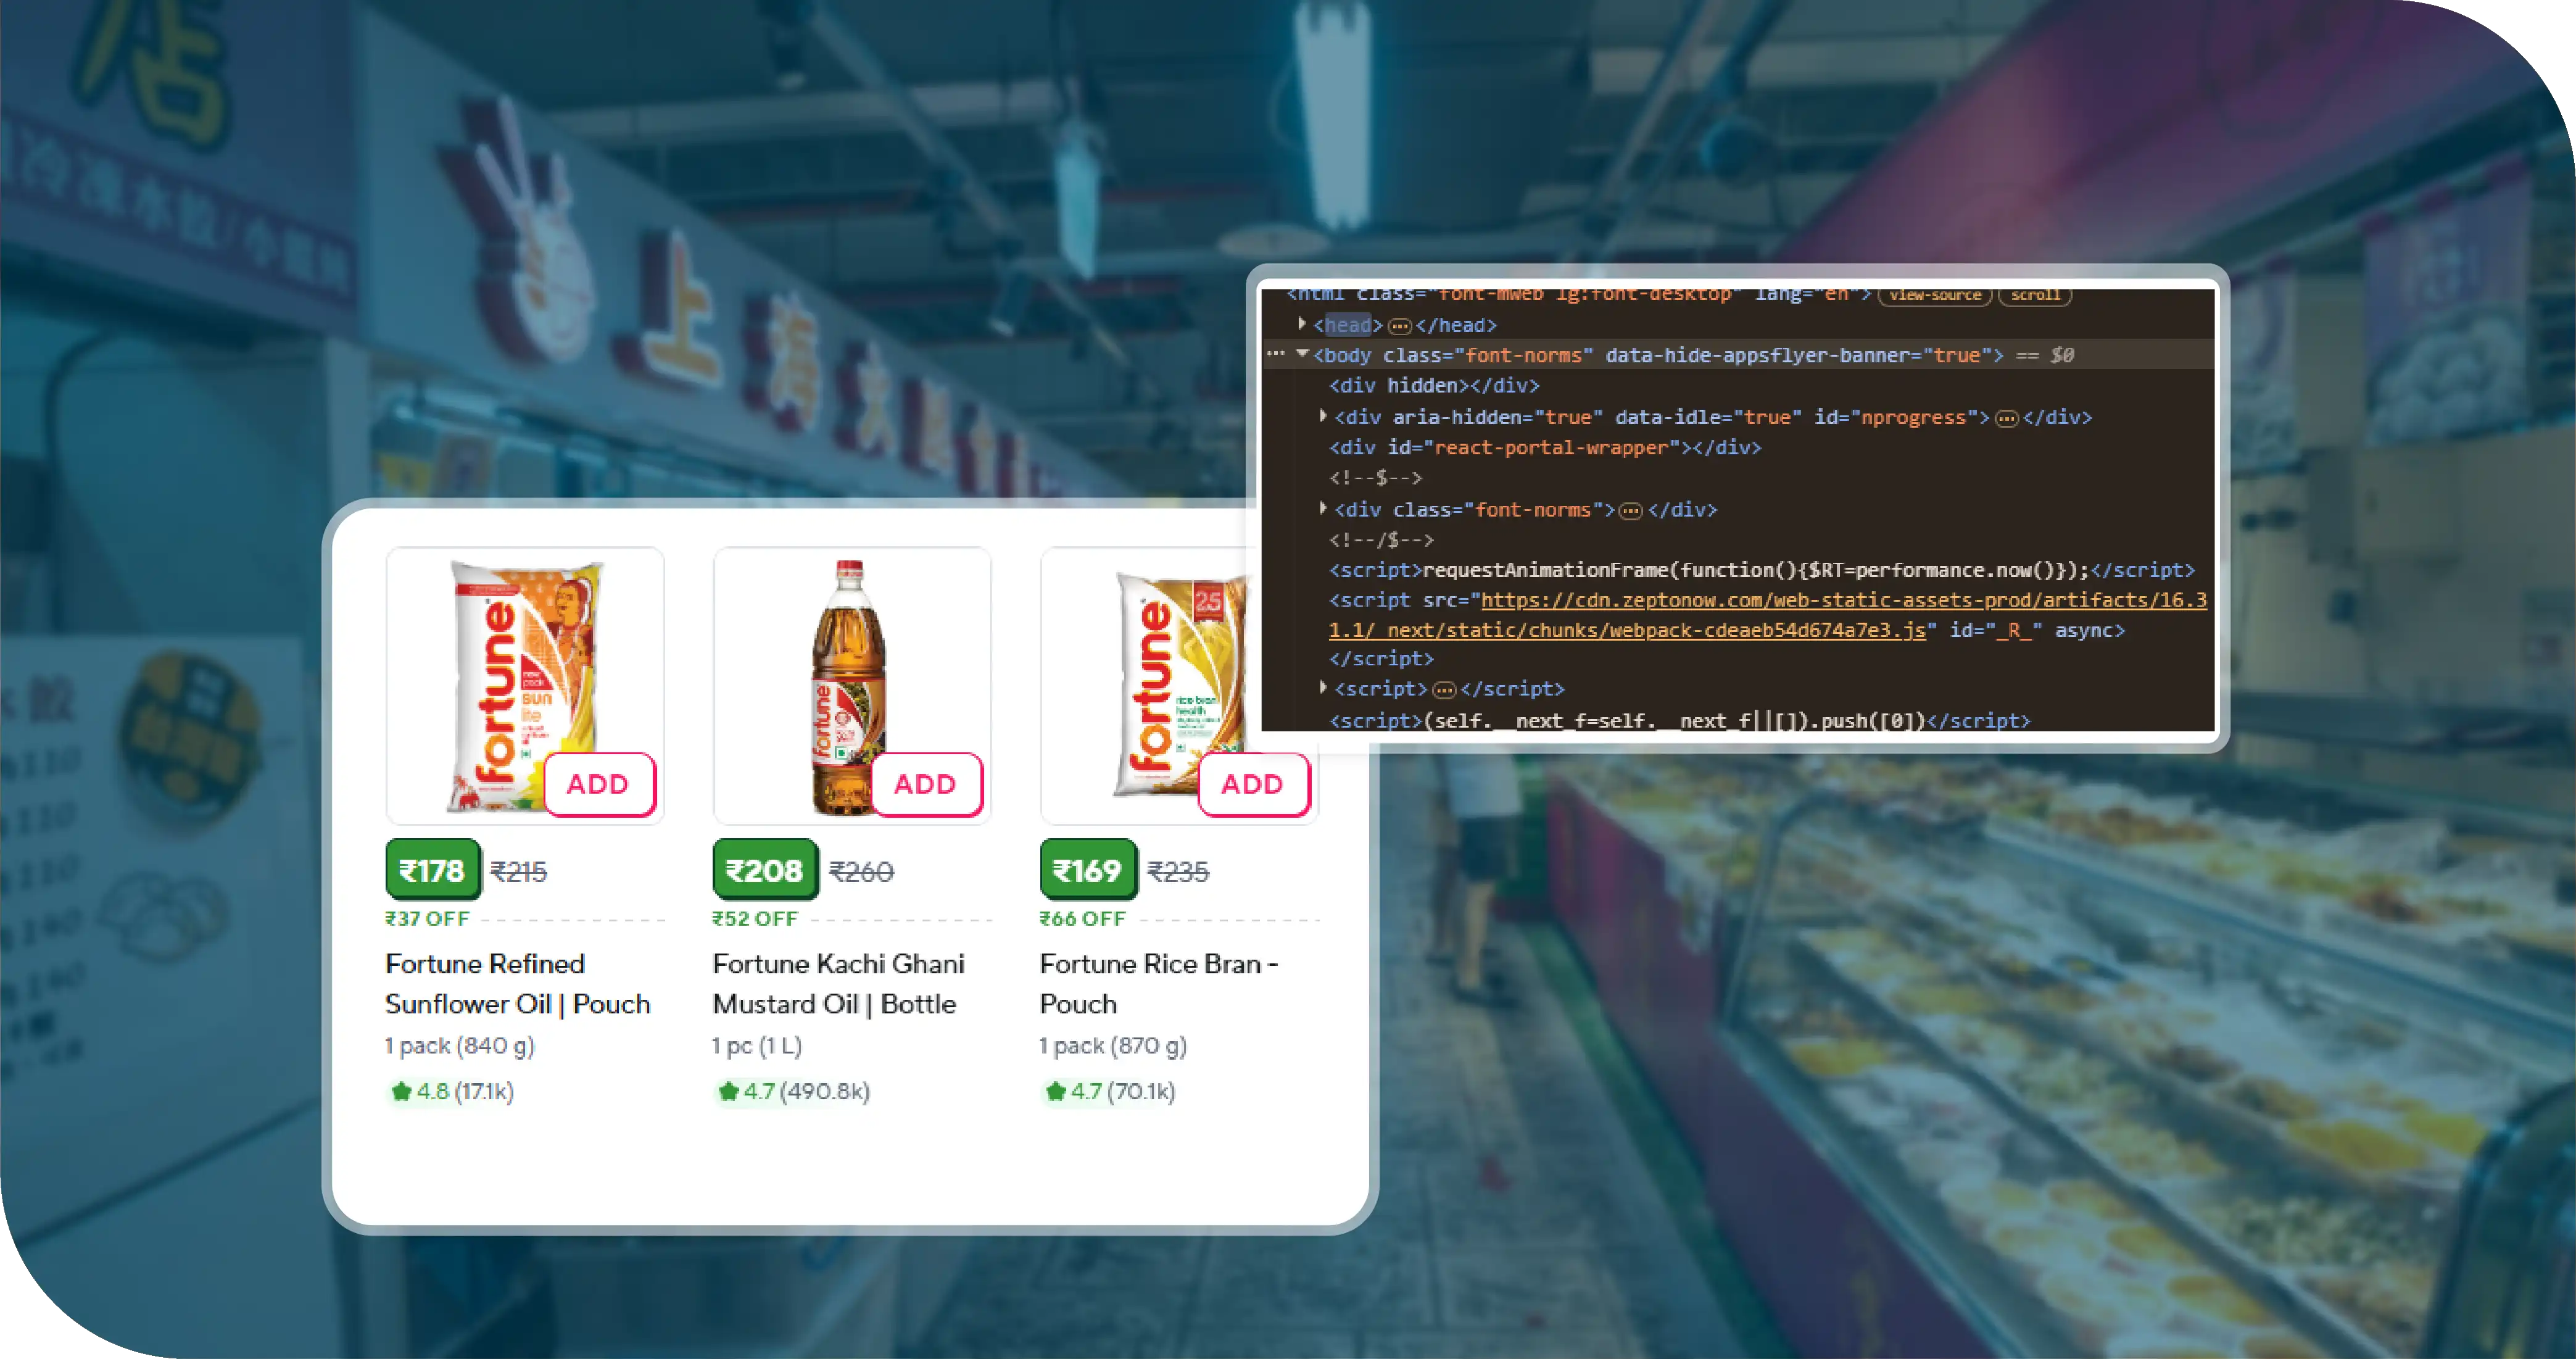
Each platform could display different products, prices, pack sizes, and availability conditions depending on the selected location. Integrating these variations into one consistent dataset required robust location mapping and standardized fields across thousands of records. -
Dynamic Inventory Information
Quick-commerce inventory changes rapidly throughout the day. Using a Zepto Grocery Delivery Scraping API required handling dynamic pages and changing availability signals while ensuring the collected records accurately represented the inventory visible for each targeted pincode. -
Multi-Platform Data Collection
The project required us to Scrape Online Blinkit Grocery Data and Scrape Online Swiggy Instamart Grocery Delivery App Data alongside Zepto information. Different website structures, product identifiers, and availability representations made cross-platform normalization essential.
Key Solutions
-
Automated Pincode-Level Extraction
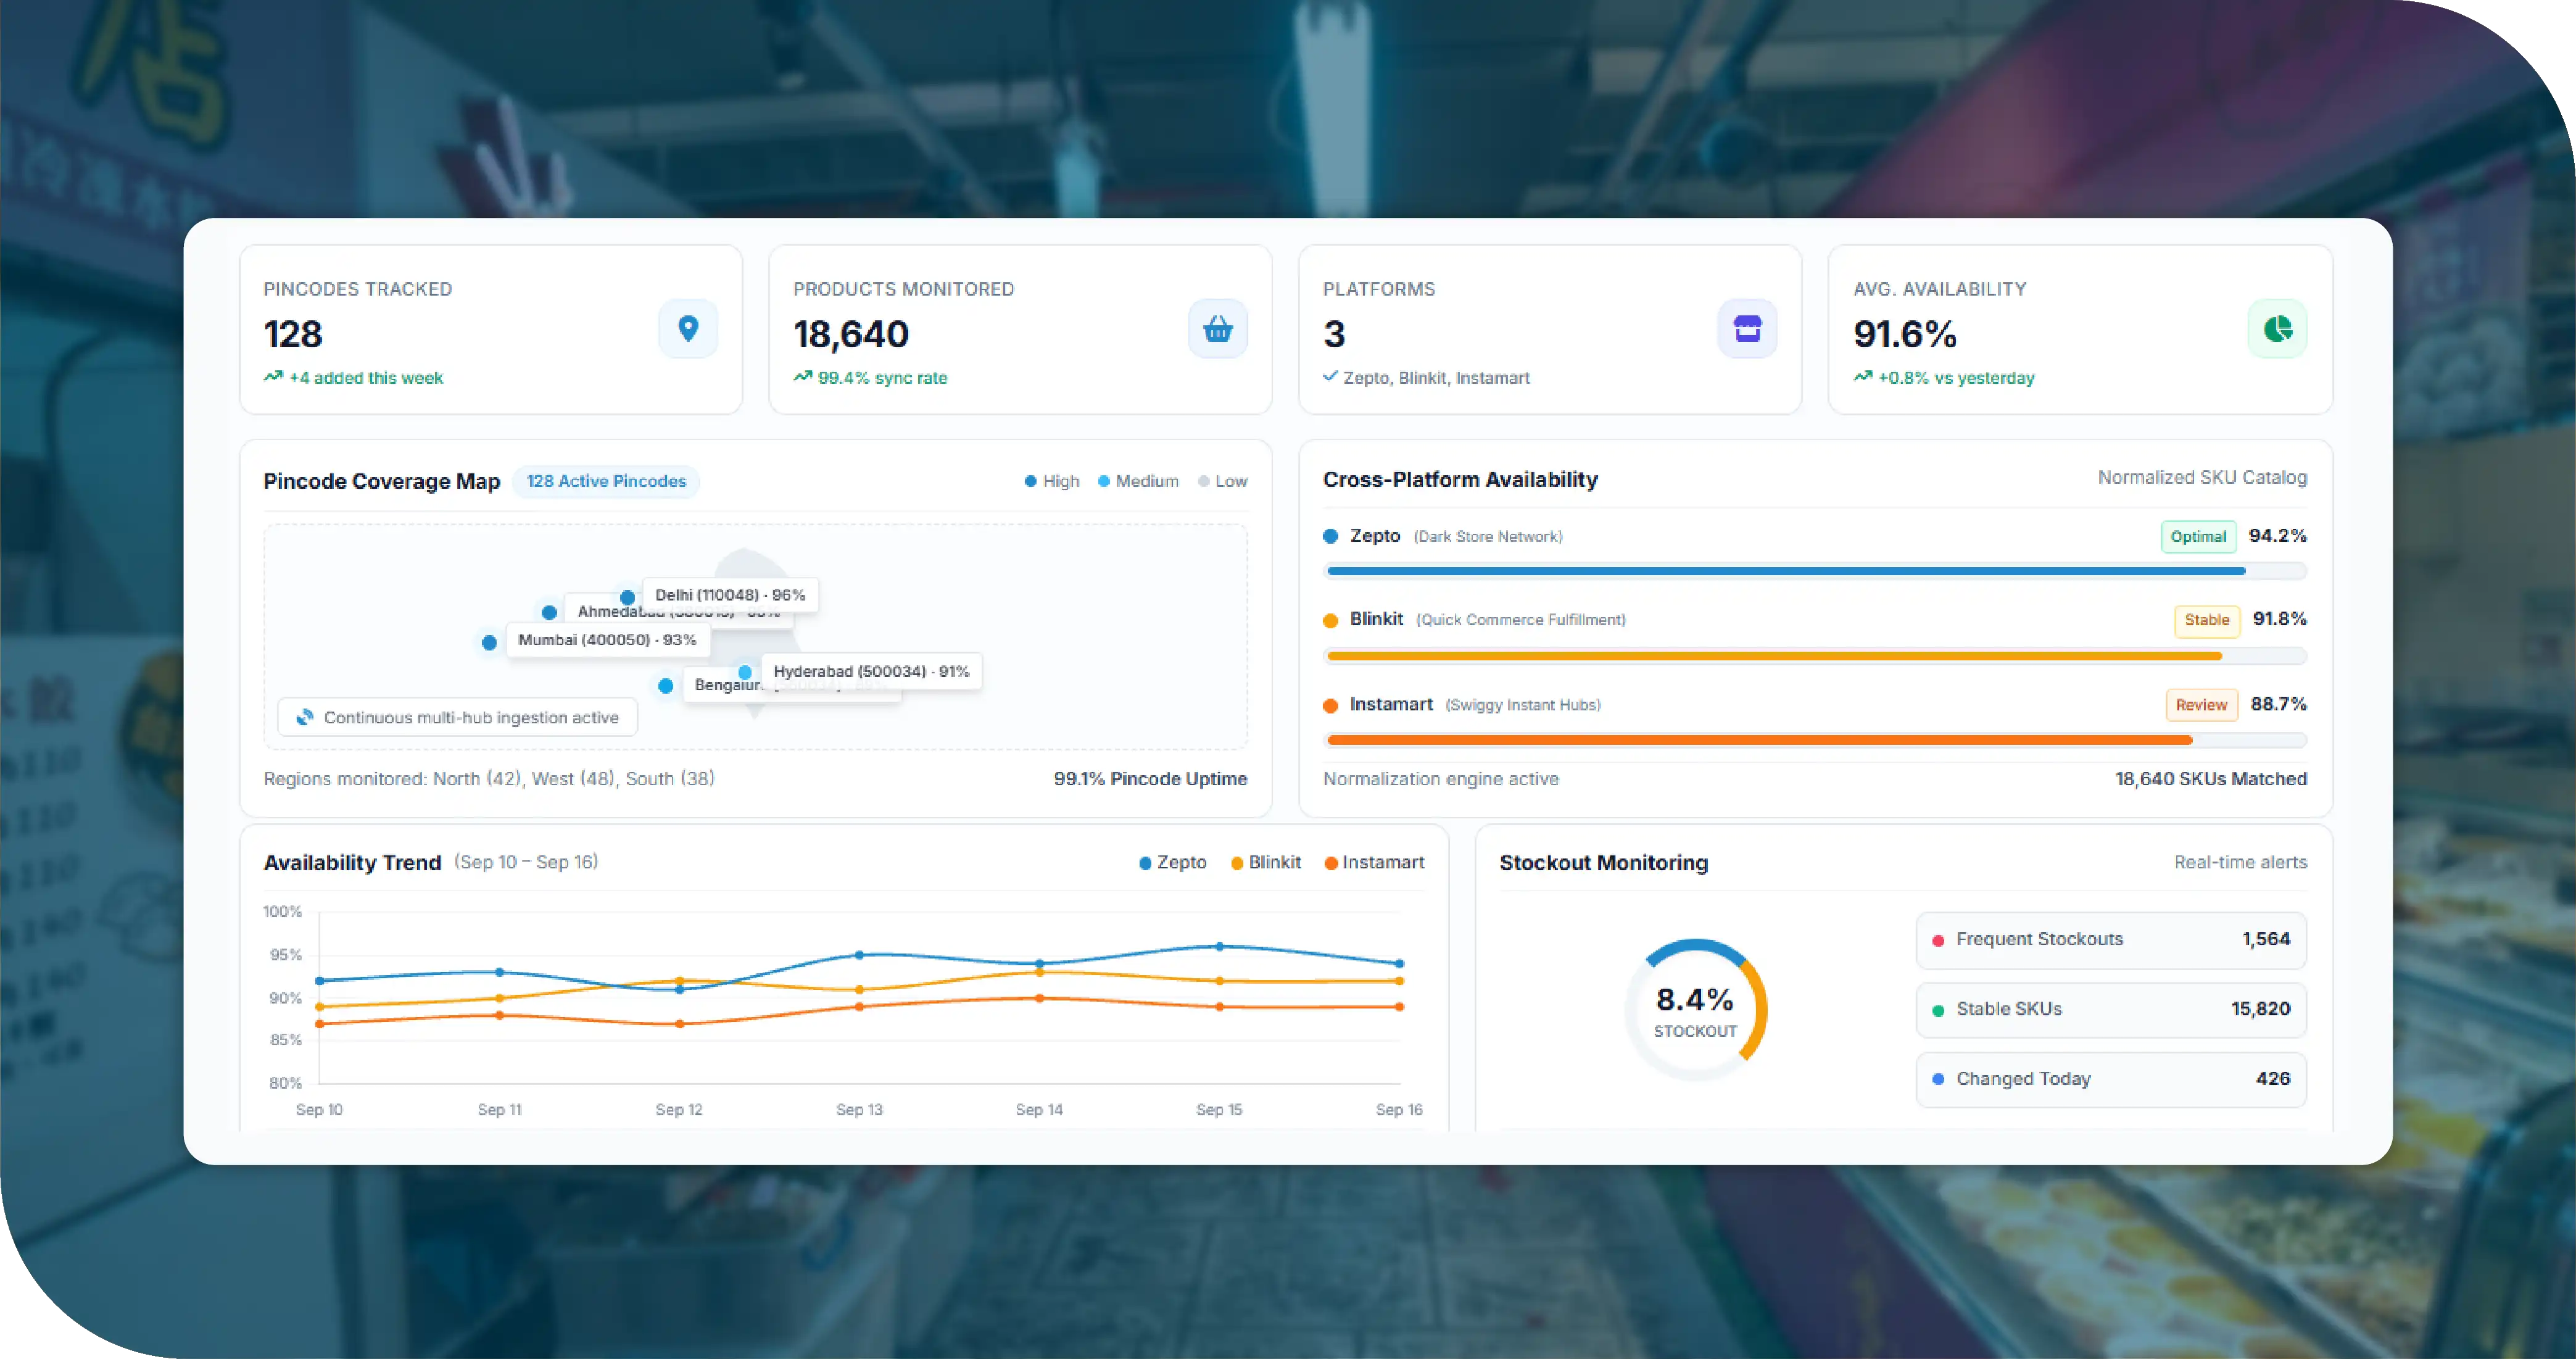
We developed an automated collection workflow capable of processing multiple pincodes and product categories. The system captured product attributes, availability status, pricing, pack information, brand details, and platform identifiers in a standardized structure for downstream analysis. -
Cross-Platform Data Normalization
We created a unified schema across Zepto, Blinkit, and Instamart. Similar products were mapped using standardized attributes, while platform-specific fields were retained separately. This enabled meaningful comparison without losing important marketplace-specific information. -
Continuous Availability Monitoring
We implemented scheduled data collection to identify changes in inventory conditions. Historical snapshots allowed the client to measure stockout frequency, availability percentages, platform differences, and pincode-level inventory movements over time.
Data Collection Performance
| Metric | Zepto | Blinkit | Instamart | Total |
|---|---|---|---|---|
| Pincodes Monitored | 1,850 | 1,850 | 1,850 | 5,550 |
| Product SKUs Tracked | 42,500 | 39,800 | 41,200 | 123,500 |
| Categories Covered | 28 | 28 | 28 | 28 |
| Daily Records Collected | 210,000 | 198,000 | 205,000 | 613,000 |
| Monthly Records | 6.3M | 5.94M | 6.15M | 18.39M |
| Average Availability Rate | 82.4% | 79.8% | 81.6% | 81.3% |
| Average Stockout Rate | 17.6% | 20.2% | 18.4% | 18.7% |
| Data Completeness | 97.8% | 97.1% | 97.5% | 97.5% |
| Refresh Frequency | 6 hrs | 6 hrs | 6 hrs | 6 hrs |
| Data Fields Captured | 18 | 18 | 18 | 18 |
The figures above are illustrative case-study metrics representing a typical large-scale implementation.
Methodologies Used
-
Pincode Segmentation
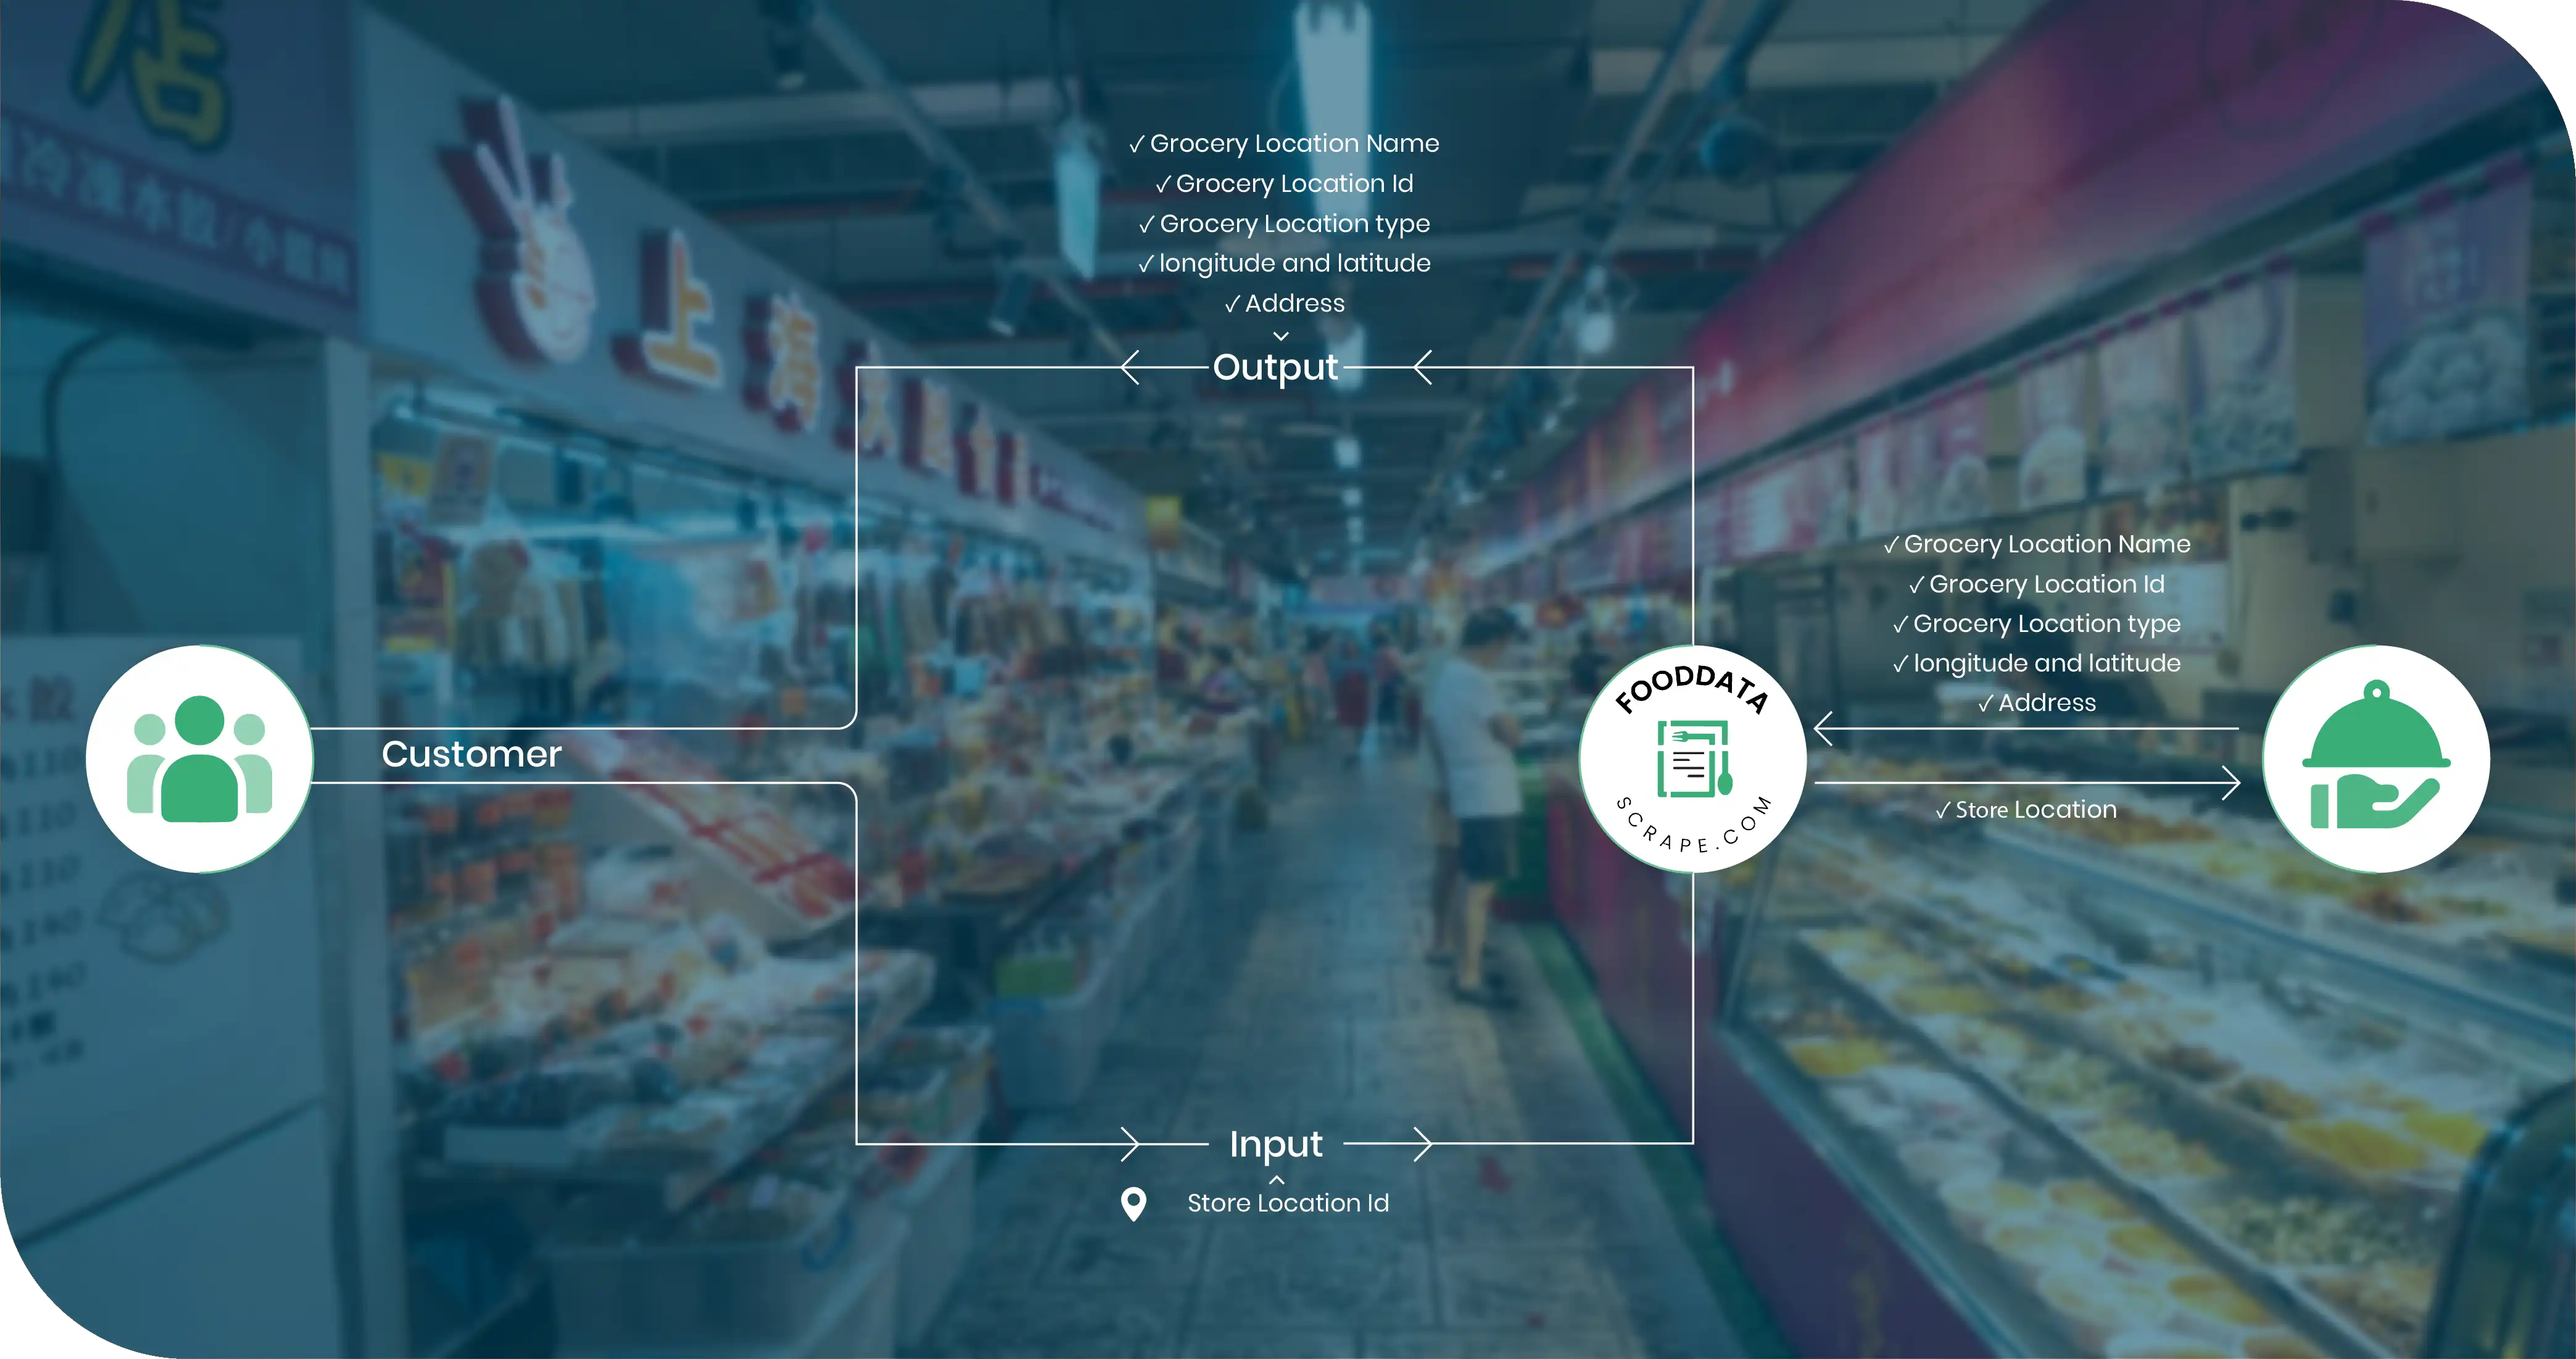
We divided target locations into structured pincode groups based on geography, market importance, and client requirements. This enabled systematic coverage and reduced duplication while ensuring that high-priority urban and emerging markets received appropriate monitoring frequency. -
Product Discovery and Mapping
Products were identified across categories, brands, pack sizes, and marketplace listings. We established standardized identifiers to connect comparable products across platforms, allowing the client to distinguish genuine assortment differences from naming or packaging variations. -
Automated Data Extraction
Automated extraction workflows collected product information at predefined intervals. The methodology captured availability status, product names, prices, quantities, categories, brands, URLs, and location-specific attributes while minimizing manual intervention during large-scale collection. -
Data Cleaning and Validation
Collected records passed through validation routines to identify duplicates, incomplete fields, inconsistent product names, incorrect mappings, and anomalous values. Standardization improved dataset reliability and made the final output suitable for analytics and business intelligence applications. -
Historical Trend Analysis
Multiple snapshots were retained to create historical inventory records. Comparing these snapshots helped identify recurring stockouts, availability changes, platform-level differences, and geographic patterns that could not be observed through one-time data collection.
Advantages of Collecting Data Using Food Data Scrape
-
Better Inventory Visibility
Our scraping services provided structured visibility into product availability across multiple pincodes and platforms. Businesses could identify where products were consistently available, frequently unavailable, or experiencing changing inventory conditions. -
Faster Competitive Monitoring
Automated collection reduced dependence on manual marketplace checks. Teams could receive refreshed datasets at predefined intervals and quickly identify competitor assortment changes, stockouts, pricing movements, and location-specific marketplace differences. -
Improved Distribution Planning
Location-level availability information helped businesses understand potential distribution gaps. Brands could identify markets where demand might exist but product availability remained inconsistent, supporting more informed replenishment and distribution decisions. -
Scalable Data Collection
The methodology could expand across additional pincodes, categories, brands, and platforms without proportionally increasing manual workload. This made the solution suitable for businesses requiring continuous quick-commerce intelligence at scale. -
Actionable Business Intelligence
Instead of receiving disconnected marketplace listings, the client received structured datasets suitable for dashboards, analytics, reporting, and historical comparisons. This converted raw grocery marketplace information into practical intelligence for commercial decision-making.
Client's Testimonial
"The project significantly improved our ability to understand FMCG availability across India's quick-commerce platforms. Previously, our teams depended heavily on manual checks, which made it difficult to compare thousands of pincodes consistently. The structured datasets gave us a much clearer view of stock availability, assortment differences, and recurring stockout patterns. We particularly valued the standardized format because our analysts could directly integrate the information into our existing reporting workflows. The refresh frequency also helped us move from static marketplace observations toward continuous monitoring. Overall, the solution reduced operational effort while giving our commercial teams stronger evidence for distribution and assortment decisions."
—Head of Data & Market Intelligence, FMCG Analytics Company
Final Outcome
The project transformed fragmented quick-commerce marketplace information into a scalable inventory intelligence system. By monitoring 5,550 pincode-platform combinations and more than 123,500 SKUs, the client gained significantly broader visibility into FMCG availability patterns.
The structured dataset enabled teams to compare availability rates, identify recurring stockouts, analyze regional assortment differences, and monitor changes across Zepto, Blinkit, and Instamart. Historical snapshots also created a foundation for trend analysis and performance benchmarking.
The implementation supported faster reporting and reduced reliance on repetitive manual marketplace checks. The data could subsequently be connected to a Q commerce dashboard, allowing business users to visualize inventory movements, compare platforms, filter locations, and identify priority markets.
As a result, the client gained a repeatable framework for monitoring quick-commerce inventory and converting marketplace data into actionable commercial intelligence.



