

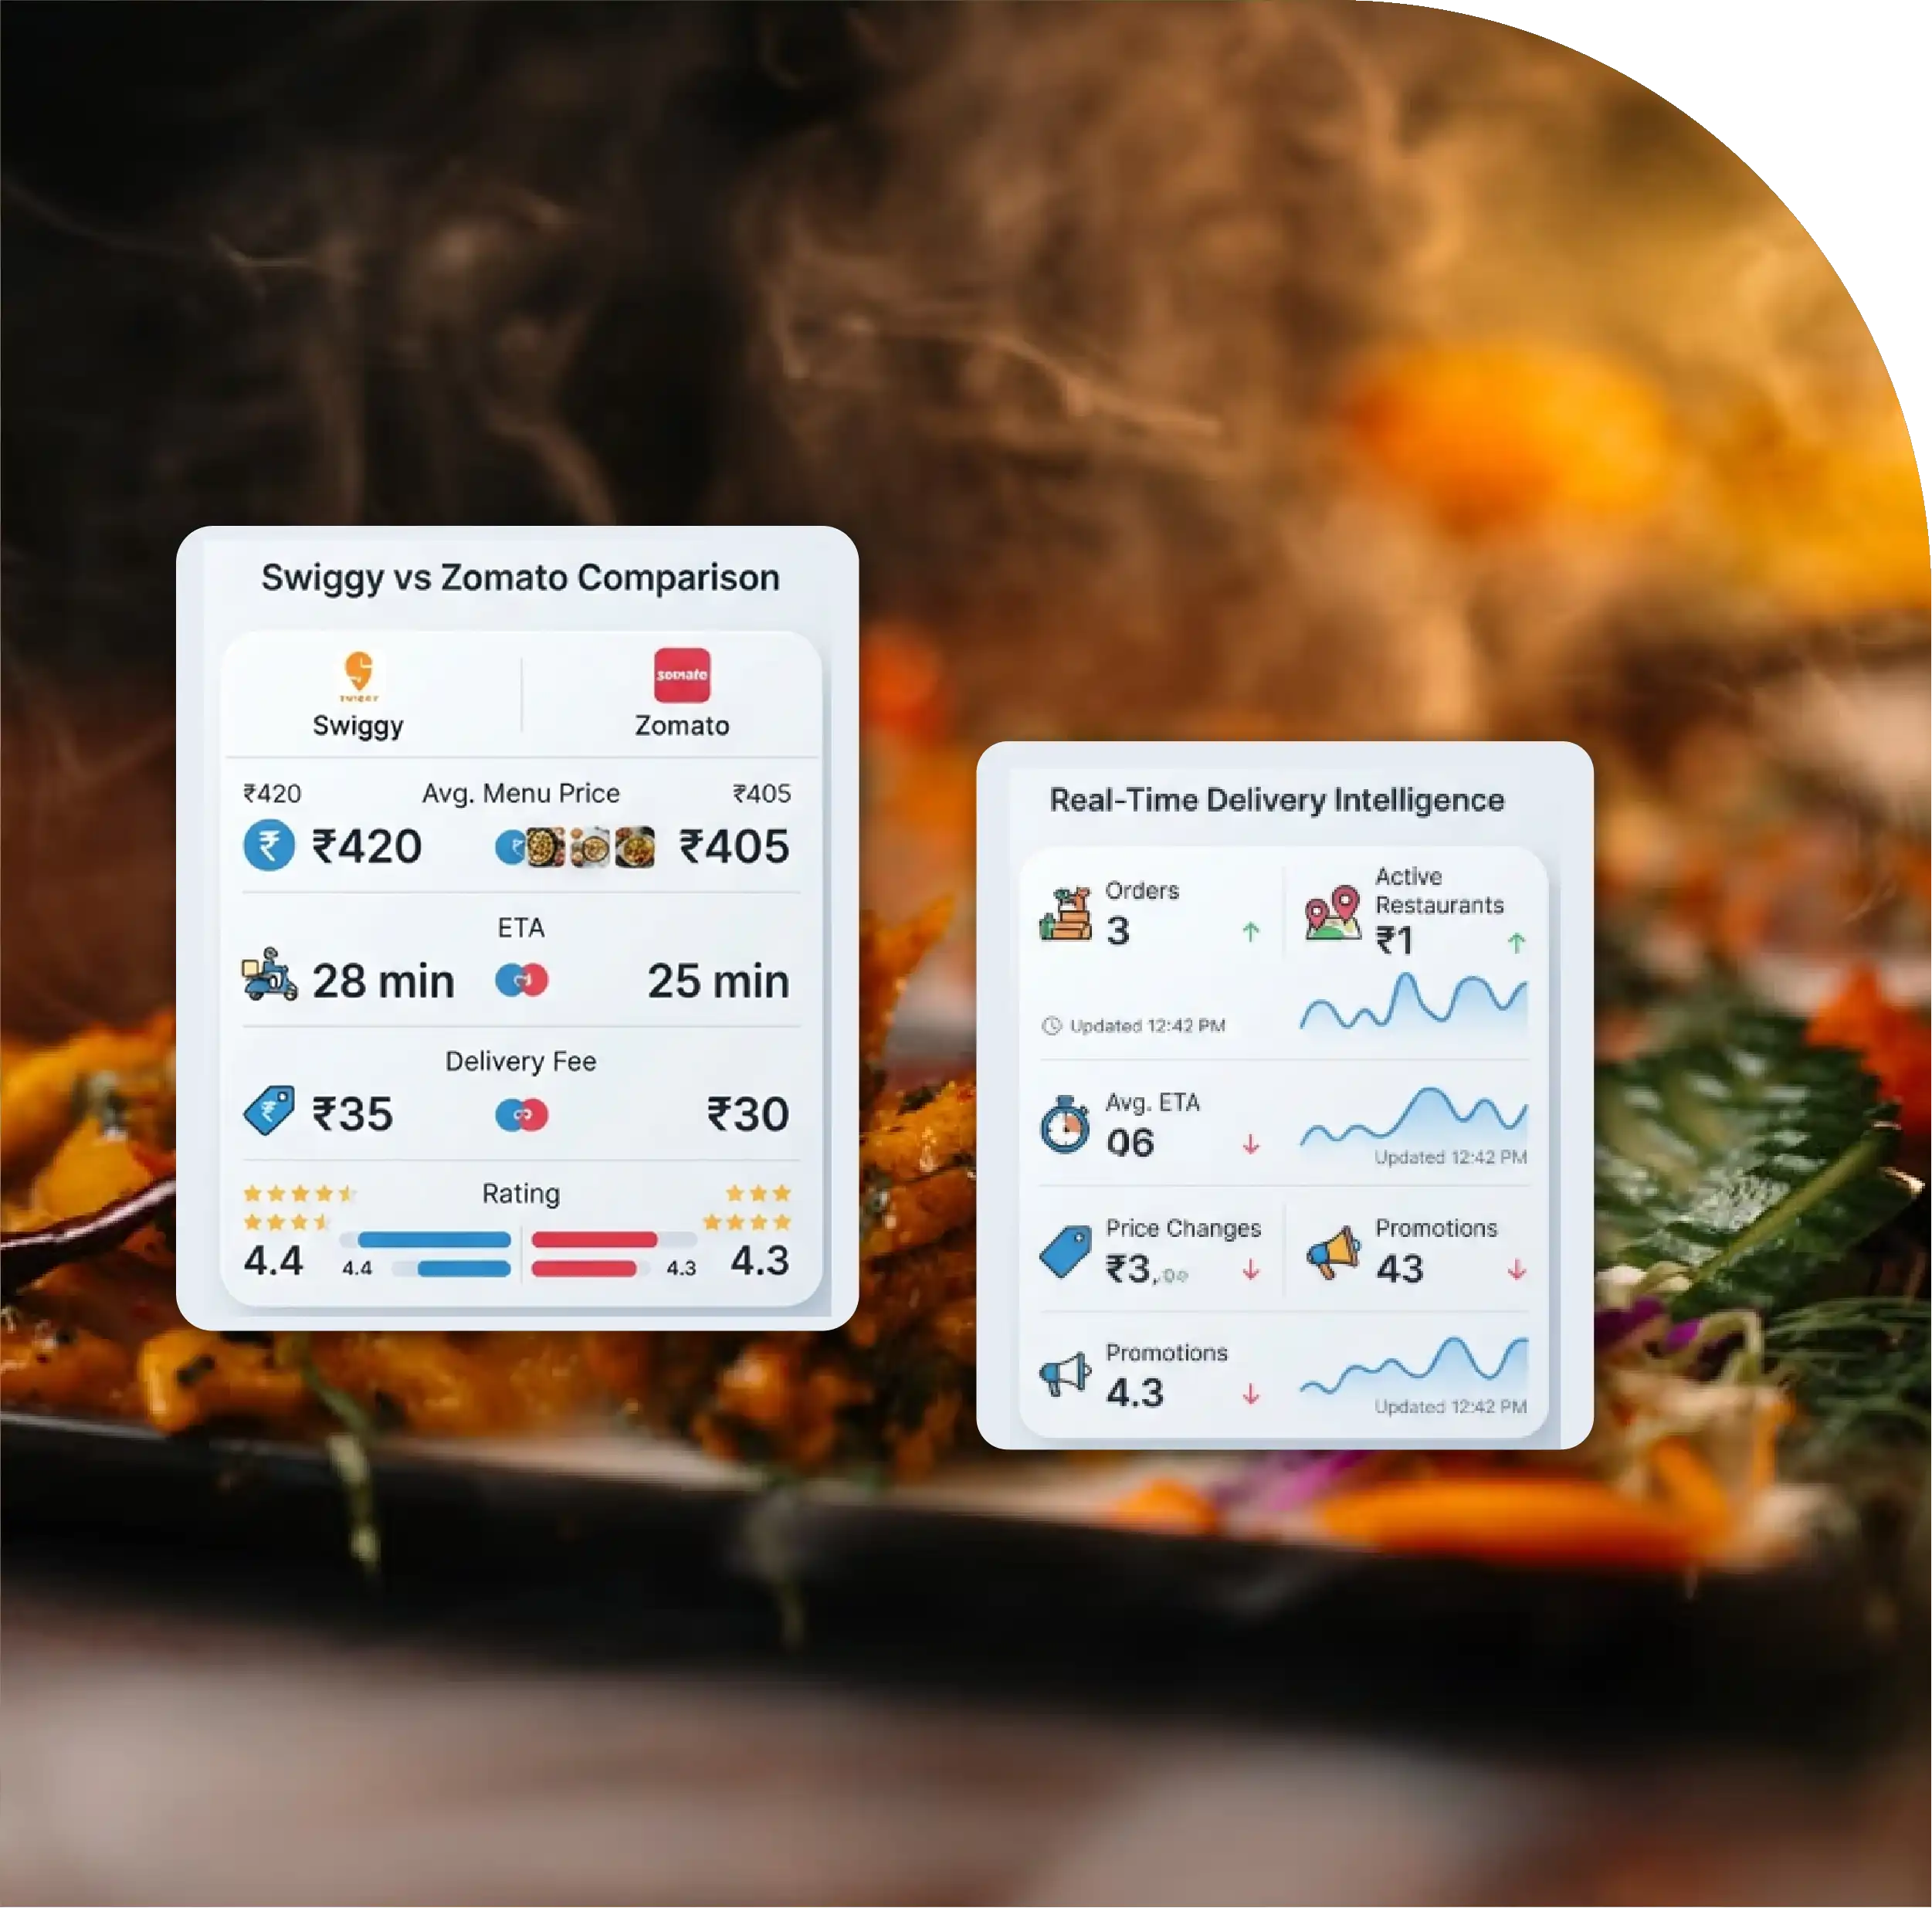
Real-Time Price Intelligence: Compare menu prices, discounts, fees, and final customer costs across Swiggy and Zomato.
Competitive Performance Tracking: Monitor delivery ETAs, restaurant availability, ratings, promotions, menu depth, and geographic coverage.
Historical Menu Analytics: Track price changes, new launches, removed items, promotional shifts, and assortment evolution over time.
Automated Competitive Alerts: Detect major price, promotion, availability, ETA, menu, and delivery-fee changes as they occur.
Actionable Food Delivery Intelligence: Transform continuously collected marketplace data into dashboards that support pricing, benchmarking, expansion, and strategic decisions.

India's online food-delivery ecosystem has evolved into a highly dynamic marketplace where restaurant assortment, menu pricing, promotions, delivery charges, availability, ratings, and customer experience can change throughout the day. For restaurants, aggregators, investors, brands, and market researchers, periodic snapshots are no longer sufficient. Real-time competitive intelligence is increasingly important for understanding what customers actually see when ordering.
The Swiggy vs Zomato Dashboard Intelligence Report 2026 focuses on how continuously collected marketplace data can transform food-delivery monitoring into an actionable analytics system. The report examines Swiggy vs Zomato pricing analysis, while also demonstrating how Swiggy vs Zomato competitive tracking can reveal differences in menu prices, discounts, delivery economics, restaurant coverage, and customer-facing offers.
Swiggy reported FY2026 food-delivery GOV growth of 22.6% year over year, with food-delivery adjusted EBITDA reaching ₹297 crore in Q4 FY2026. Its platform monthly transacting users also reached 25.2 million across its broader platform. Meanwhile, Zomato's disclosed FY2025 food-delivery GOV was ₹9,778 crore for Q4, alongside 20.9 million average monthly transacting customers.
This competitive environment creates a strong requirement for food delivery market intelligence that combines structured collection, normalization, historical comparison, and dashboard visualization.
A sophisticated dashboard should go beyond simply comparing the listed price of the same dish. It should capture the complete customer-facing economics of an order.
Important variables include restaurant name, cuisine, location, item name, base menu price, discounted price, percentage discount, packaging charge, delivery charge, platform fee, taxes, offer eligibility, delivery ETA, ratings, review counts, restaurant availability, promotional badges, and meal-category positioning.
The resulting food delivery pricing intelligence API can feed dashboards, BI platforms, pricing engines, competitive-monitoring systems, or internal analytics environments.
The objective is to create a normalized view where identical or comparable dishes can be evaluated across both platforms despite differences in restaurant naming, menu structures, promotional terminology, and geographic availability.
| Intelligence Metric | Swiggy Example | Zomato Example | Variance | Business Interpretation |
|---|---|---|---|---|
| Restaurants tracked | 25,000 | 25,000 | 0 | Matched marketplace universe |
| Menu items analyzed | 1,250,000 | 1,180,000 | 70,000 | Catalog breadth difference |
| Average item price | ₹285 | ₹292 | ₹7 | Platform price variance |
| Average discount | 18% | 16% | 2 pp | Promotional intensity |
| Average delivery fee | ₹42 | ₹45 | ₹3 | Customer cost difference |
| Average ETA | 34 min | 36 min | 2 min | Service-speed advantage |
| Average rating | 4.21 | 4.18 | 0.03 | Customer perception |
| Items unavailable | 7.8% | 8.6% | 0.8 pp | Availability difference |
| Restaurants with offers | 41% | 38% | 3 pp | Promotion penetration |
| Premium restaurants | 19% | 21% | 2 pp | Assortment positioning |
| Budget restaurants | 36% | 34% | 2 pp | Value-market coverage |
| Price changes/day | 4.8 | 4.5 | 0.3 | Dynamic pricing activity |
Illustrative dashboard dataset for demonstrating the analytical framework; figures are not presented as audited marketplace measurements.
The most valuable layer of the dashboard is not the absolute menu price but price comparability.
For example, a paneer dish listed at ₹240 on one platform and ₹250 on another may initially appear to have a ₹10 difference. However, a customer may receive different discounts, delivery fees, platform fees, or restaurant-specific promotions. Therefore, the dashboard should calculate both listed-price variance and effective-order-price variance.
A useful calculation is:
Effective Customer Price = Menu Price – Discount + Delivery Fee + Packaging Fee + Platform Fee + Applicable Charges
This approach makes Swiggy vs Zomato food delivery price monitoring substantially more meaningful than simple menu-price comparisons.
A powerful Swiggy vs Zomato Dashboard can be divided into several analytical layers.
1. Price Comparison Layer: This layer identifies restaurants and menu items appearing on both platforms and compares their prices. Users can filter results by city, cuisine, restaurant, item category, price range, or date.
2. Promotion Intelligence: The dashboard can track coupon availability, percentage discounts, flat-value offers, free-delivery campaigns, combo deals, bank offers, subscription benefits, and platform-specific promotions.
3. Delivery Intelligence: Delivery ETA and delivery fees can be monitored by location and time period. This enables businesses to determine whether one platform consistently offers faster delivery or lower customer-facing delivery costs.
4. Availability Intelligence: Restaurant availability can change according to operating hours, capacity, delivery radius, demand, and temporary closures. Historical availability tracking helps identify recurring gaps.
5. Restaurant Coverage: Businesses can compare restaurant counts, cuisine distribution, premium restaurant penetration, local restaurant density, and geographic coverage across platforms.
The following framework demonstrates how a large-scale dashboard can organize competitive measurements.
| Metric Category | Metric | Swiggy | Zomato | Difference | Monitoring Frequency | Strategic Use |
|---|---|---|---|---|---|---|
| Pricing | Avg. menu price | ₹285 | ₹292 | ₹7 | Hourly | Price benchmarking |
| Pricing | Median menu price | ₹245 | ₹250 | ₹5 | Hourly | Consumer affordability |
| Pricing | Discount rate | 18% | 16% | 2 pp | Hourly | Promotion tracking |
| Pricing | Avg. discount value | ₹62 | ₹58 | ₹4 | Hourly | Offer effectiveness |
| Pricing | Final basket value | ₹326 | ₹338 | ₹12 | Hourly | Customer economics |
| Delivery | Avg. delivery fee | ₹42 | ₹45 | ₹3 | 30 min | Fee benchmarking |
| Delivery | Avg. ETA | 34 min | 36 min | 2 min | 30 min | Service comparison |
| Delivery | Under-30-min share | 39% | 35% | 4 pp | 30 min | Speed advantage |
| Menu | Restaurants matched | 25,000 | 25,000 | --- | Daily | Competitive universe |
| Menu | Items matched | 840,000 | 840,000 | --- | Daily | SKU-level comparison |
| Menu | New items/day | 8,400 | 7,900 | 500 | Daily | Menu innovation |
| Menu | Removed items/day | 5,200 | 5,600 | -400 | Daily | Assortment churn |
| Availability | Available restaurants | 23,050 | 22,900 | 150 | Hourly | Coverage analysis |
| Availability | Out-of-stock items | 7.8% | 8.6% | 0.8 pp | Hourly | Supply monitoring |
| Promotion | Restaurants with offers | 41% | 38% | 3 pp | Hourly | Campaign intensity |
| Promotion | BOGO offers | 6.2% | 5.8% | 0.4 pp | Daily | Deal comparison |
| Consumer | Avg. rating | 4.21 | 4.18 | 0.03 | Daily | Quality benchmarking |
| Consumer | Avg. reviews | 2,840 | 2,760 | 80 | Daily | Restaurant popularity |
| Geography | Tier-1 coverage | 91% | 92% | -1 pp | Weekly | Geographic reach |
| Geography | Tier-2 coverage | 74% | 77% | -3 pp | Weekly | Expansion analysis |
| Cuisine | Indian cuisine share | 29% | 28% | 1 pp | Daily | Category comparison |
| Cuisine | Chinese cuisine share | 14% | 15% | -1 pp | Daily | Category opportunity |
| Cuisine | Fast food share | 17% | 18% | -1 pp | Daily | Demand positioning |
| Tracking | Price changes/day | 4.8 | 4.5 | 0.3 | Daily | Dynamic pricing |
| Tracking | Offer changes/day | 6.1 | 5.7 | 0.4 | Daily | Campaign monitoring |
| Tracking | Data refresh success | 97.4% | 97.1% | 0.3 pp | Real time | Data-quality control |
Illustrative analytical values intended to demonstrate dashboard design rather than report verified marketplace statistics.
The strategy to Scrape Swiggy vs Zomato Price Comparison can be structured around a common product and restaurant identity model. Restaurant matching is particularly important because the same restaurant can have slightly different names, addresses, item descriptions, portion sizes, or category structures on competing platforms.
A robust system therefore creates standardized restaurant IDs and menu-item IDs before calculating price differences.
The dashboard can then display:
This creates a historical pricing timeline instead of a one-time comparison.
Tracking Swiggy vs Zomato Menu Prices allows analysts to identify pricing patterns that are invisible in conventional market research.
For instance, if a restaurant raises a biryani price from ₹260 to ₹285 on both platforms, the dashboard can classify the movement as a synchronized price increase. If the price changes only on one platform, it can be classified as a platform-specific variation.
Historical datasets can also reveal whether price changes occur during weekends, holidays, lunch periods, dinner periods, sporting events, or high-demand periods.
Zomato & Swiggy Order API vs Menu Data Scraping represents two fundamentally different data approaches.
Order-level APIs, where legitimately available and authorized, are designed around transactional workflows and application integrations. Menu-data collection focuses on publicly observable catalog information and customer-facing marketplace attributes.
For competitive intelligence, the latter can provide useful contextual information such as visible prices, offers, restaurant availability, delivery estimates, and menu structures. API data can complement this when appropriate access and permissions exist.
The most effective architecture often combines authorized first-party or partner data with carefully governed marketplace intelligence rather than treating either source as universally sufficient.
Scrape Zomato and Swiggy Food Prices to support restaurant operators, aggregators, food brands, investors, consulting firms, and pricing teams.
Restaurant chains can identify locations where their menu prices differ significantly from competitors. Food brands can monitor promotional intensity across cuisines. Market researchers can estimate category-level pricing trends. Delivery businesses can analyze geographic differences in fees and delivery times.
The data becomes particularly powerful when stored historically.
A single day's dataset answers what is happening now. A six-month dataset answers how the market is changing.
The dashboard should not merely visualize data—it should generate alerts.
For example, an alert can be triggered when:
These signals can be distributed through dashboards, email workflows, internal systems, or APIs.
Restaurants can use the intelligence to maintain competitive price positioning without blindly matching every competitor. Restaurant chains can identify city-level price gaps and determine where localized pricing requires attention.
Food-delivery companies can benchmark marketplace coverage, restaurant acquisition, promotions, delivery performance, and menu depth.
Investors and analysts can use historical marketplace observations alongside company-reported financial information. Swiggy, for example, publishes annual reports and financial documents through its investor-relations portal.
Meanwhile, market-intelligence teams can create city-by-city datasets to understand restaurant density, cuisine competition, pricing bands, and promotional behavior.
A scalable architecture can follow this pipeline:
Collection → Validation → Restaurant Matching → Menu Matching → Price Normalization → Historical Storage → Analytics → Dashboard → Alerts
The collection layer captures permitted marketplace data. The validation layer removes duplicates and identifies incomplete records. Matching connects the same restaurants and menu items across platforms.
Normalization converts prices, discounts, fees, ratings, timestamps, and categories into standardized fields.
Historical storage then makes trend analysis possible, while dashboard and alerting layers convert raw data into business decisions.
Data quality should also be measured continuously through duplicate rates, missing fields, restaurant-match accuracy, menu-match accuracy, timestamp validity, and collection success rates.
The competitive advantage in food delivery increasingly comes from understanding the market continuously rather than relying on occasional manual comparisons. A well-designed dashboard can transform millions of marketplace observations into practical intelligence covering pricing, promotions, menus, availability, delivery performance, and restaurant positioning.
For 2026, the strongest analytical approach is therefore to combine real-time collection, historical datasets, standardized entity matching, price normalization, competitive alerts, and interactive visualization. Scrape Swiggy and Zomato Data through appropriately governed and permitted data-collection workflows to build a continuously refreshed intelligence layer that helps businesses identify price gaps, monitor competitor behavior, understand market movements, and make faster pricing and strategic decisions.
With the right architecture, the dashboard becomes more than a comparison tool—it becomes a real-time competitive decision system for India's evolving food-delivery marketplace.
If you are seeking for a reliable data scraping services, Food Data Scrape is at your service. We hold prominence in Food Data Aggregator and Mobile Restaurant App Scraping with impeccable data analysis for strategic decision-making.



