

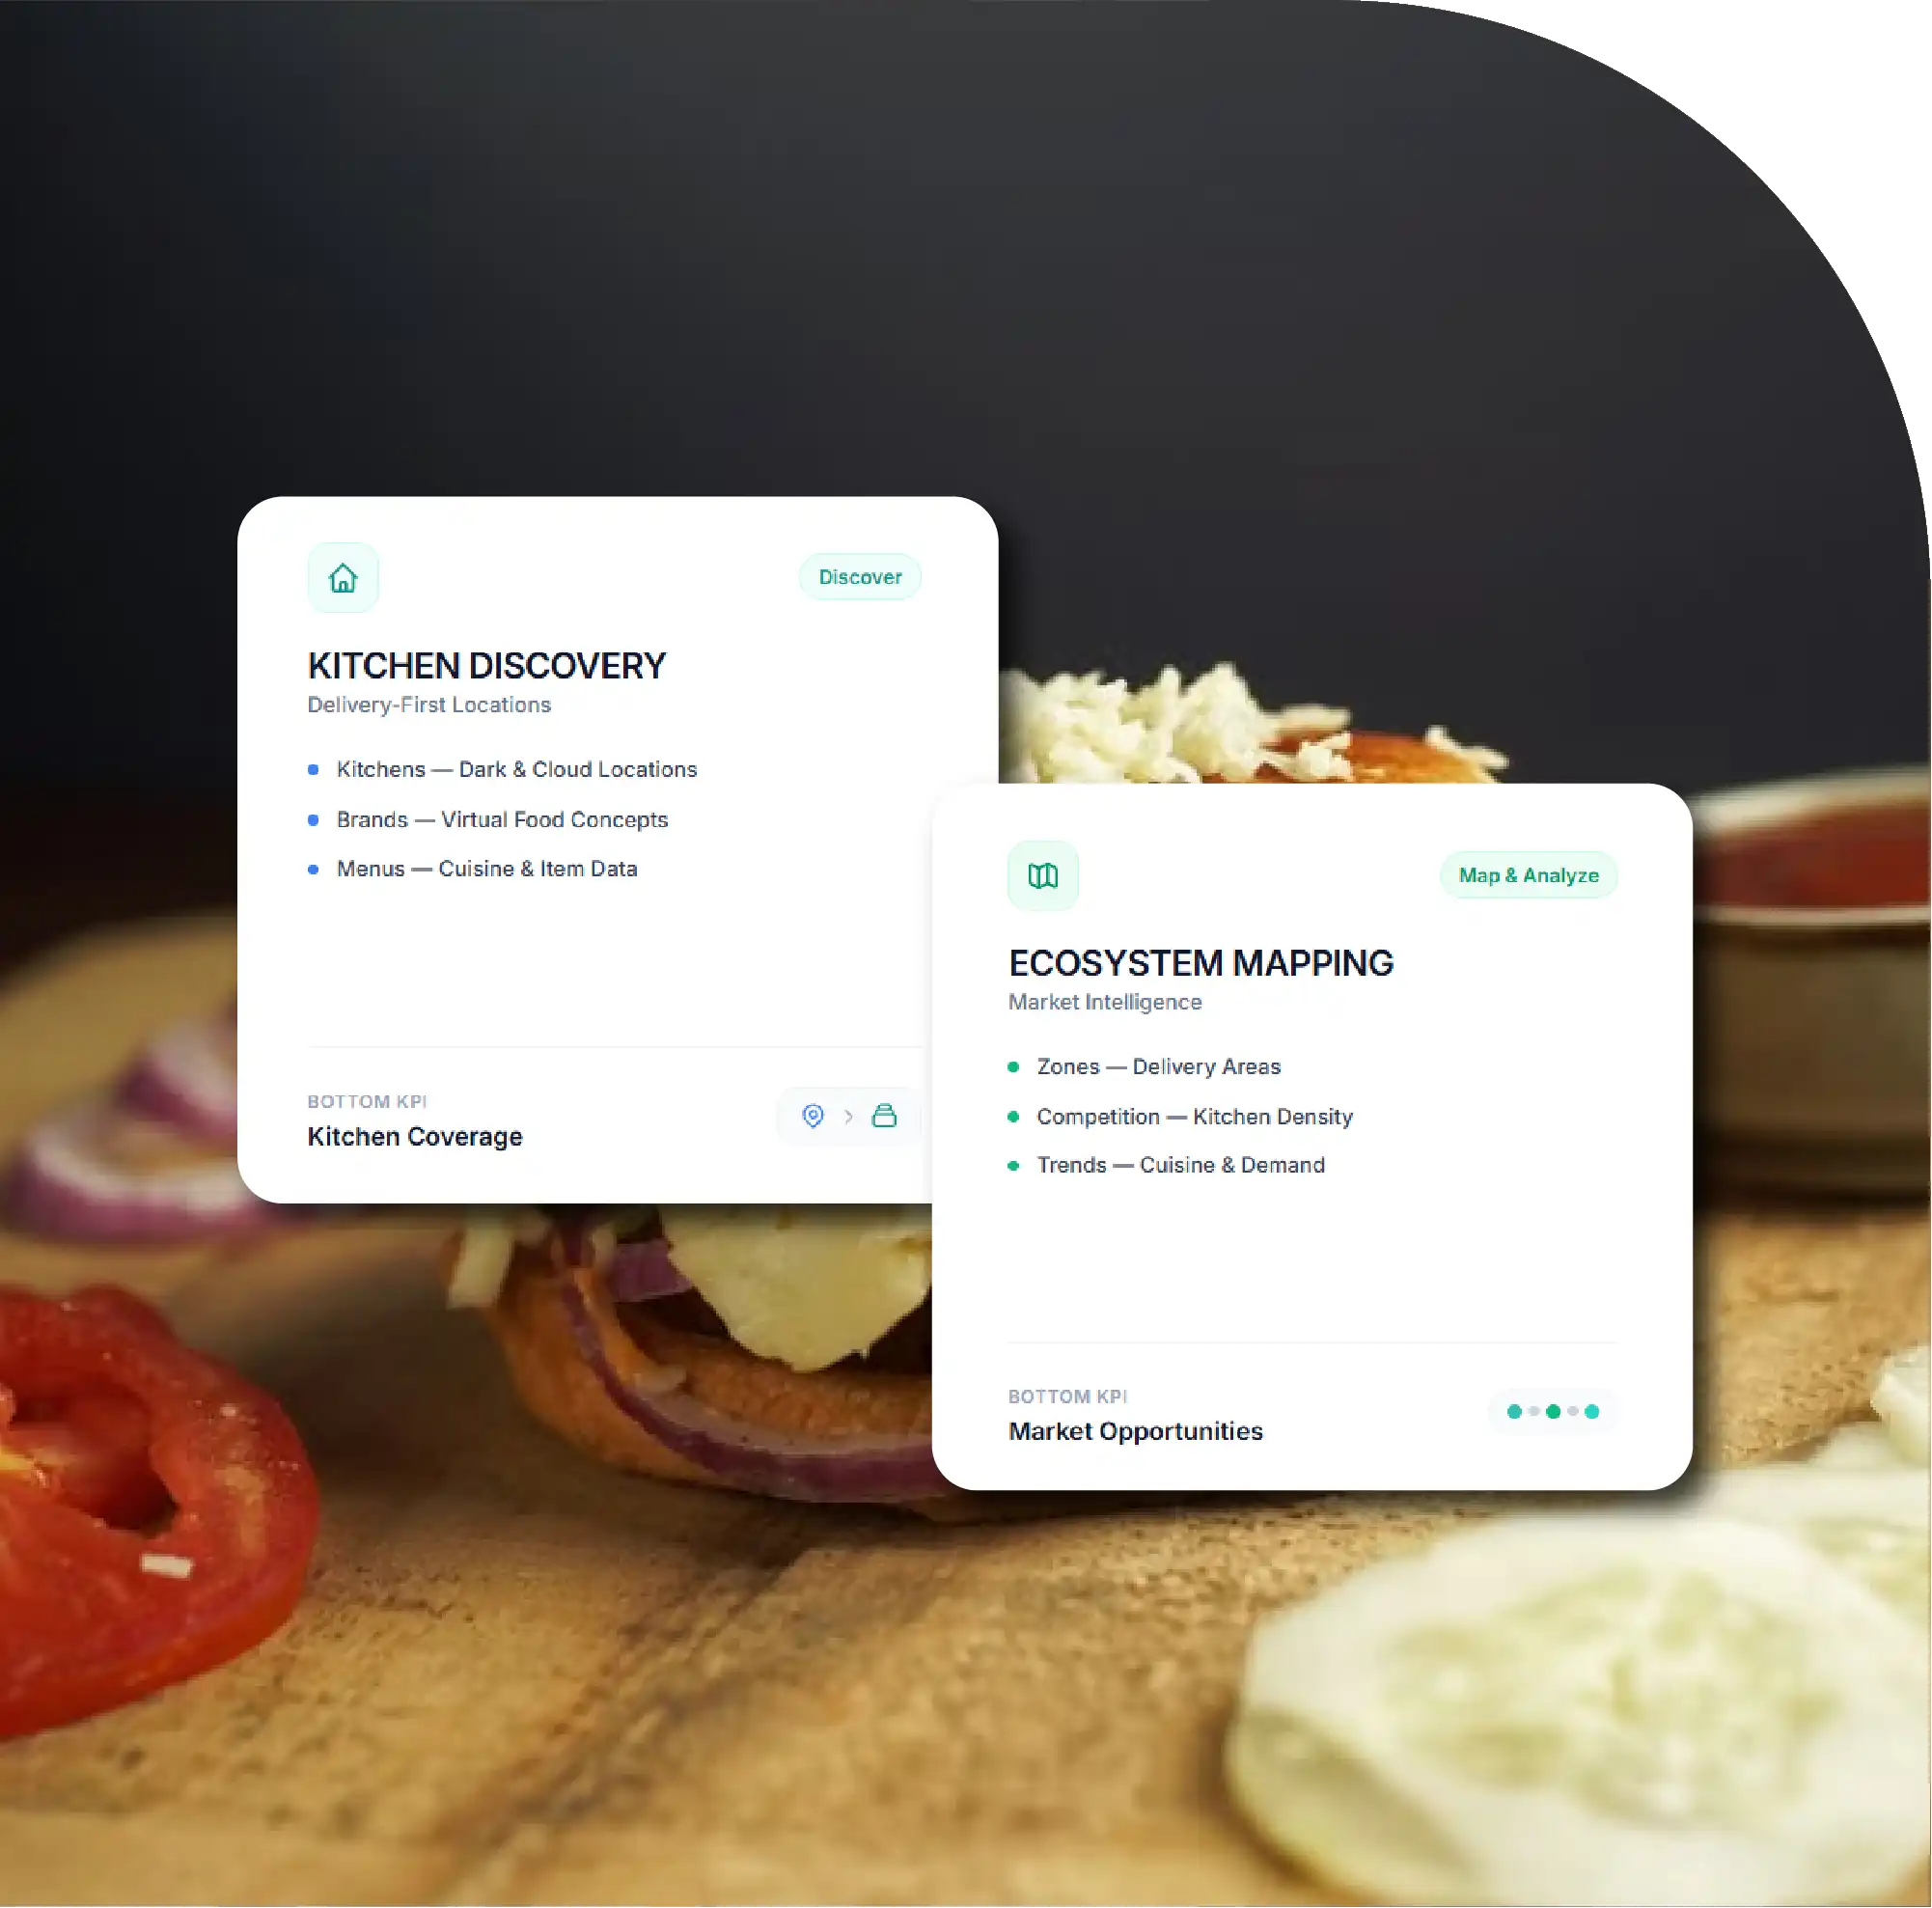
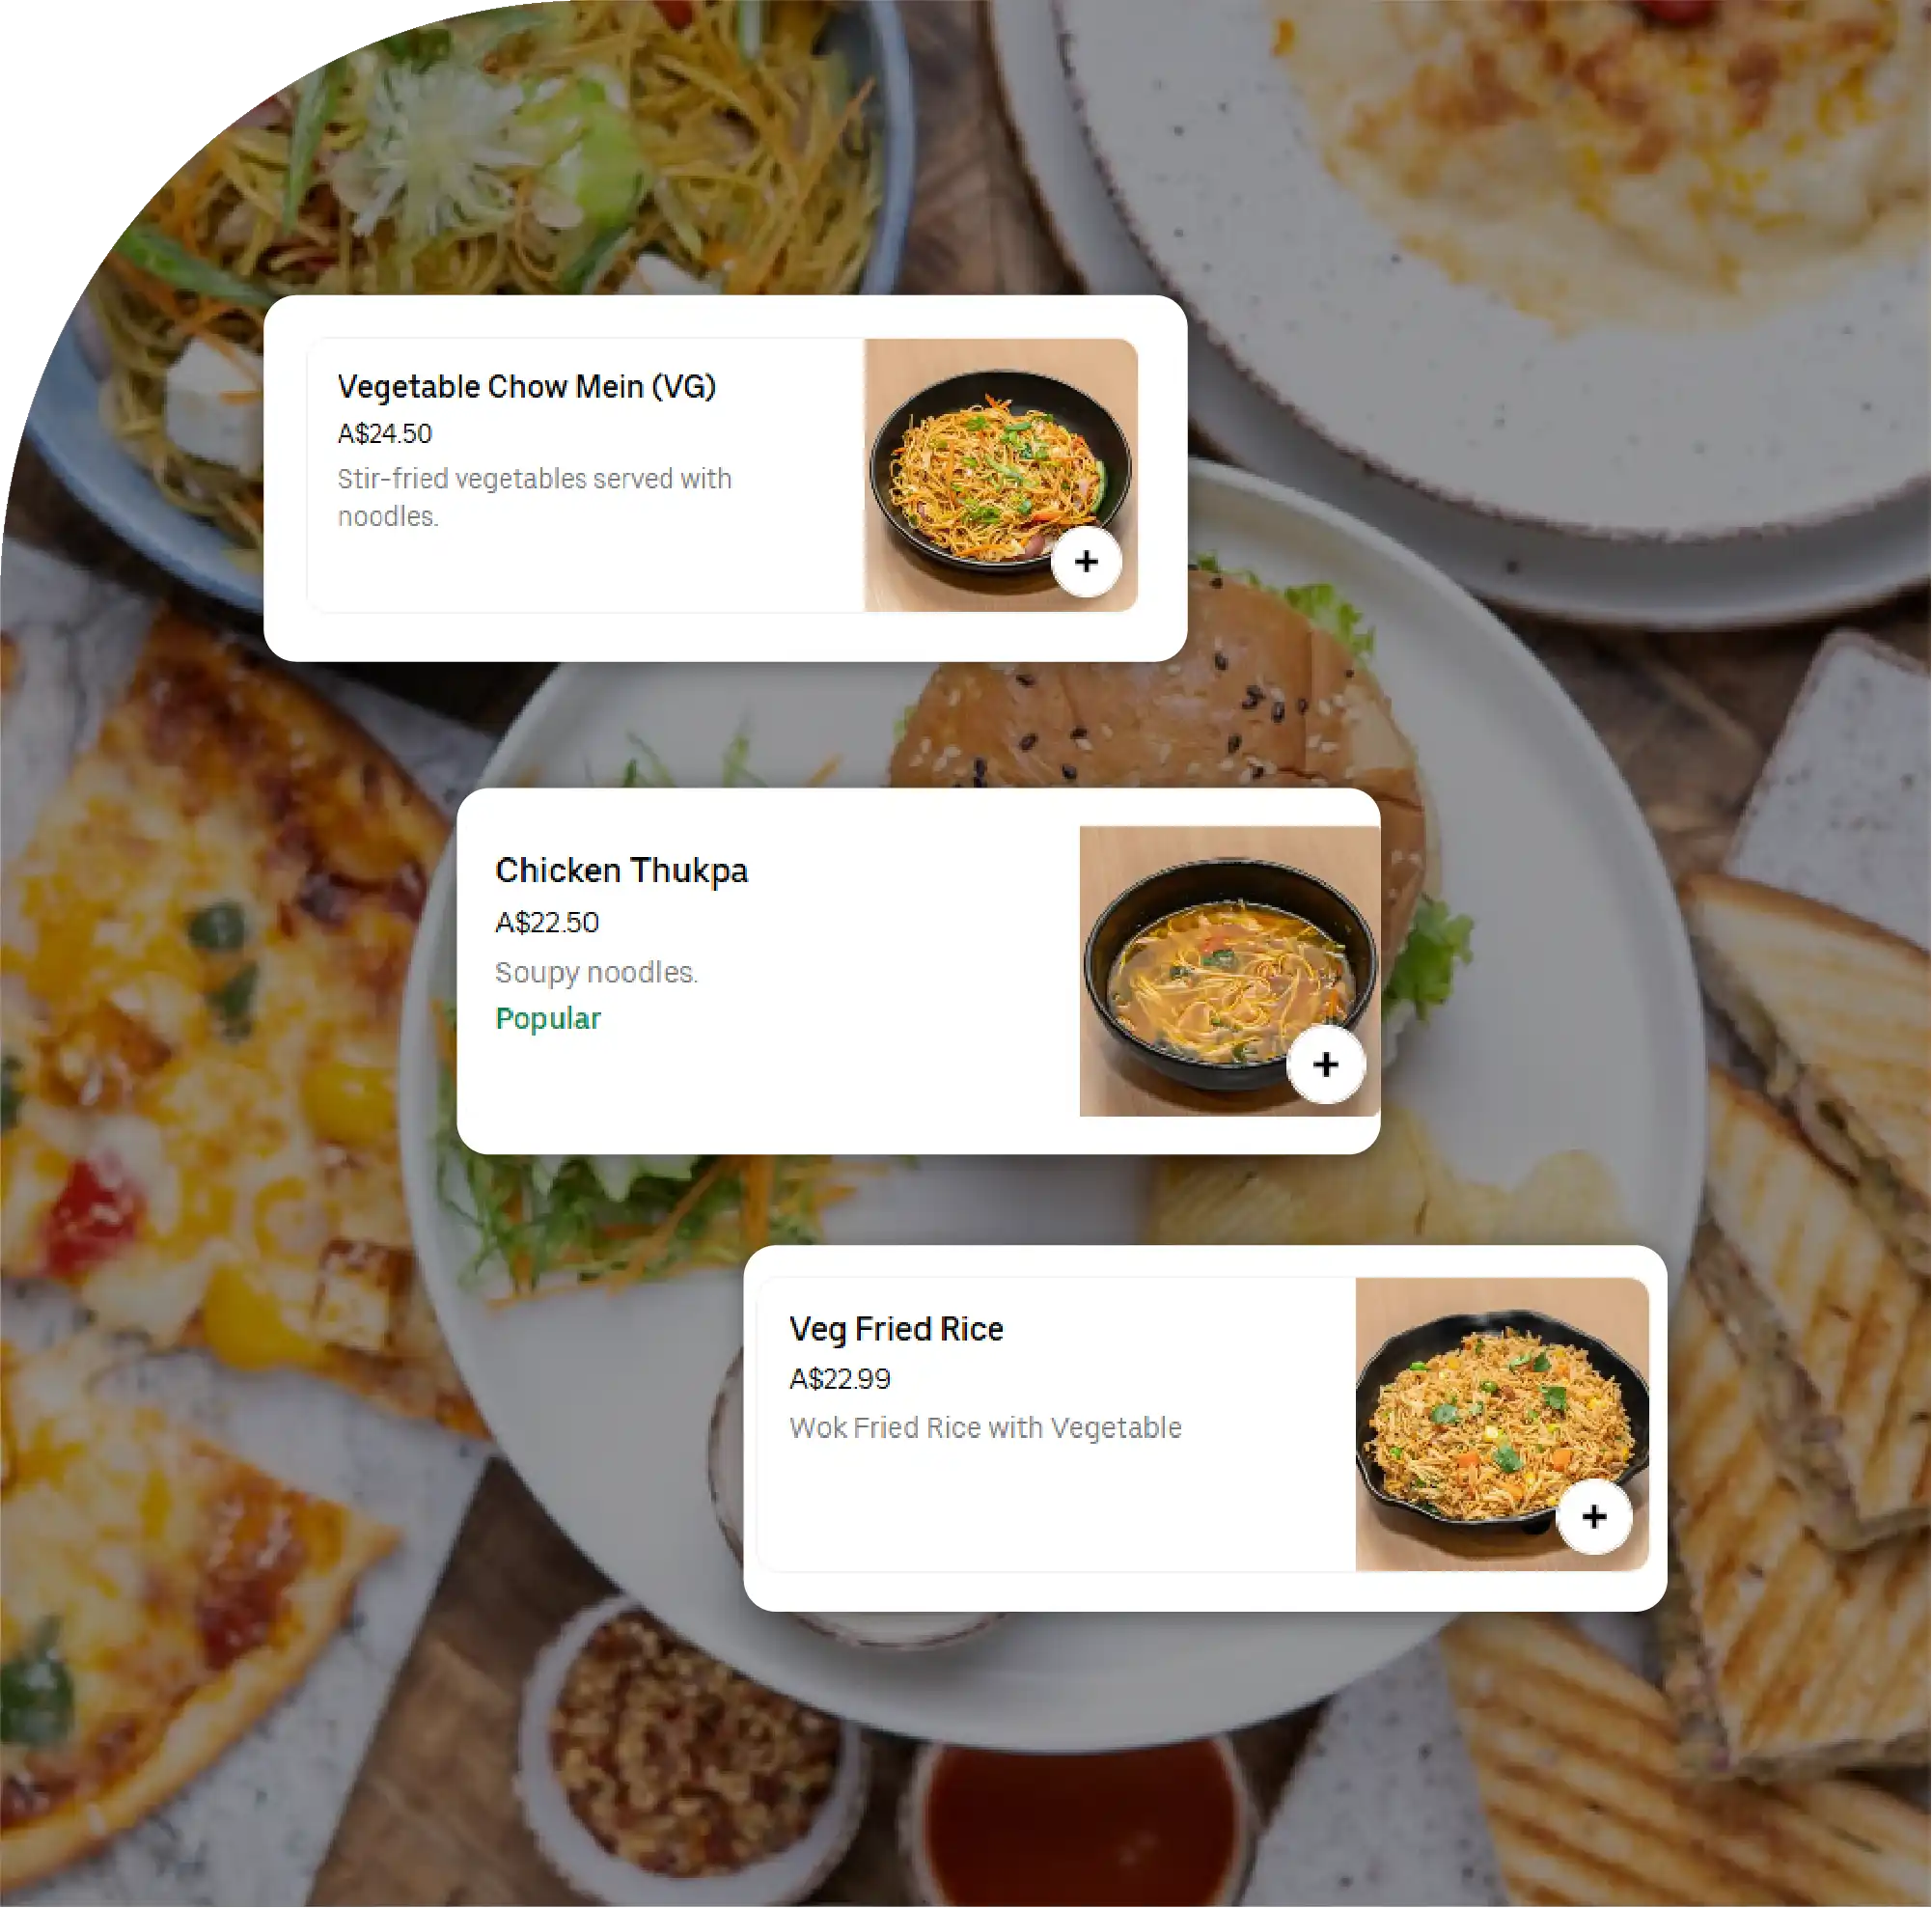
Market Discovery: Identifies dark kitchens, virtual brands, shared kitchens, and delivery-first restaurant concepts across cities.
Kitchen Mapping: Connects multiple digital restaurant listings to physical kitchen locations, revealing true operational footprints.
Competitive Intelligence: Tracks menus, prices, ratings, cuisines, delivery times, promotions, and competitor expansion patterns.
Geographic Insights: Highlights high-density kitchen clusters, underserved neighborhoods, emerging markets, and changing delivery coverage.
Business Opportunities: Supports market entry, investment research, pricing strategy, competitor benchmarking, and cloud kitchen expansion decisions.

The foodservice industry is undergoing a structural shift as restaurants increasingly operate without traditional dining rooms. Delivery-first brands, virtual restaurants, shared commercial kitchens, and multi-brand food hubs are changing how restaurant businesses enter markets, test concepts, and compete for digital demand. Dark Kitchen & Cloud Kitchen Discovery Data scrape provides a systematic way to identify these businesses, map their operating footprints, compare menus, and understand how delivery-led foodservice is expanding across cities.
A comprehensive cloud kitchen restaurant database can combine restaurant names, virtual brands, kitchen addresses, cuisines, delivery platforms, ratings, menus, prices, operating hours, locations, and service areas. This creates a structured market view that is difficult to achieve through conventional restaurant research.
Similarly, a dark kitchen location dataset can reveal where delivery-only operations are concentrated, which neighborhoods are experiencing the fastest expansion, and how kitchen density differs between established restaurant districts and emerging residential zones.
The importance of this intelligence extends beyond simply finding restaurants. Investors can identify high-growth kitchen clusters, delivery platforms can improve coverage, food brands can discover underserved markets, and restaurant operators can benchmark competitors. For analysts, virtual restaurant data extraction turns fragmented digital listings into structured intelligence that can support expansion, pricing, menu, and competitive decisions.
Dark kitchens and cloud kitchens generally operate without the conventional front-of-house infrastructure associated with restaurants. A single physical facility may support several brands, cuisines, menus, or concepts simultaneously. One kitchen address could therefore appear online under multiple restaurant identities.
This creates a significant data challenge.
A conventional restaurant database might treat every listing as a separate physical location. A discovery-focused dataset attempts to determine whether several digital brands are actually connected to the same kitchen, operator, address, or delivery infrastructure.
The resulting ghost kitchen intelligence can include both observable information and derived relationships. Analysts can connect restaurant listings with coordinates, menu similarities, operating schedules, phone numbers, addresses, cuisine categories, ratings, and delivery-platform presence.
Data collection can cover major delivery marketplaces, restaurant websites, search listings, social profiles, business directories, and other publicly accessible sources. Scraping Dark Kitchen Surge helps identify rapid growth patterns across these sources. After collection, records can be standardized and deduplicated to create a more reliable representation of the market.
A robust dataset can capture:
The real value comes from combining these fields rather than treating them independently.
For example, 15 restaurant brands within a small geographic radius may initially appear to represent 15 independent businesses. Address matching, menu similarity, contact information, and operating patterns could reveal that several are operating from the same commercial kitchen.
Dark kitchen discovery scrape methodologies can identify delivery-first businesses that are difficult to locate using traditional restaurant directories. Search results and delivery marketplaces often expose brand names but do not clearly classify whether the restaurant has a dining room.
A discovery workflow can therefore use multiple signals.
First, restaurant listings can be collected across target cities. Second, addresses and coordinates can be normalized. Third, duplicate addresses can be grouped. Fourth, menu and brand information can be compared. Finally, records can be scored according to their likelihood of representing delivery-only operations.
This approach makes cloud kitchen discovery scrape valuable for market mapping because it transforms individual listings into geographic and competitive patterns.
For example, analysts can calculate the number of delivery-focused brands per postal zone, average kitchen density per square kilometer, average menu price, cuisine concentration, and the number of virtual brands associated with each kitchen cluster.
| City | Kitchen Sites | Virtual Brands | Avg Brands/Kitchen | Avg Menu Items | Avg Price ($) | Avg Rating | Avg Delivery Min | Cuisine Categories | High-Density Zones | New Listings/Month |
|---|---|---|---|---|---|---|---|---|---|---|
| London | 420 | 1,185 | 2.8 | 38 | 14.80 | 4.2 | 31 | 24 | 16 | 74 |
| New York | 510 | 1,460 | 2.9 | 42 | 17.60 | 4.3 | 34 | 29 | 21 | 89 |
| Dubai | 285 | 790 | 2.8 | 35 | 13.90 | 4.1 | 29 | 26 | 14 | 61 |
| Mumbai | 460 | 1,330 | 2.9 | 31 | 8.20 | 4.0 | 36 | 27 | 19 | 82 |
| Bengaluru | 395 | 1,090 | 2.8 | 33 | 7.60 | 4.1 | 34 | 25 | 17 | 77 |
| Delhi NCR | 435 | 1,240 | 2.9 | 34 | 7.90 | 4.0 | 37 | 26 | 18 | 80 |
| Singapore | 175 | 470 | 2.7 | 36 | 15.30 | 4.2 | 28 | 22 | 9 | 32 |
| Toronto | 260 | 705 | 2.7 | 39 | 16.10 | 4.2 | 33 | 23 | 12 | 48 |
| Los Angeles | 380 | 1,020 | 2.7 | 41 | 18.40 | 4.3 | 35 | 27 | 15 | 68 |
| Paris | 310 | 825 | 2.7 | 37 | 15.70 | 4.1 | 32 | 25 | 13 | 53 |
Illustrative dataset for research and analytical modeling; figures are not presented as verified market statistics.
Once kitchen-level data is collected, analysts can move beyond simple restaurant counting.
One important metric is brand-to-kitchen density. A high ratio indicates that commercial kitchens may be supporting multiple virtual concepts. Another useful metric is menu overlap. If several brands sell highly similar dishes at the same address, they may represent related concepts or operationally connected businesses.
Geographic density is equally important. A map showing 500 restaurant listings does not necessarily indicate 500 kitchens. Consolidating listings by physical location can reveal the true infrastructure supporting delivery demand.
Pricing intelligence adds another layer. Analysts can compare average entrée prices, meal bundles, delivery fees, discounts, minimum order values, and premium pricing across kitchen clusters.
This creates a more complete picture of the economics of delivery-first foodservice.
A major application is market-entry research. Suppose a food brand wants to launch a delivery-only concept in a new city. Instead of evaluating the market solely by population, it can assess existing kitchen density, cuisine competition, menu prices, delivery times, ratings, and neighborhood coverage.
The data can identify areas where demand appears strong but competitive supply is comparatively low.
Operators can also monitor competitor movements. A sudden increase in virtual brands around a particular neighborhood may indicate rising delivery demand, availability of commercial kitchen infrastructure, or aggressive expansion by a restaurant group.
For investors and consultants, these signals can help evaluate the maturity of individual markets.
| Metric | Emerging Market | Developing Market | Mature Market | Strategic Interpretation |
|---|---|---|---|---|
| Kitchens per 100 km² | 18 | 42 | 76 | Measures physical kitchen concentration |
| Virtual brands per 100 kitchens | 128 | 184 | 267 | Indicates multi-brand adoption |
| Average menu items | 26 | 34 | 41 | Indicates menu sophistication |
| Average cuisine categories | 14 | 22 | 29 | Shows competitive variety |
| Average rating | 3.8 | 4.0 | 4.3 | Indicates customer maturity |
| Average delivery time | 43 min | 35 min | 29 min | Reflects operational efficiency |
| Average discount rate | 8% | 13% | 19% | Measures promotional intensity |
| Average delivery fee | $3.90 | $3.20 | $2.40 | Indicates delivery competitiveness |
| Average order value | $19 | $24 | $31 | Indicates market monetization |
| Monthly new brands | 18 | 41 | 73 | Indicates expansion velocity |
| Multi-brand kitchen share | 21% | 38% | 57% | Measures virtual-brand concentration |
| Menu overlap index | 18% | 29% | 43% | Indicates concept similarity |
| High-density clusters | 4 | 9 | 17 | Highlights competitive hotspots |
| Average cuisine competition | 7 brands | 14 brands | 26 brands | Measures category saturation |
| Brand churn rate | 16% | 12% | 9% | Tracks listing stability |
Illustrative analytical framework rather than verified market statistics.
Large-scale collection requires more than a basic scraper. Restaurant listings can change frequently, menus can vary by location, prices can differ between platforms, and delivery availability may depend on geographic coordinates.
A modern data pipeline can combine automated collection, HTML parsing, browser automation where necessary, structured extraction, entity matching, geocoding, deduplication, and historical storage.
Python-based tools such as Requests, BeautifulSoup, Scrapy, Pandas, and Selenium can support different stages of the pipeline. Larger datasets can be processed using distributed frameworks and stored in PostgreSQL, cloud storage, data warehouses, or analytical platforms.
A useful architecture generally follows this sequence:
Discovery → Collection → Normalization → Entity Matching → Geolocation → Deduplication → Validation → Historical Storage → Analytics
Entity resolution is particularly important. "Burger Lab," "Burger Lab Kitchen," and another similarly named virtual brand should not automatically be treated as separate or identical entities. Multiple signals should be evaluated before creating relationships.
The resulting intelligence can support several business functions.
Restaurant groups can identify competitors before entering a new neighborhood. Delivery platforms can improve merchant discovery and coverage analysis. Foodservice investors can study kitchen density and virtual-brand proliferation. Consumer analytics companies can monitor restaurant assortment and pricing.
Brands can also use historical snapshots to measure how competitors change menus and prices over time. This allows analysts to detect new product launches, discontinued dishes, promotional campaigns, cuisine expansion, and changes in delivery coverage.
For commercial kitchen providers, the same dataset can reveal potential customers by identifying neighborhoods with rapid increases in delivery-only concepts.
The largest challenge is that online restaurant identity does not always equal physical business identity.
Listings may contain outdated addresses, temporary menus, duplicate pages, closed kitchens, inconsistent brand names, or platform-specific prices. Delivery marketplaces can also personalize results based on location.
Consequently, a high-quality dataset needs validation rules and recurring refresh cycles.
Historical storage is especially valuable because a single snapshot only shows the market at one point in time. Monthly or weekly collection can reveal expansion, contraction, price changes, menu evolution, and brand churn.
Privacy and compliance should also be considered. Data collection should focus on publicly available business information, follow applicable website terms and regulations, and avoid unnecessary collection of personal information.
The growth of delivery-first restaurants has created a new layer of foodservice infrastructure that conventional restaurant databases often fail to capture. Kitchens can support multiple brands, menus can change rapidly, and digital restaurant identities can appear across several platforms simultaneously.
A structured discovery dataset solves part of this complexity by connecting brands, menus, locations, prices, ratings, cuisines, delivery information, and operating signals into a unified intelligence layer.
Trend Dark Store Kitchen Mapping can help businesses understand how delivery infrastructure is spreading across neighborhoods and how kitchen clusters influence competitive intensity.
Scraping Helps Cloud Kitchens by providing recurring visibility into competitor menus, prices, locations, customer signals, and emerging virtual-brand opportunities.
Finally, Cloud Kitchen Data Scraping can transform fragmented digital listings into actionable intelligence for market expansion, competitive benchmarking, pricing analysis, investment research, and foodservice strategy.
The strongest systems will not simply count restaurants. They will identify the physical kitchens behind digital brands, monitor how those relationships evolve, and convert changes in menus, prices, locations, and delivery availability into measurable market signals. In an increasingly delivery-led food economy, that distinction can become a major competitive advantage.
If you are seeking for a reliable data scraping services, Food Data Scrape is at your service. We hold prominence in Food Data Aggregator and Mobile Restaurant App Scraping with impeccable data analysis for strategic decision-making.



