Introduction
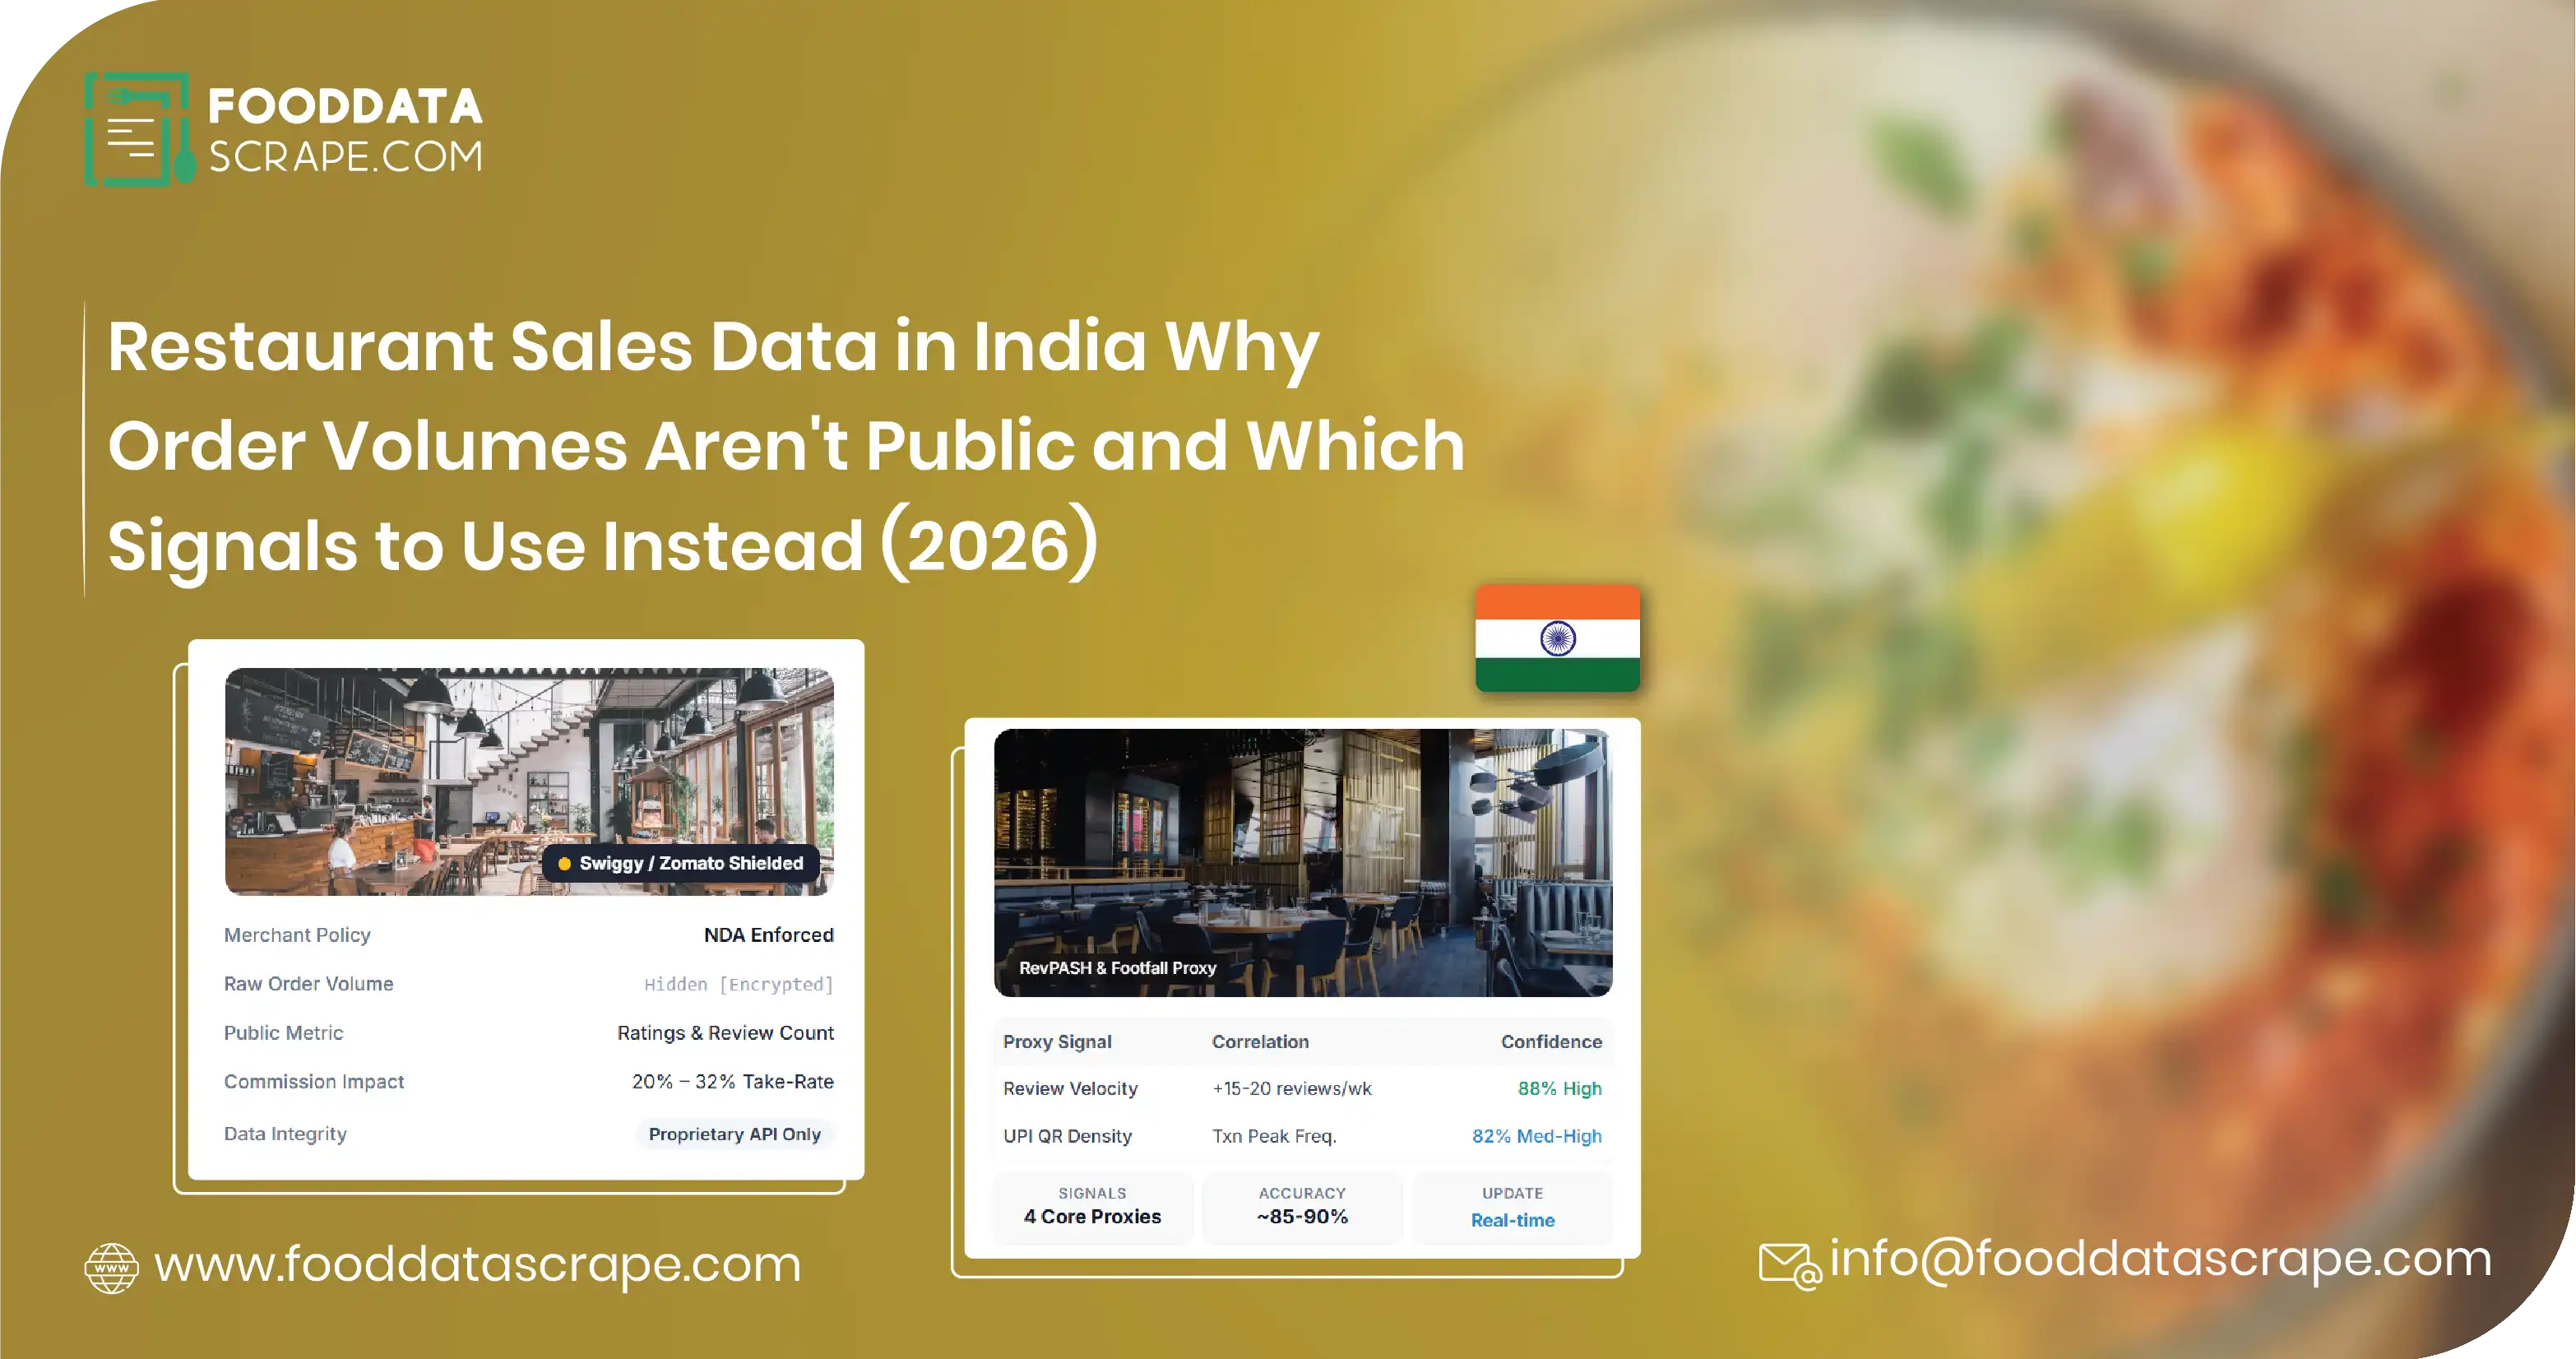
Restaurant sales data India teams ask for usually means one thing: how many orders a specific outlet or locality does each day. That number is not published. Swiggy and Zomato share order and sales figures only with the restaurant that owns the account, and with investors as platform-wide totals.
Short answer: Outlet-level order and sales volumes on Swiggy and Zomato are private to each restaurant. Food Data Scrape does not provide order or sales data and does not offer order-API or POS integration with either platform. What we can provide is public, clearly labelled proxy signals such as rating counts, review velocity, bestseller badges, menu breadth, open hours and delivery ETA.
This guide explains why the numbers are private, what the official filings do tell you about the market, and how to build a locality view from public signals without overstating what they mean.
Why is restaurant sales data in India not public?
Order counts and revenue sit inside each platform's restaurant partner tools. A restaurant logs in and sees its own orders, payouts and menu performance. Nobody else can see those screens, and accessing them without the owner's permission would mean bypassing a login, which we never do.
The platforms publish aggregated numbers to shareholders instead. These cover the whole business for a quarter, not a single outlet, city or cuisine. So any restaurant sales data India-wide that you find for free is either a platform total, an industry estimate, or a model built on proxies.
- Partner dashboards are private. Orders, payouts and item-level sales are visible only to the logged-in restaurant.
- Filings are aggregated. Shareholder letters report platform totals such as gross order value (GOV) and transacting users.
- Industry reports are estimates. Bodies such as the National Restaurant Association of India (NRAI) publish market-size estimates, not outlet sales.
- Third-party "order data" claims need scrutiny. If a vendor offers live order counts for outlets they do not own, ask how the data was obtained.
What do official filings say about the market?
Market context should come only from primary or well-reported sources. The table below uses figures published for the latest reported quarter (April–June 2026, Q1 FY27) and the most recent NRAI report coverage we could verify today. These totals are the closest thing to restaurant sales data India has in the public domain.
| Metric | Value | Period | Source |
|---|---|---|---|
| Swiggy food delivery GOV | ₹9,490 crore, up 17.4% YoY | Q1 FY27 | Swiggy shareholder letter (NSE filing) |
| Swiggy food delivery monthly transacting users | 19.2 million | Q1 FY27 | Swiggy shareholder letter (NSE filing) |
| Swiggy average monthly transacting restaurant partners | 265.8 thousand (275.4 thousand in Q4 FY26) | Q1 FY27 | Swiggy shareholder letter (NSE filing) |
| Swiggy food delivery adjusted EBITDA | ₹292 crore (3.1% of GOV) | Q1 FY27 | Swiggy shareholder letter (NSE filing) |
| Eternal B2C net order value (all consumer businesses) | ₹31,120 crore, up 54% YoY | Q1 FY27 | Eternal Q1 FY27 shareholders' letter |
| Zomato food delivery NOV only | ₹10,769 crore, up over 20% YoY | Q1 FY27 | PTI report on Eternal Q1 FY27 results (HDFC Sky) |
| India food services market (NRAI IFSR 2024) | ₹5.69 lakh crore in FY24, projected ₹7.76 lakh crore by FY28 | FY24–FY28 | India Retailing on NRAI IFSR 2024 |
Swiggy's letter also notes that GOV growth would have been about 18% excluding restaurant cancellations linked to LPG supply disruptions. That kind of context matters when you compare quarters.
A simple platform-level estimate
Estimate (our calculation, not a reported figure): dividing Swiggy's Q1 FY27 food delivery GOV (₹9,490 crore) by its 265.8 thousand average monthly transacting restaurant partners gives roughly ₹3.6 lakh of GOV per partner for the quarter, or about ₹1.2 lakh a month.
Method and limits: GOV is used as Swiggy defines it in the letter. This is a platform-wide average across very different outlets. It says nothing about any single restaurant, locality or cuisine, and should never be used as an outlet's sales figure.
The 3 platforms that matter and how they differ
For outlet and chain-location intelligence in India, three public surfaces cover most needs. Each shows a different slice of the picture.
| Platform | What is publicly visible | What is not public | Best use as a proxy |
|---|---|---|---|
| Swiggy | Outlet listings, menus, prices, ratings and rating counts, offers, delivery fee and ETA, open/closed status | Orders, sales, payouts, customer data | Menu breadth, price position, availability and delivery reach by locality |
| Zomato | Outlet listings, menus, prices, delivery and dining ratings, review counts, offers, open hours | Orders, sales, payouts, customer data | Rating and review velocity, cuisine mix, offer intensity |
| Google Maps | Business listing, category, address, coordinates, opening hours, rating and review count, popular-times style signals where shown | Revenue, footfall counts, orders | Outlet counts by locality, dine-in demand signals, chain-location mapping |
Which public signals can stand in for restaurant sales data India buyers want?
None of these signals is a sales number. Each one is a directional indicator. Used together, and tracked over time, they help you rank localities and outlets without claiming to know their revenue.
- Rating count. The total number of ratings on an outlet. It grows with order volume over time, but the ratio of ratings to orders is unknown and varies by platform and customer type.
- Review velocity. New ratings or reviews added per week. Change over time is more useful than the absolute total.
- Bestseller badges. Item-level tags such as "Bestseller" show which dishes sell well relative to the rest of that menu, not how many units sold.
- Menu breadth. Number of items and categories. Large menus can signal a kitchen built for delivery volume or a multi-brand cloud kitchen.
- Availability and open hours. How often an outlet is listed as open, closed or "currently not accepting orders". Long open windows suggest steady operations.
- Outlet counts. Number of outlets per brand, cuisine or locality. Useful for white-space and saturation analysis.
- Delivery fee and ETA. Fees and estimated delivery times by locality show reach and how the platform prices distance.
- Price points and offers. Average item price and discount depth help separate premium, mid-market and value outlets.
| Proxy signal | What it suggests | What it does not tell you | How it is calculated |
|---|---|---|---|
| Rating count growth (weekly) | Relative demand momentum | Actual order count | (Ratings this week − ratings last week) ÷ ratings last week, per outlet; median across outlets in the locality |
| Bestseller share of menu | Concentration of popular items | Units or revenue per item | Items tagged 'Bestseller' ÷ total menu items, per outlet |
| Menu items per outlet | Kitchen scale and format | Kitchen throughput | Count of distinct menu items listed per outlet; median across the locality |
| Open-hours share | Operating consistency | Orders during those hours | Snapshots where the outlet shows as open ÷ total snapshots taken in its stated hours |
| Outlets per square km | Competitive density | Spend per outlet | Number of matched outlets ÷ locality area in square km |
| Median delivery ETA | Delivery coverage quality | Conversion rate | Median of the delivery ETA shown across outlets and snapshots in the locality, in minutes |
Index values above are placeholders. They are filled from a scoped Food Data Scrape dataset for your chosen localities, with the method stated alongside each one.
How to collect, clean and match the data
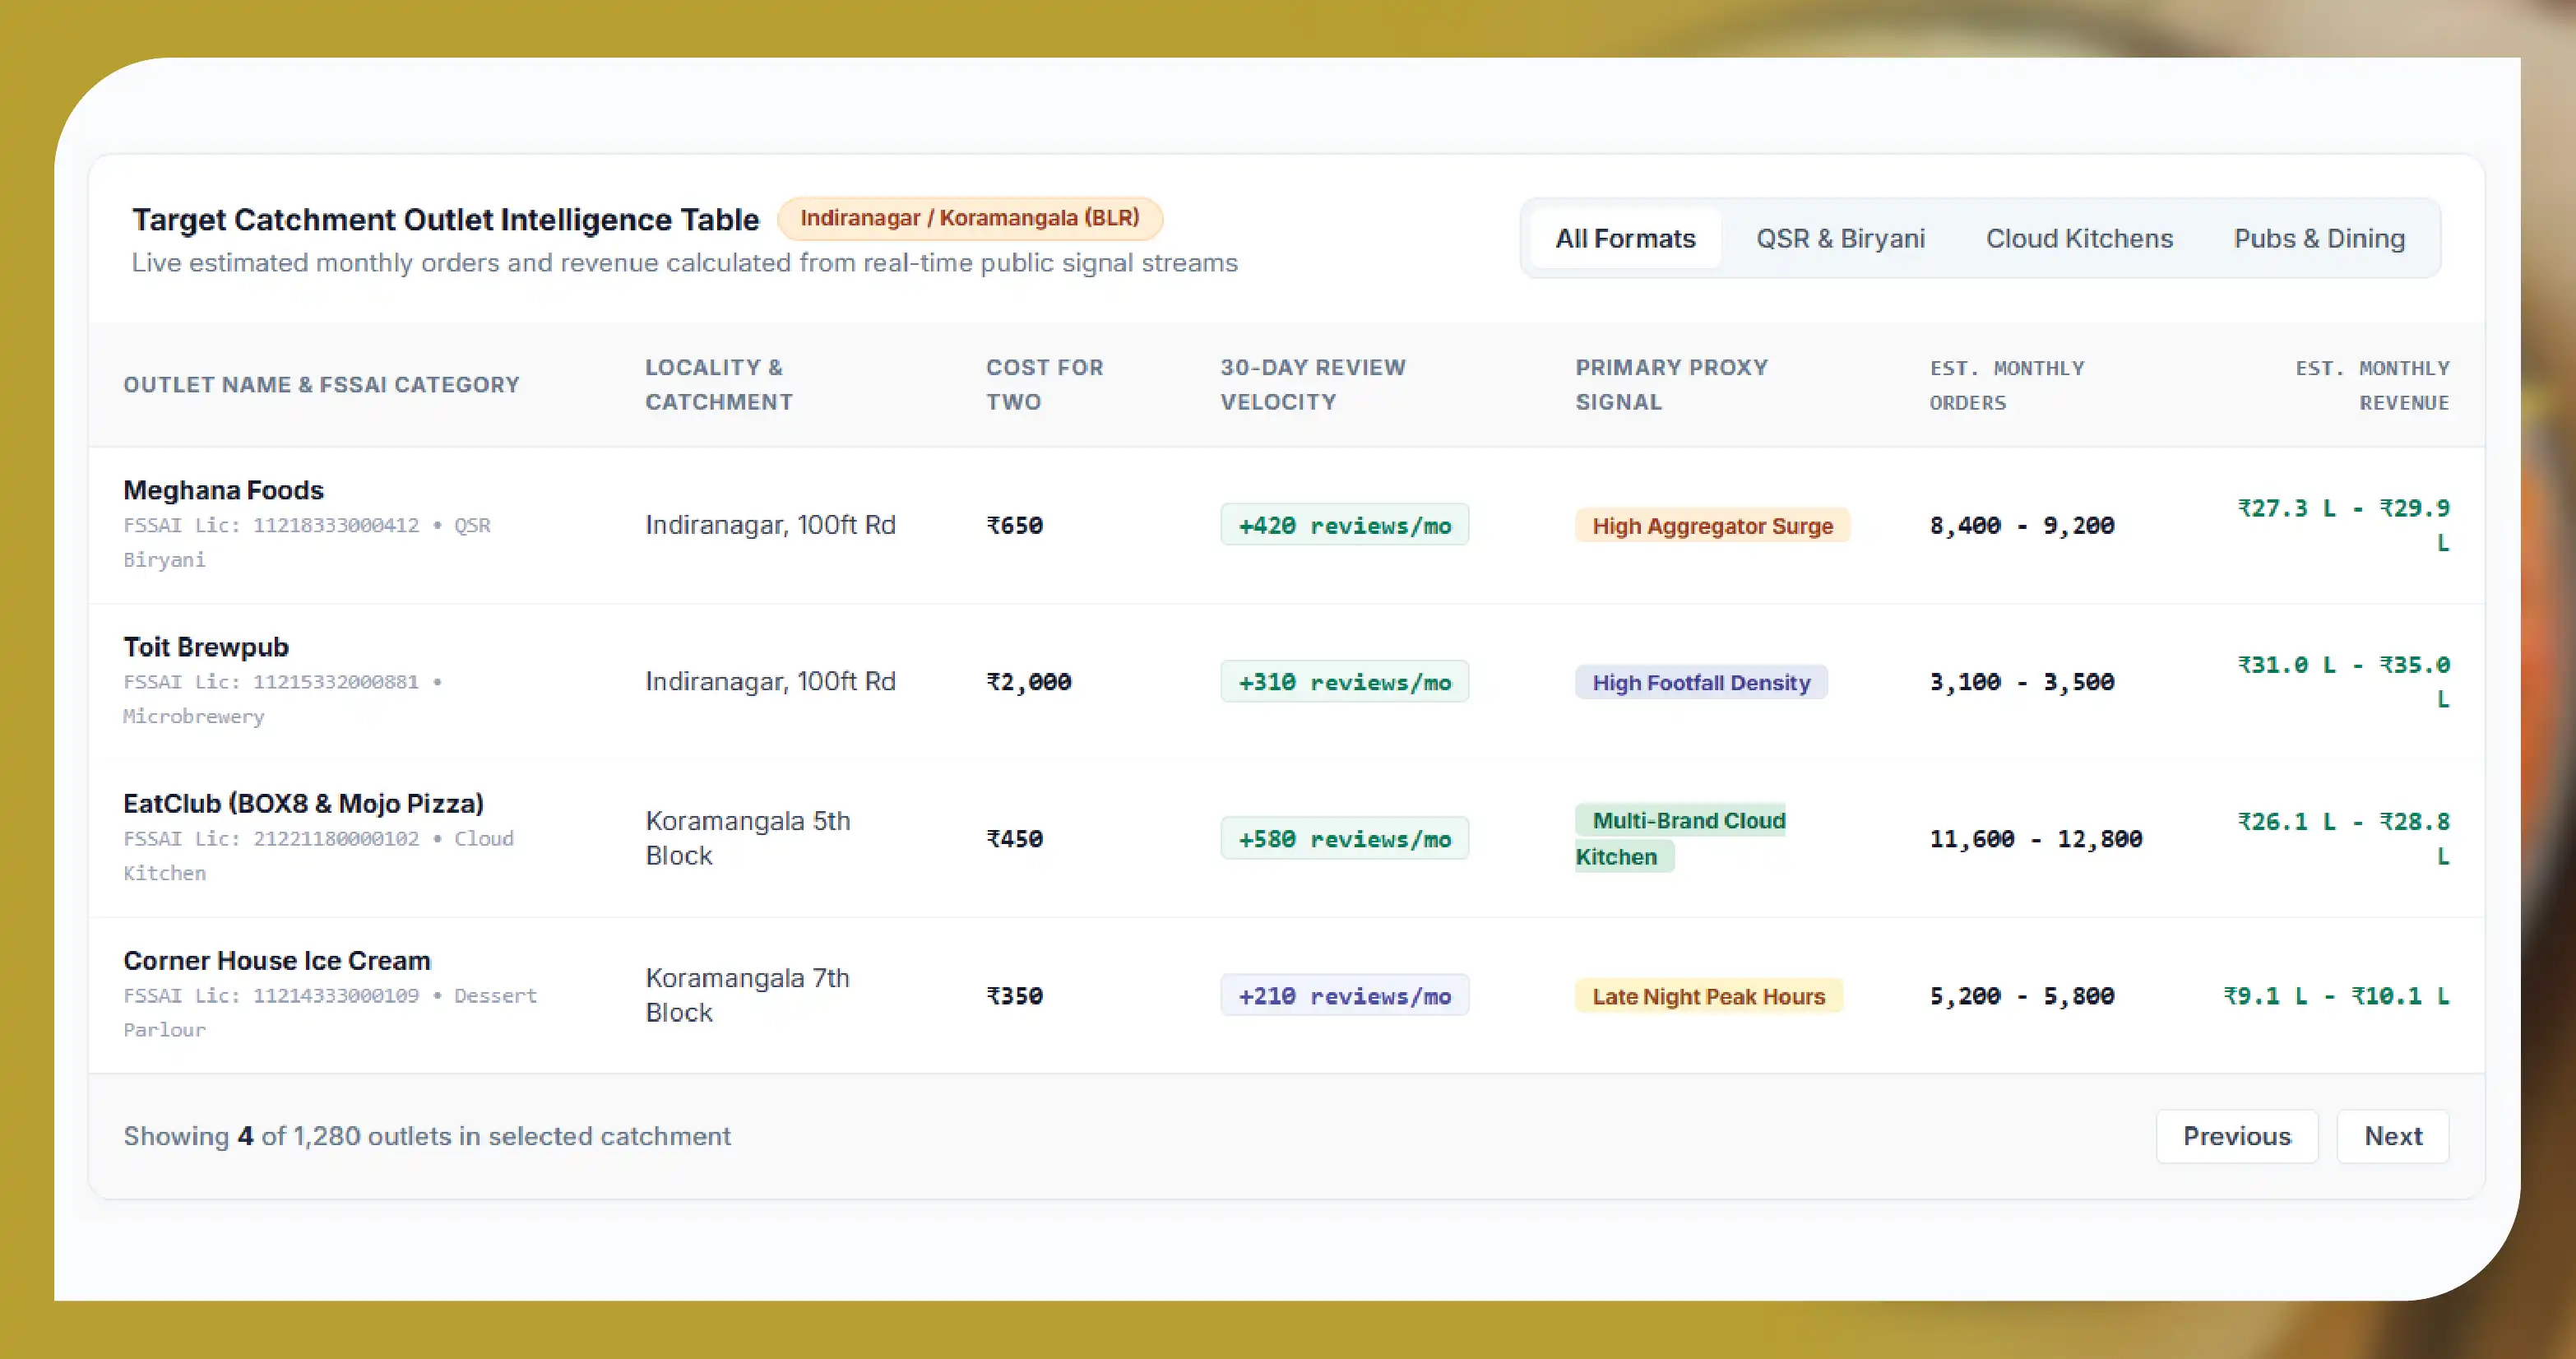
A proxy view of restaurant sales data India-wide only works if the data is clean and comparable across platforms. A typical workflow looks like this:
- Define the area. Pick cities, pin codes or localities, and the cuisines or brands in scope.
- Collect public listing data. Capture outlet, menu, rating, availability and delivery fields from public pages at a polite rate.
- Match outlets across platforms. Join Swiggy, Zomato and Google Maps records using name, address and coordinates, with manual checks for chains.
- Snapshot on a schedule. Weekly snapshots turn static counts into velocity signals.
- Build the index. Normalise each signal within a locality and combine them with weights you can explain.
- Label everything. Every derived field is marked as a proxy or estimate in the delivered file.
Use cases for public restaurant signals
- Expansion planning. QSR and casual-dining chains rank localities by outlet density, cuisine gaps and rating momentum.
- Cloud kitchen scouting. Operators look for localities with long delivery ETAs and thin menus in a target cuisine.
- Competitive benchmarking. Brands compare their menu prices, offers and rating growth with nearby competitors.
- Investor and lender research. Analysts check whether a brand's public footprint is growing before deeper diligence.
- FMCG and supplier targeting. Suppliers size locality demand for a category using outlet counts and menu mix.
In October 2026 we received repeated requests for locality-level order and sales figures through our India restaurant database page. In each case we explained that order volumes are not public and offered the proxy approach above instead.
Legal and compliance basics
Food Data Scrape works only with publicly available business data. That rules out anything behind a login, including restaurant partner dashboards.
- Public data only. No partner panels, no customer accounts, no paywalled pages.
- Respect site rules. Collection follows robots.txt, each platform's terms of service and sensible rate limits.
- No personal data. Reviewer names, phone numbers and customer details are excluded. Listings stay at business level.
- No order or POS integration. We do not offer Swiggy or Zomato order-API, live-order, inventory-sync or POS integration. Restaurants that need this should use each platform's official partner programme.
- Clear labelling. Proxies and estimates are never presented as sales figures.
Build vs buy: choosing a provider
Most teams asking for restaurant sales data India coverage start with one city. You can build a small proxy tracker in-house for that. It becomes harder at scale, when outlet matching, weekly snapshots and platform layout changes start to eat analyst time.
| Factor | Build in-house | Use a data provider |
|---|---|---|
| Setup time | Weeks of engineering | Scoped sample first, then a feed |
| Cross-platform matching | Manual and error-prone | Matched IDs delivered |
| Refresh | Depends on your team | Scheduled feed (cadence agreed per project) |
| Coverage | One or two cities | City, state or pan-India, agreed when we scope the project |
| Honesty about limits | Up to you | Proxies labelled; no order or sales data offered |
When you assess any provider, ask three questions. Where does each field come from? Is anything collected from behind a login? Which fields are measured and which are modelled? If a vendor promises outlet-level order counts from Swiggy or Zomato, treat that as a warning sign.
Get a free sample dataset. Tell us the cities, localities and cuisines you care about. Instead of restaurant sales data India platforms keep private, we will scope a sample of public listing fields and labelled proxy signals, so you can test the approach before committing. Contact sales to request your sample. Coverage and turnaround are confirmed when we scope your request.
Questions
Frequently Asked Questions
No. Outlet-level orders and sales on Swiggy and Zomato are visible only to the restaurant in its partner dashboard. Public sources give platform totals, such as quarterly GOV in shareholder letters, and industry estimates from bodies such as NRAI.
No. We do not provide order or sales data, and we do not offer order-API or POS integration with Swiggy or Zomato. We provide public listing data and clearly labelled proxy signals.
Only as a relative signal. Rating counts rise with orders over time, but the share of customers who rate is unknown. Use changes in rating count to compare outlets or localities, not to calculate sales.
No single signal works alone. A combined index of rating velocity, outlet density, bestseller share, open hours and delivery ETA, tracked weekly, gives a more stable view than any one field.
Use primary sources: Swiggy and Eternal shareholder letters and exchange filings for platform totals, and NRAI's India Food Services Report for industry size. Always cite the period and the source.
Weekly snapshots are a sensible starting point for velocity signals. The right cadence depends on your use case and is agreed per project.
Get a Free Food Data Sample in 48 Hours.
Tell us your platforms, target markets and required fields — we'll map exactly what's possible with food data scraping, recommend the right approach, and send a working sample so you can verify quality before any commitment.
Request a strategy call
Thanks — our data team will reach out within 48 hours with your sample.