The Client
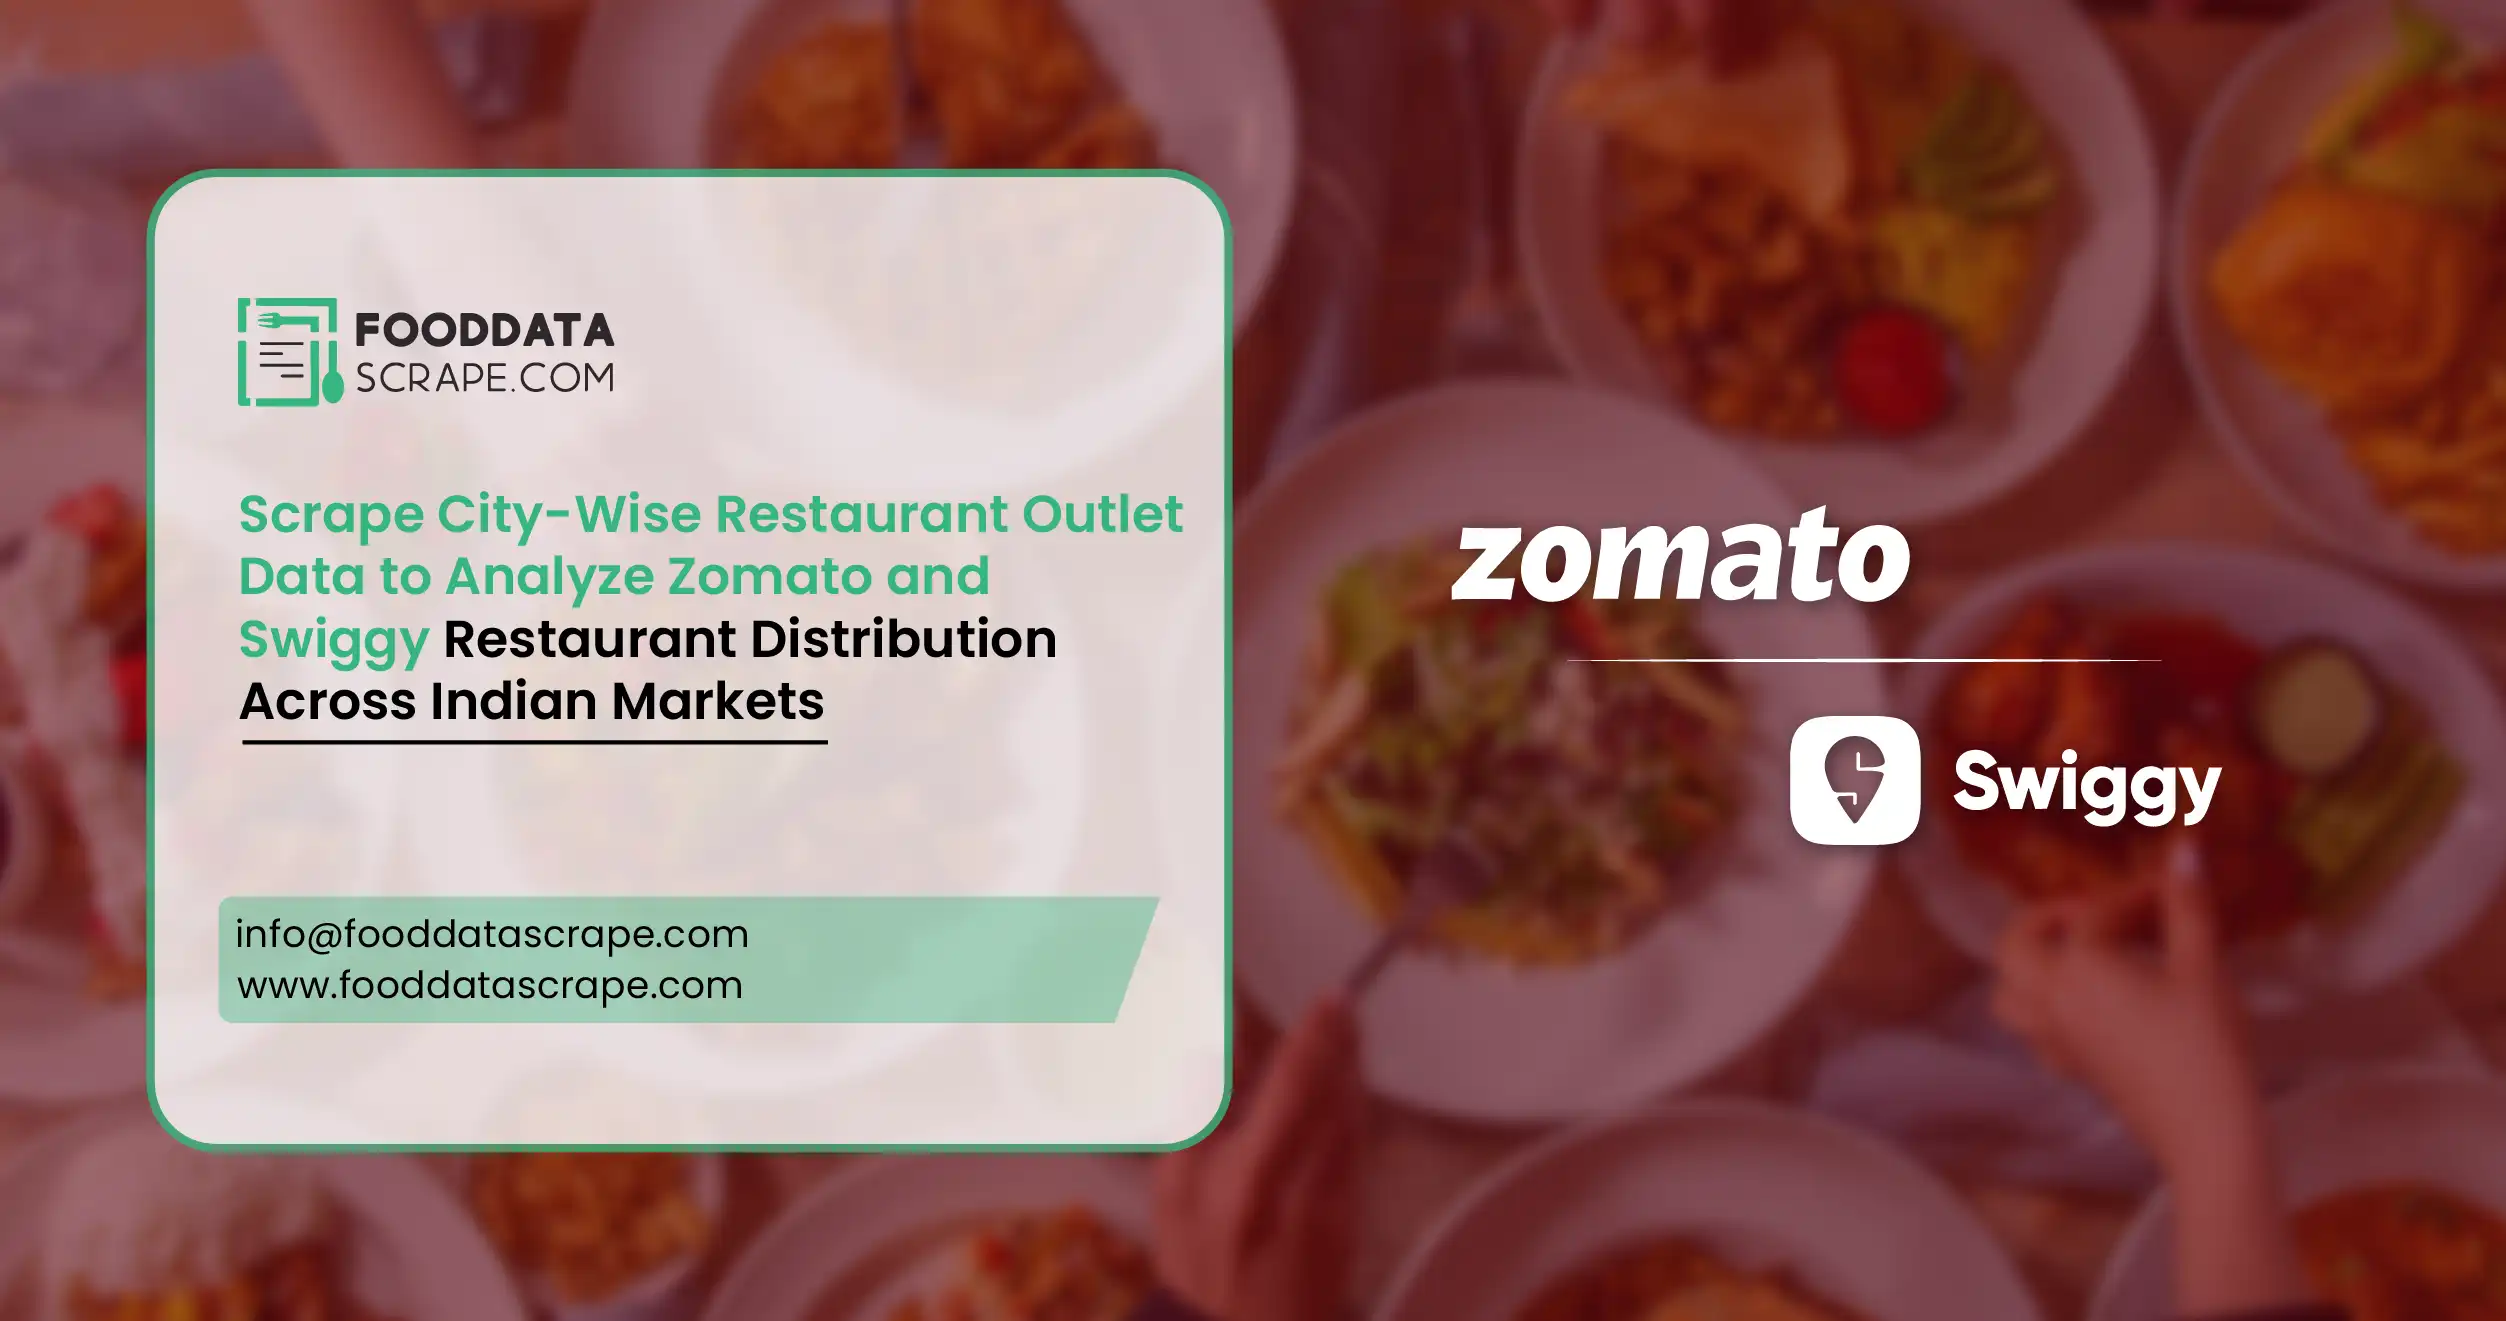
The client was a food industry research and business intelligence company seeking to strengthen its understanding of India's restaurant ecosystem. Its stakeholders required a consolidated view of restaurant outlets across major metropolitan areas, emerging urban centers, and developing food delivery markets. Existing information was distributed across multiple digital platforms, making it difficult to maintain consistent records and conduct city-level comparisons efficiently.
The client needed Zomato & Swiggy Restaurant Data Scraping to establish a systematic process for collecting restaurant information from different sources. It also wanted City-Wise Restaurant Market Intelligence to evaluate market saturation, identify underserved locations, and compare restaurant availability across cities. In addition, Google Maps Restaurant Data Scraping was considered valuable for supplementing location-related information and supporting geographic analysis where permitted.
The intended users included restaurant consultants, food delivery businesses, market analysts, and expansion teams. The client wanted a scalable dataset that could support location research, competitive assessments, restaurant discovery, and business reporting. Food Data Scrape was engaged to design a structured data collection and processing workflow aligned with these objectives.
Key Challenges
-
Inconsistent City-Level Ratings
City-Level Restaurant Ratings Data Extraction presented challenges because ratings, review counts, restaurant names, and categories could vary across platforms. Inconsistent formats and duplicate listings made comparisons difficult, requiring careful standardization, source identification, and validation before the client could use the information for reliable city-level analysis. -
Platform-Specific Data Collection
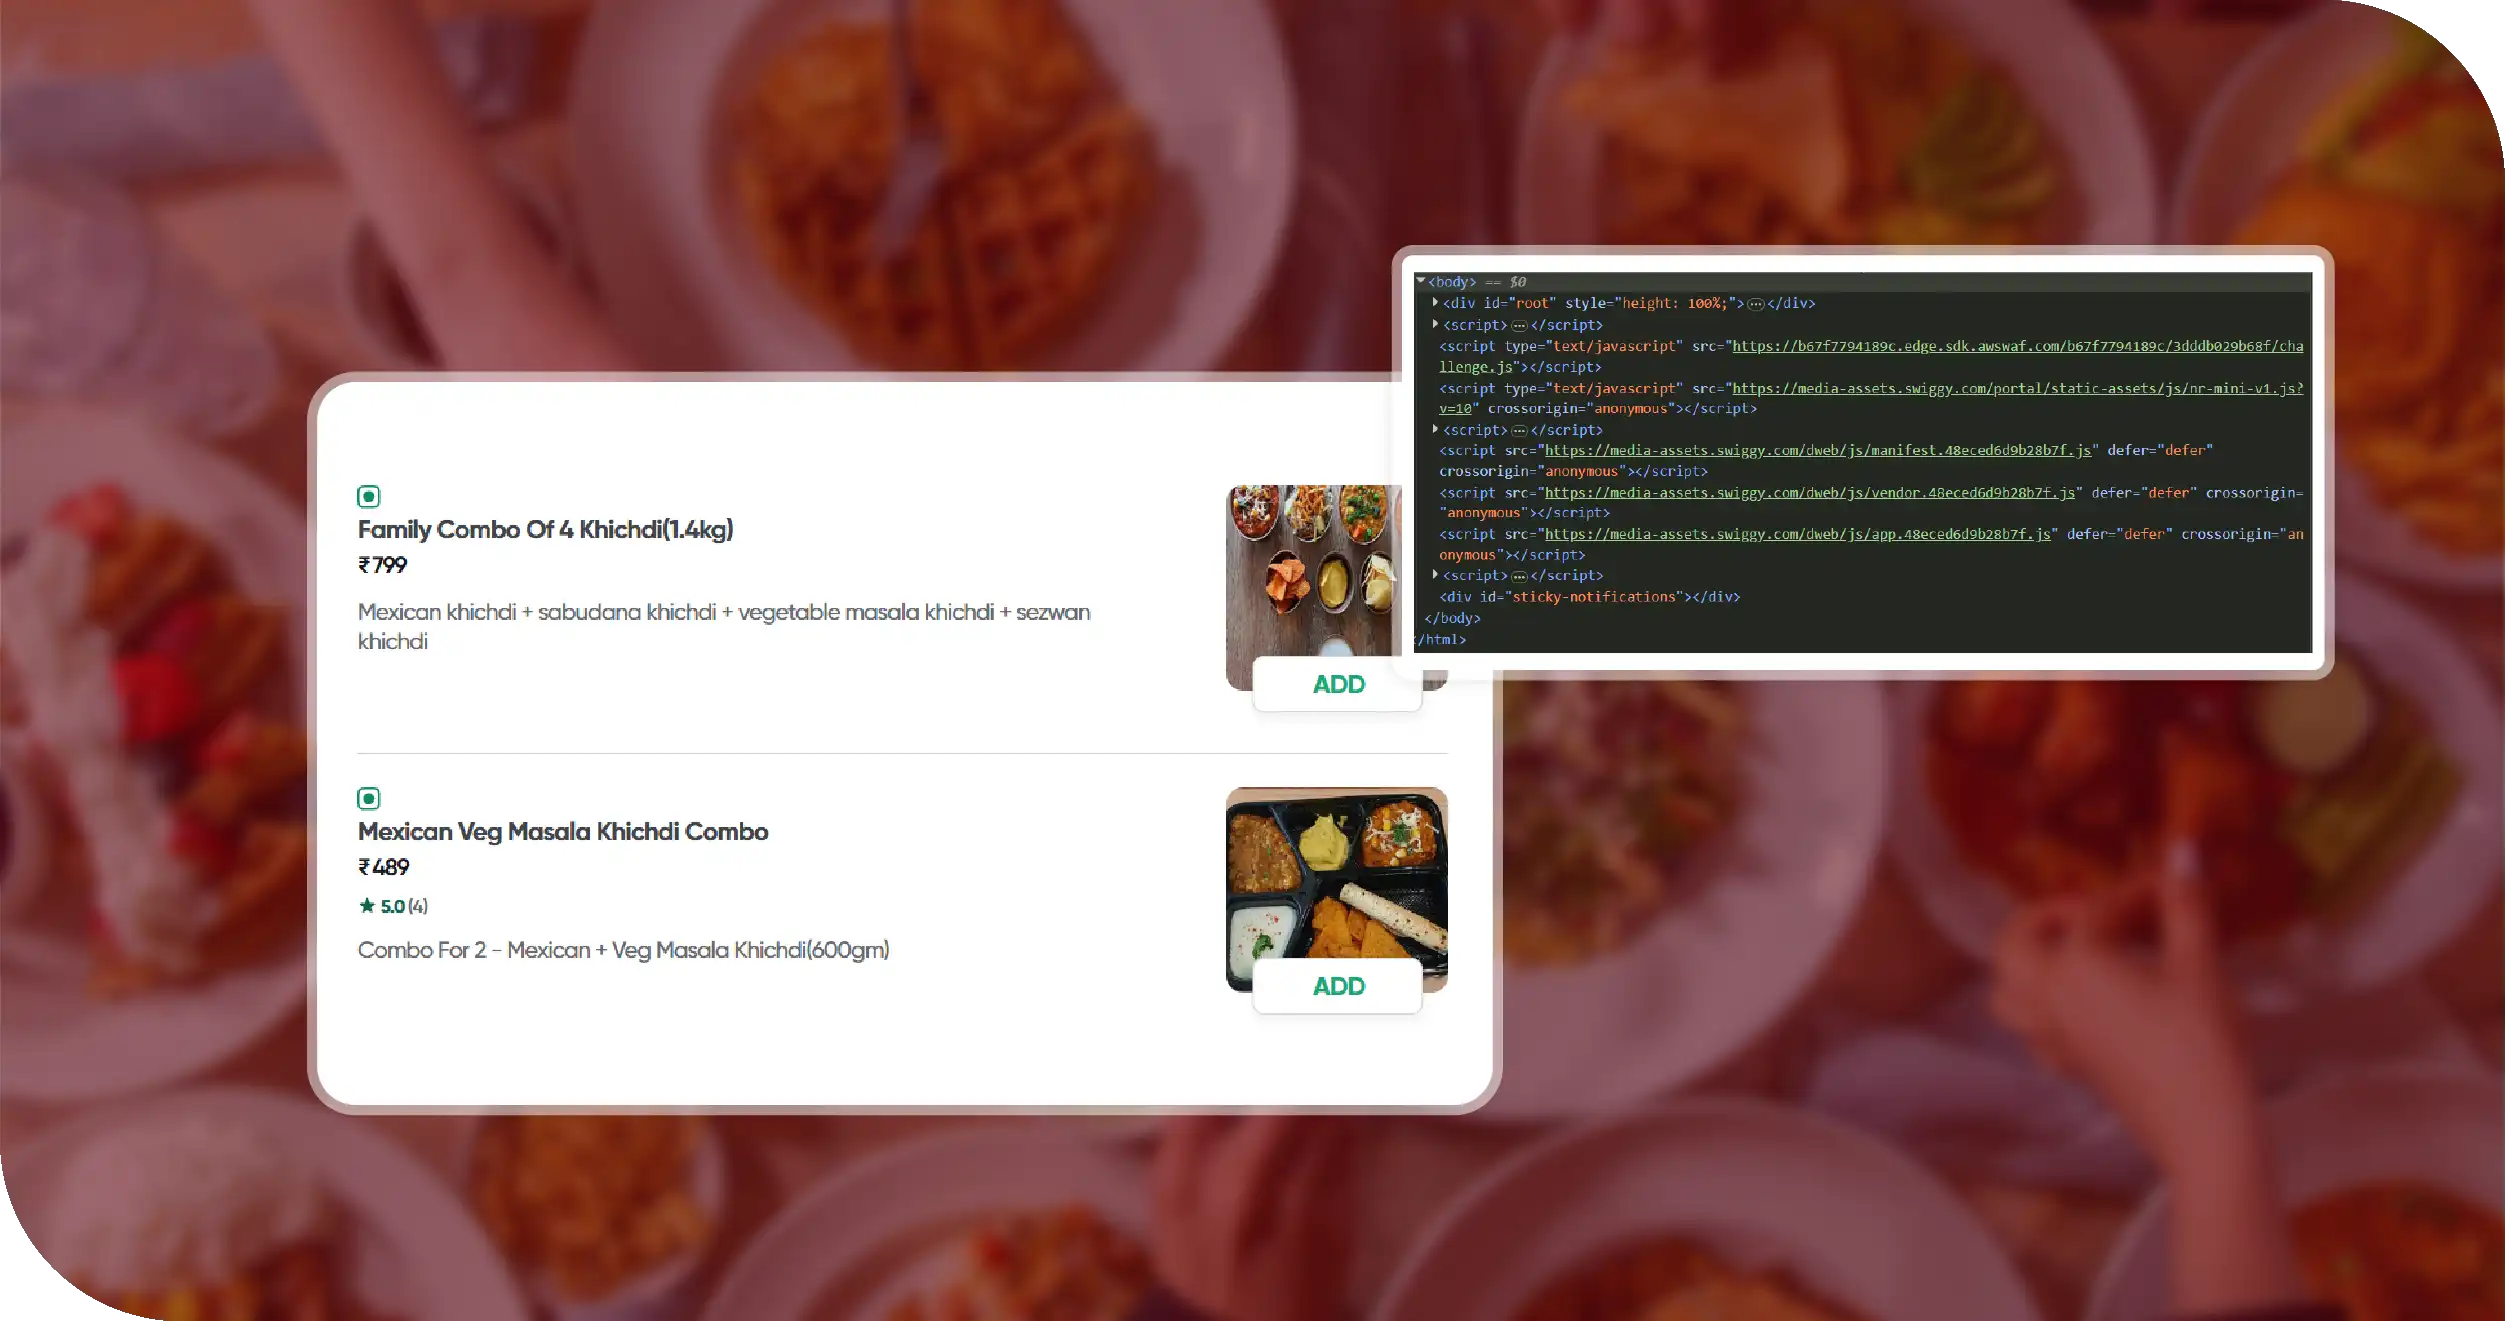
The client needed a scalable approach comparable to a Zomato Food Delivery Scraping API workflow for collecting restaurant listings and associated attributes. Platform-specific layouts, pagination, access restrictions, and changing information structures complicated collection, making source-aware extraction and regular maintenance essential for consistent results. -
Combining Restaurant Records Across Platforms
A workflow inspired by a Swiggy Food Delivery Scraping API also needed to accommodate differences in listing structures and available fields. Matching restaurants across platforms was challenging because names, addresses, categories, and operating details could differ, increasing the risk of duplicate records and inaccurate outlet counts.
Key Solutions
-
Structured Restaurant Database Development
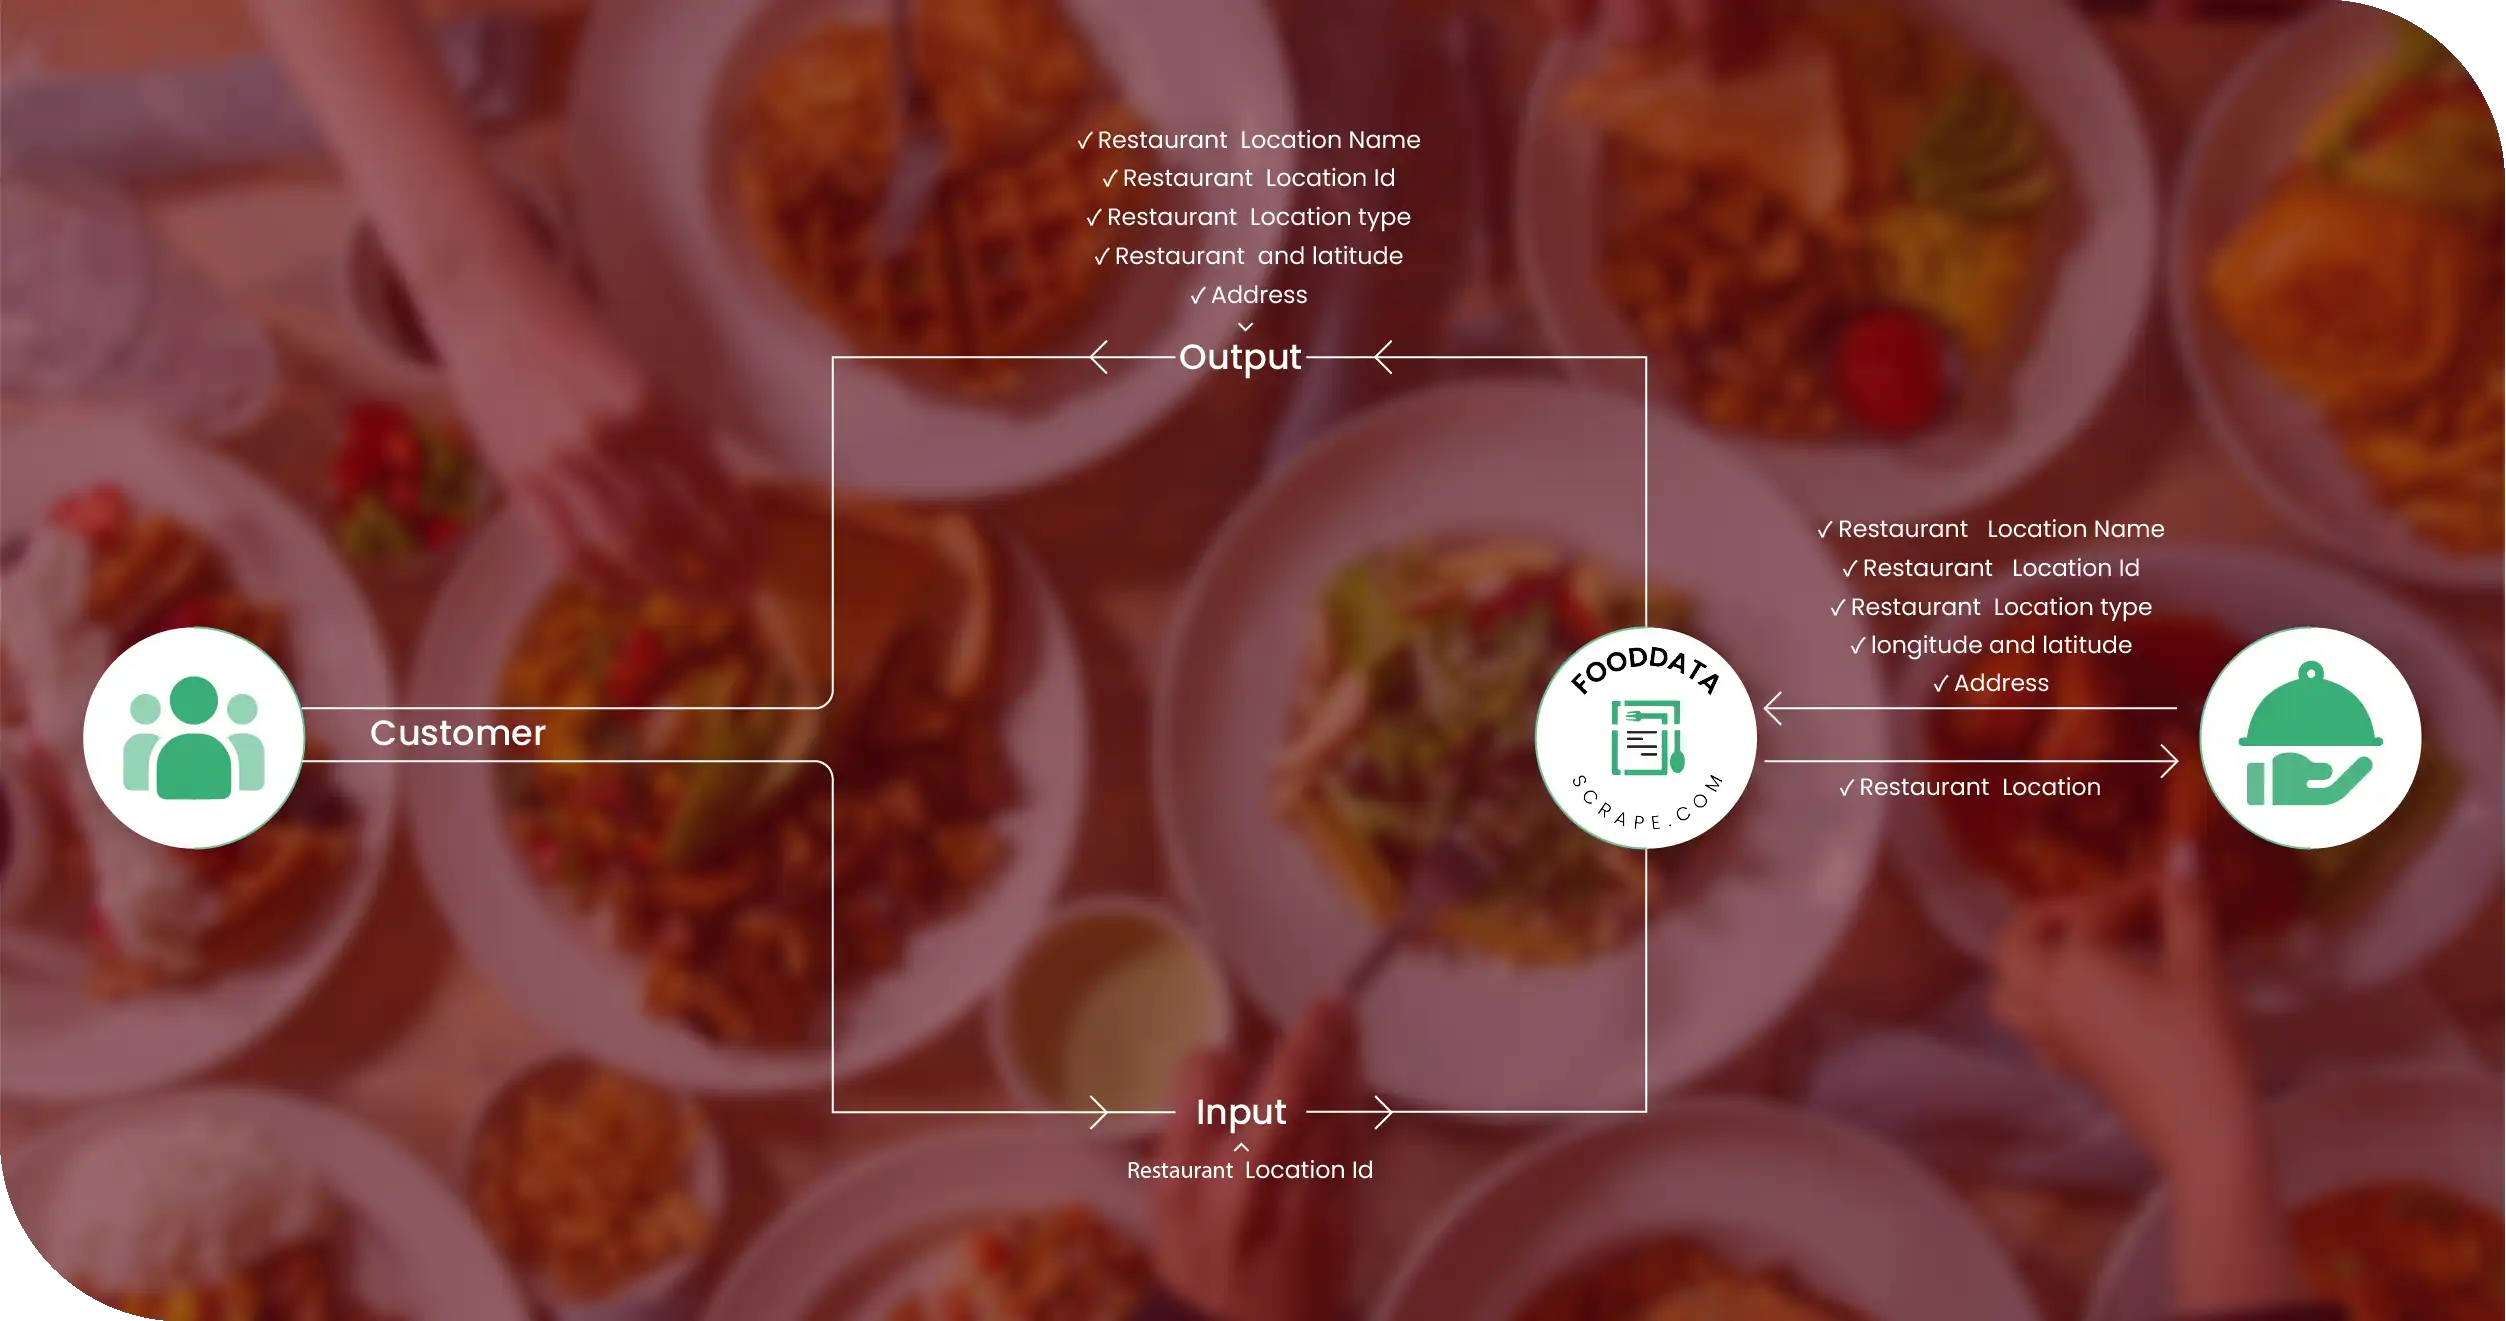
Food Data Scrape designed a standardized India Restaurant Database framework that organized restaurant names, locations, categories, ratings, and platform references into consistent records. The structure supported city-level filtering, comparison, and reporting, giving the client a practical foundation for restaurant market research and geographic expansion analysis. -
Ratings and Review Intelligence
Our team implemented a workflow to Scrape Restaurant Reviews And Rating Data from accessible sources, subject to applicable platform terms and permissions. The process standardized available rating values, review counts, and related fields, helping the client compare restaurant performance indicators and identify differences across locations and digital platforms. -
Scalable Collection and Data Processing
Through Food Data Scraping in India, we developed a repeatable process for collecting permitted restaurant information, validating records, resolving duplicates, and preparing structured outputs. This approach reduced manual consolidation, improved consistency, and enabled the client to maintain datasets that could be refreshed as new information became available.
Detailed Data Intelligence Table
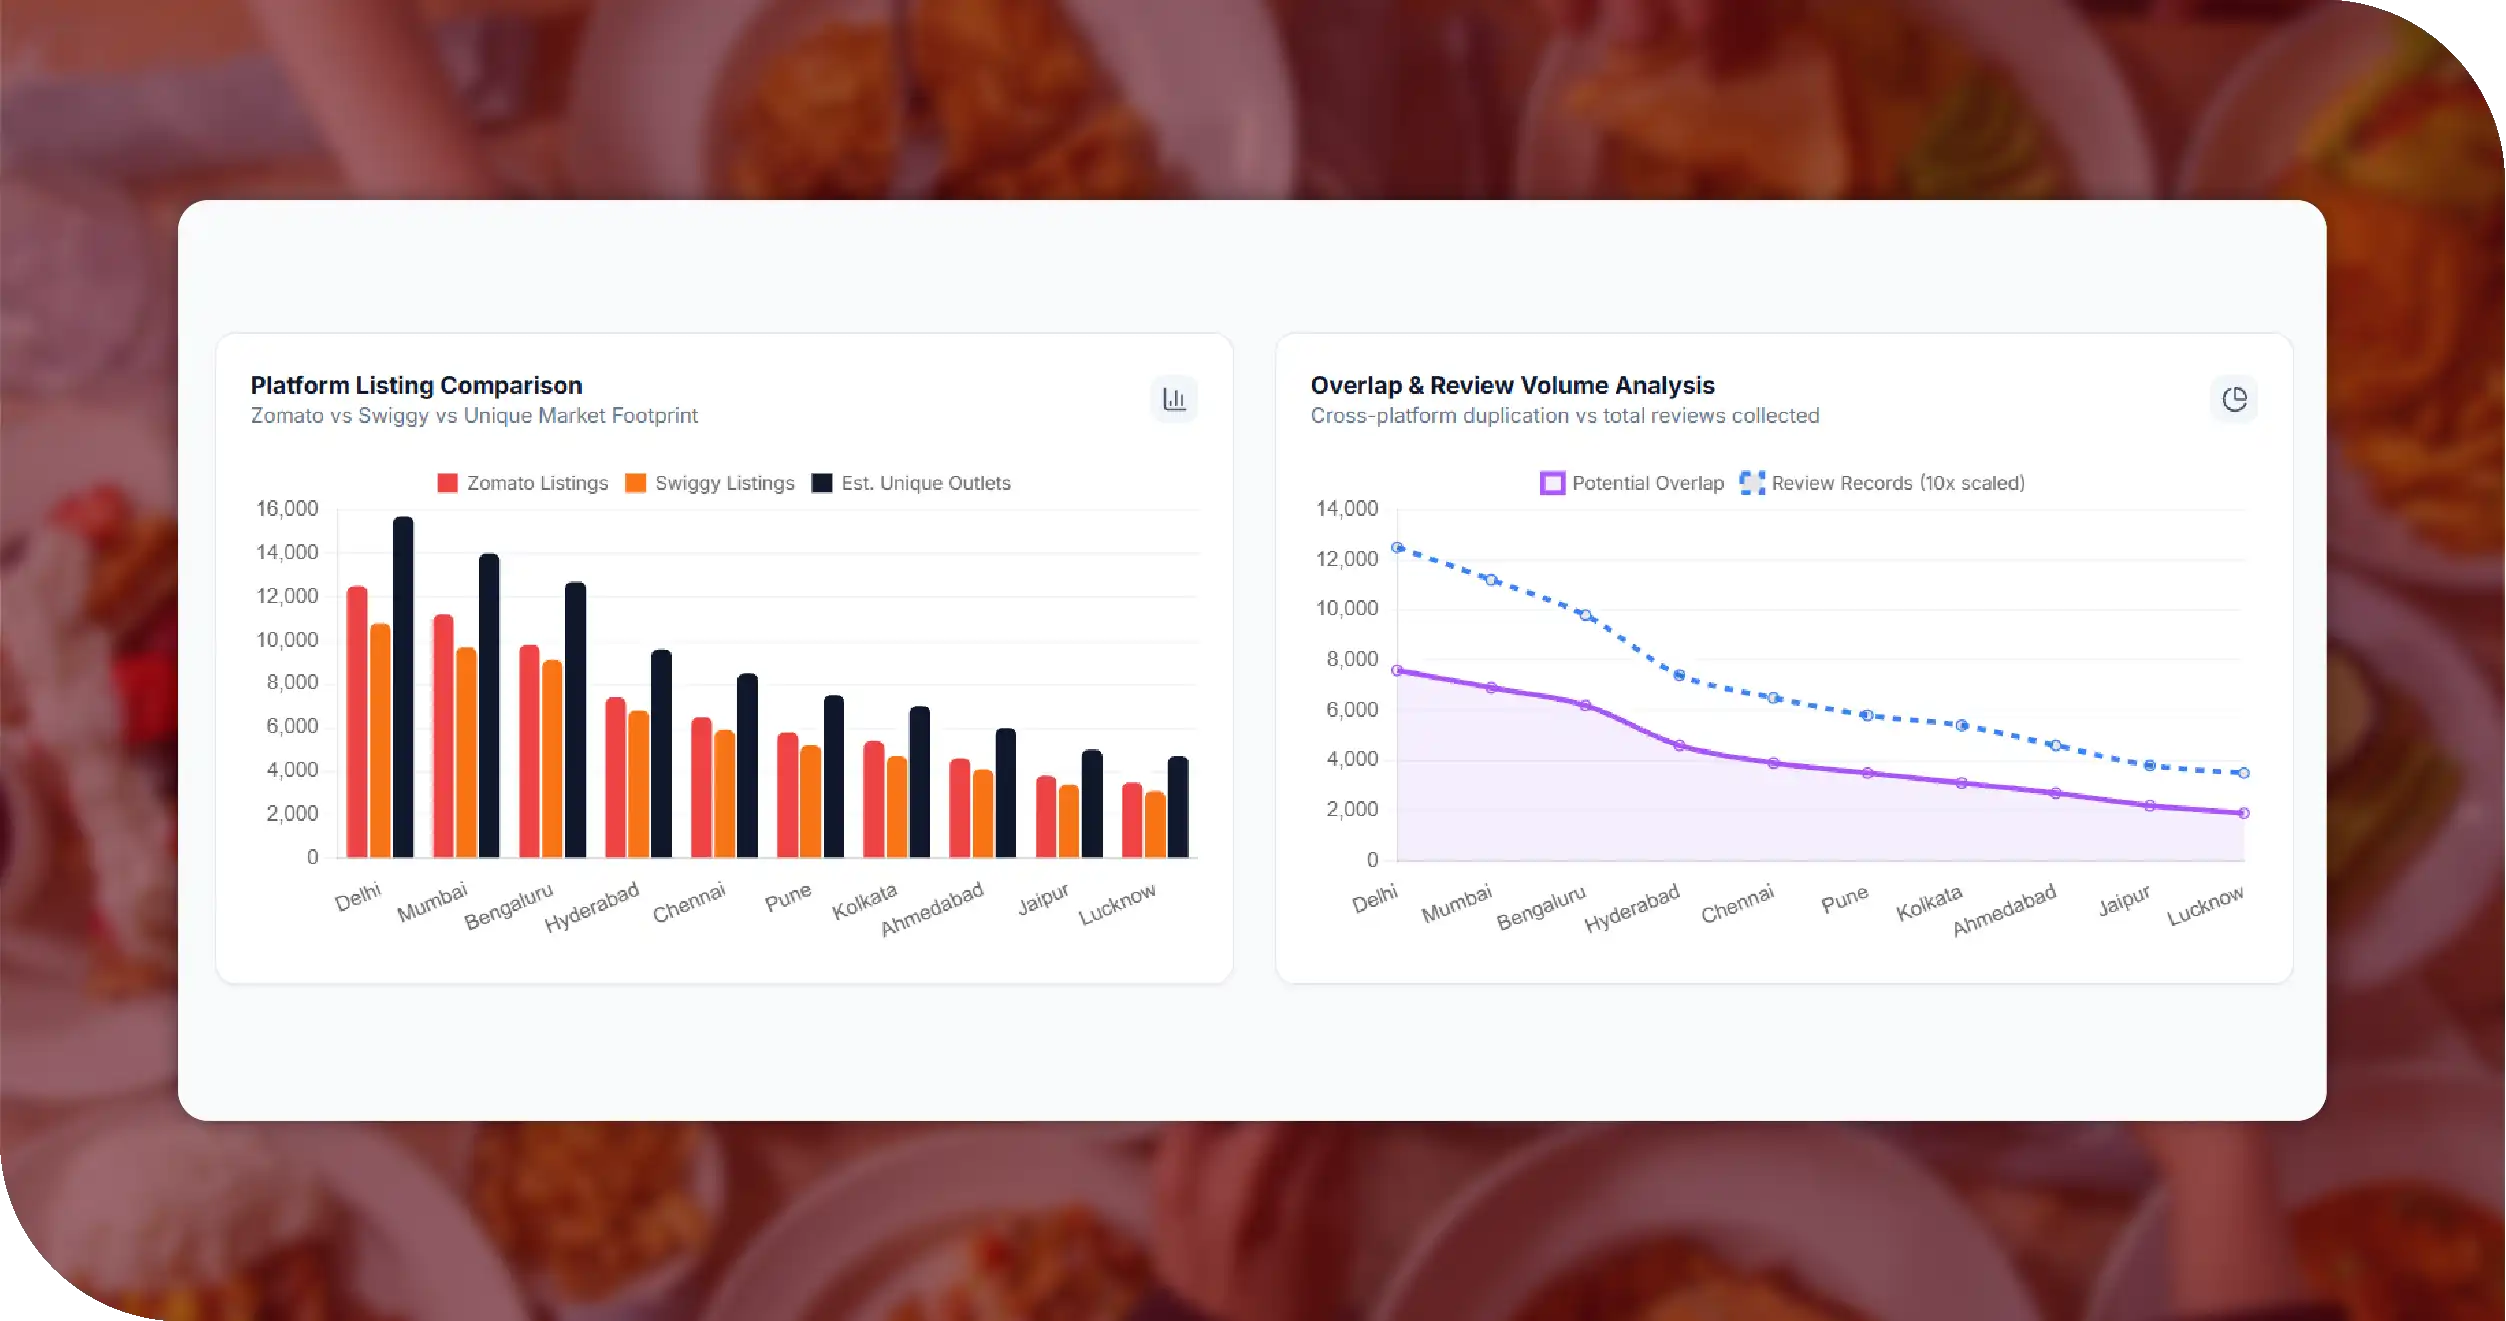
The following table illustrates the proposed dataset structure and example analytical outputs. All figures are illustrative planning values, not verified production results or actual client measurements.
| City | Zomato Listings | Swiggy Listings | Potential Overlap | Estimated Unique Outlets | Average Rating (Illustrative) | Review Records | Data Completeness |
|---|---|---|---|---|---|---|---|
| Delhi | 12,500 | 10,800 | 7,600 | 15,700 | 4.1 | 125,000 | 96% |
| Mumbai | 11,200 | 9,700 | 6,900 | 14,000 | 4.2 | 112,000 | 95% |
| Bengaluru | 9,800 | 9,100 | 6,200 | 12,700 | 4.2 | 98,000 | 96% |
| Hyderabad | 7,400 | 6,800 | 4,600 | 9,600 | 4.1 | 74,000 | 94% |
| Chennai | 6,500 | 5,900 | 3,900 | 8,500 | 4.0 | 65,000 | 94% |
| Pune | 5,800 | 5,200 | 3,500 | 7,500 | 4.1 | 58,000 | 95% |
| Kolkata | 5,400 | 4,700 | 3,100 | 7,000 | 4.0 | 54,000 | 93% |
| Ahmedabad | 4,600 | 4,100 | 2,700 | 6,000 | 4.0 | 46,000 | 93% |
| Jaipur | 3,800 | 3,400 | 2,200 | 5,000 | 4.0 | 38,000 | 92% |
| Lucknow | 3,500 | 3,100 | 1,900 | 4,700 | 3.9 | 35,000 | 92% |
| Total | 70,500 | 62,800 | 42,600 | 90,700 | 4.1 | 705,000 | 94% |
The table demonstrates how city-level records can be structured to compare platform coverage and estimate potential restaurant market size. In a live engagement, matching rules, collection dates, geographic definitions, and data-quality checks would be documented to ensure transparent and reproducible reporting.
Methodologies We Used
-
Source Identification and Assessment
We identified relevant restaurant information sources and evaluated their suitability, coverage, and permitted access methods. The assessment established which fields were available, how listings were organized, and which collection techniques could support the client's geographic and competitive research requirements. -
Standardized Data Extraction
We designed structured extraction workflows for accessible restaurant listings, capturing available names, addresses, categories, ratings, and platform identifiers. Consistent field mapping enabled information from different sources to be consolidated into a common schema, making subsequent comparisons easier and reducing formatting inconsistencies. -
Data Cleaning and Normalization
Collected records underwent normalization to standardize city names, address formats, category labels, and numerical fields. We identified incomplete entries, inconsistent values, and potential duplicates, applying documented rules to improve usability while preserving source references and avoiding unsupported assumptions about missing information. -
Cross-Platform Record Matching
We used matching criteria such as restaurant names, location details, and available identifiers to identify potential overlaps between platform listings. Ambiguous matches were flagged for additional review rather than automatically treated as identical, helping improve the reliability of outlet estimates and reduce double counting. -
Quality Assurance and Dataset Delivery
The final workflow incorporated completeness checks, duplicate analysis, field validation, and consistency reviews. Structured outputs were prepared for downstream analysis, with relevant metadata and collection dates where available. This methodology supported repeatable reporting and helped the client understand dataset limitations before making business decisions.
Advantages of Collecting Data Using Food Data Scrape
-
Better Market Expansion Decisions
Structured city-level restaurant data helps businesses compare market density, category distribution, and competitive presence before entering new locations. These insights can support expansion prioritization, site research, and investment discussions while reducing dependence on fragmented manual research and unverified assumptions. -
Improved Competitive Benchmarking
Consolidated restaurant listings and available ratings help analysts compare competitors across cities and food categories. Businesses can identify areas with strong competition, evaluate differences in online visibility, and develop more informed positioning strategies using consistent datasets rather than isolated platform searches. -
Reduced Manual Research Effort
Automated and repeatable collection workflows can reduce the time teams spend gathering, formatting, and combining restaurant information manually. Standardized outputs also make recurring analysis easier, allowing researchers to focus more on interpreting market trends and less on repetitive data preparation. -
More Consistent Reporting
Validated datasets create a consistent basis for comparing locations, categories, and platform coverage. Documented field definitions and quality checks help reduce discrepancies between reports, improve collaboration across research teams, and make findings easier to reproduce when the underlying data is refreshed. -
Scalable Restaurant Intelligence
A structured data pipeline can be extended to additional cities, restaurant categories, and permitted information sources as research requirements evolve. This flexibility helps businesses maintain a broader market view, monitor changes over time, and adapt their analysis without rebuilding the entire workflow for every new requirement.
Client's Testimonial
"Food Data Scrape helped us establish a more organized approach to restaurant market research across Indian cities. Previously, gathering information from multiple platforms required considerable manual effort, and comparing outlet coverage was difficult because records were inconsistent. The structured dataset and standardized fields made it easier for our team to assess restaurant distribution, review available ratings, and identify potential differences in platform coverage. We particularly valued the emphasis on data cleaning, duplicate identification, and consistent reporting. The resulting framework gave our analysts a more practical foundation for market comparisons and expansion research. The engagement also helped us understand the importance of documenting data sources and validation rules. Overall, the approach improved our research workflow and gave us a scalable starting point for future restaurant intelligence initiatives."
—Head of Market Research
Final Outcome
The project established a structured framework for analyzing restaurant listings across selected Indian cities and digital platforms. By consolidating available information into standardized records, the client gained a clearer way to compare outlet distribution, restaurant categories, ratings, and potential overlaps between platform listings. The data model also created a foundation for geographic market assessment, competitive benchmarking, and future expansion research.
The resulting workflow emphasized consistent field definitions, duplicate identification, validation, and documented source limitations. These measures helped make subsequent analysis more transparent and repeatable. The client could use the prepared dataset structure to support internal reporting, identify areas requiring additional research, and prioritize locations for deeper investigation.
The deliverable also demonstrated how Food Delivery Datasets can support restaurant intelligence when collected and interpreted responsibly. Actual improvements in coverage, accuracy, processing time, or business performance would need to be established through validated project measurements. Overall, the approach provided a scalable foundation for evidence-based restaurant market research.