

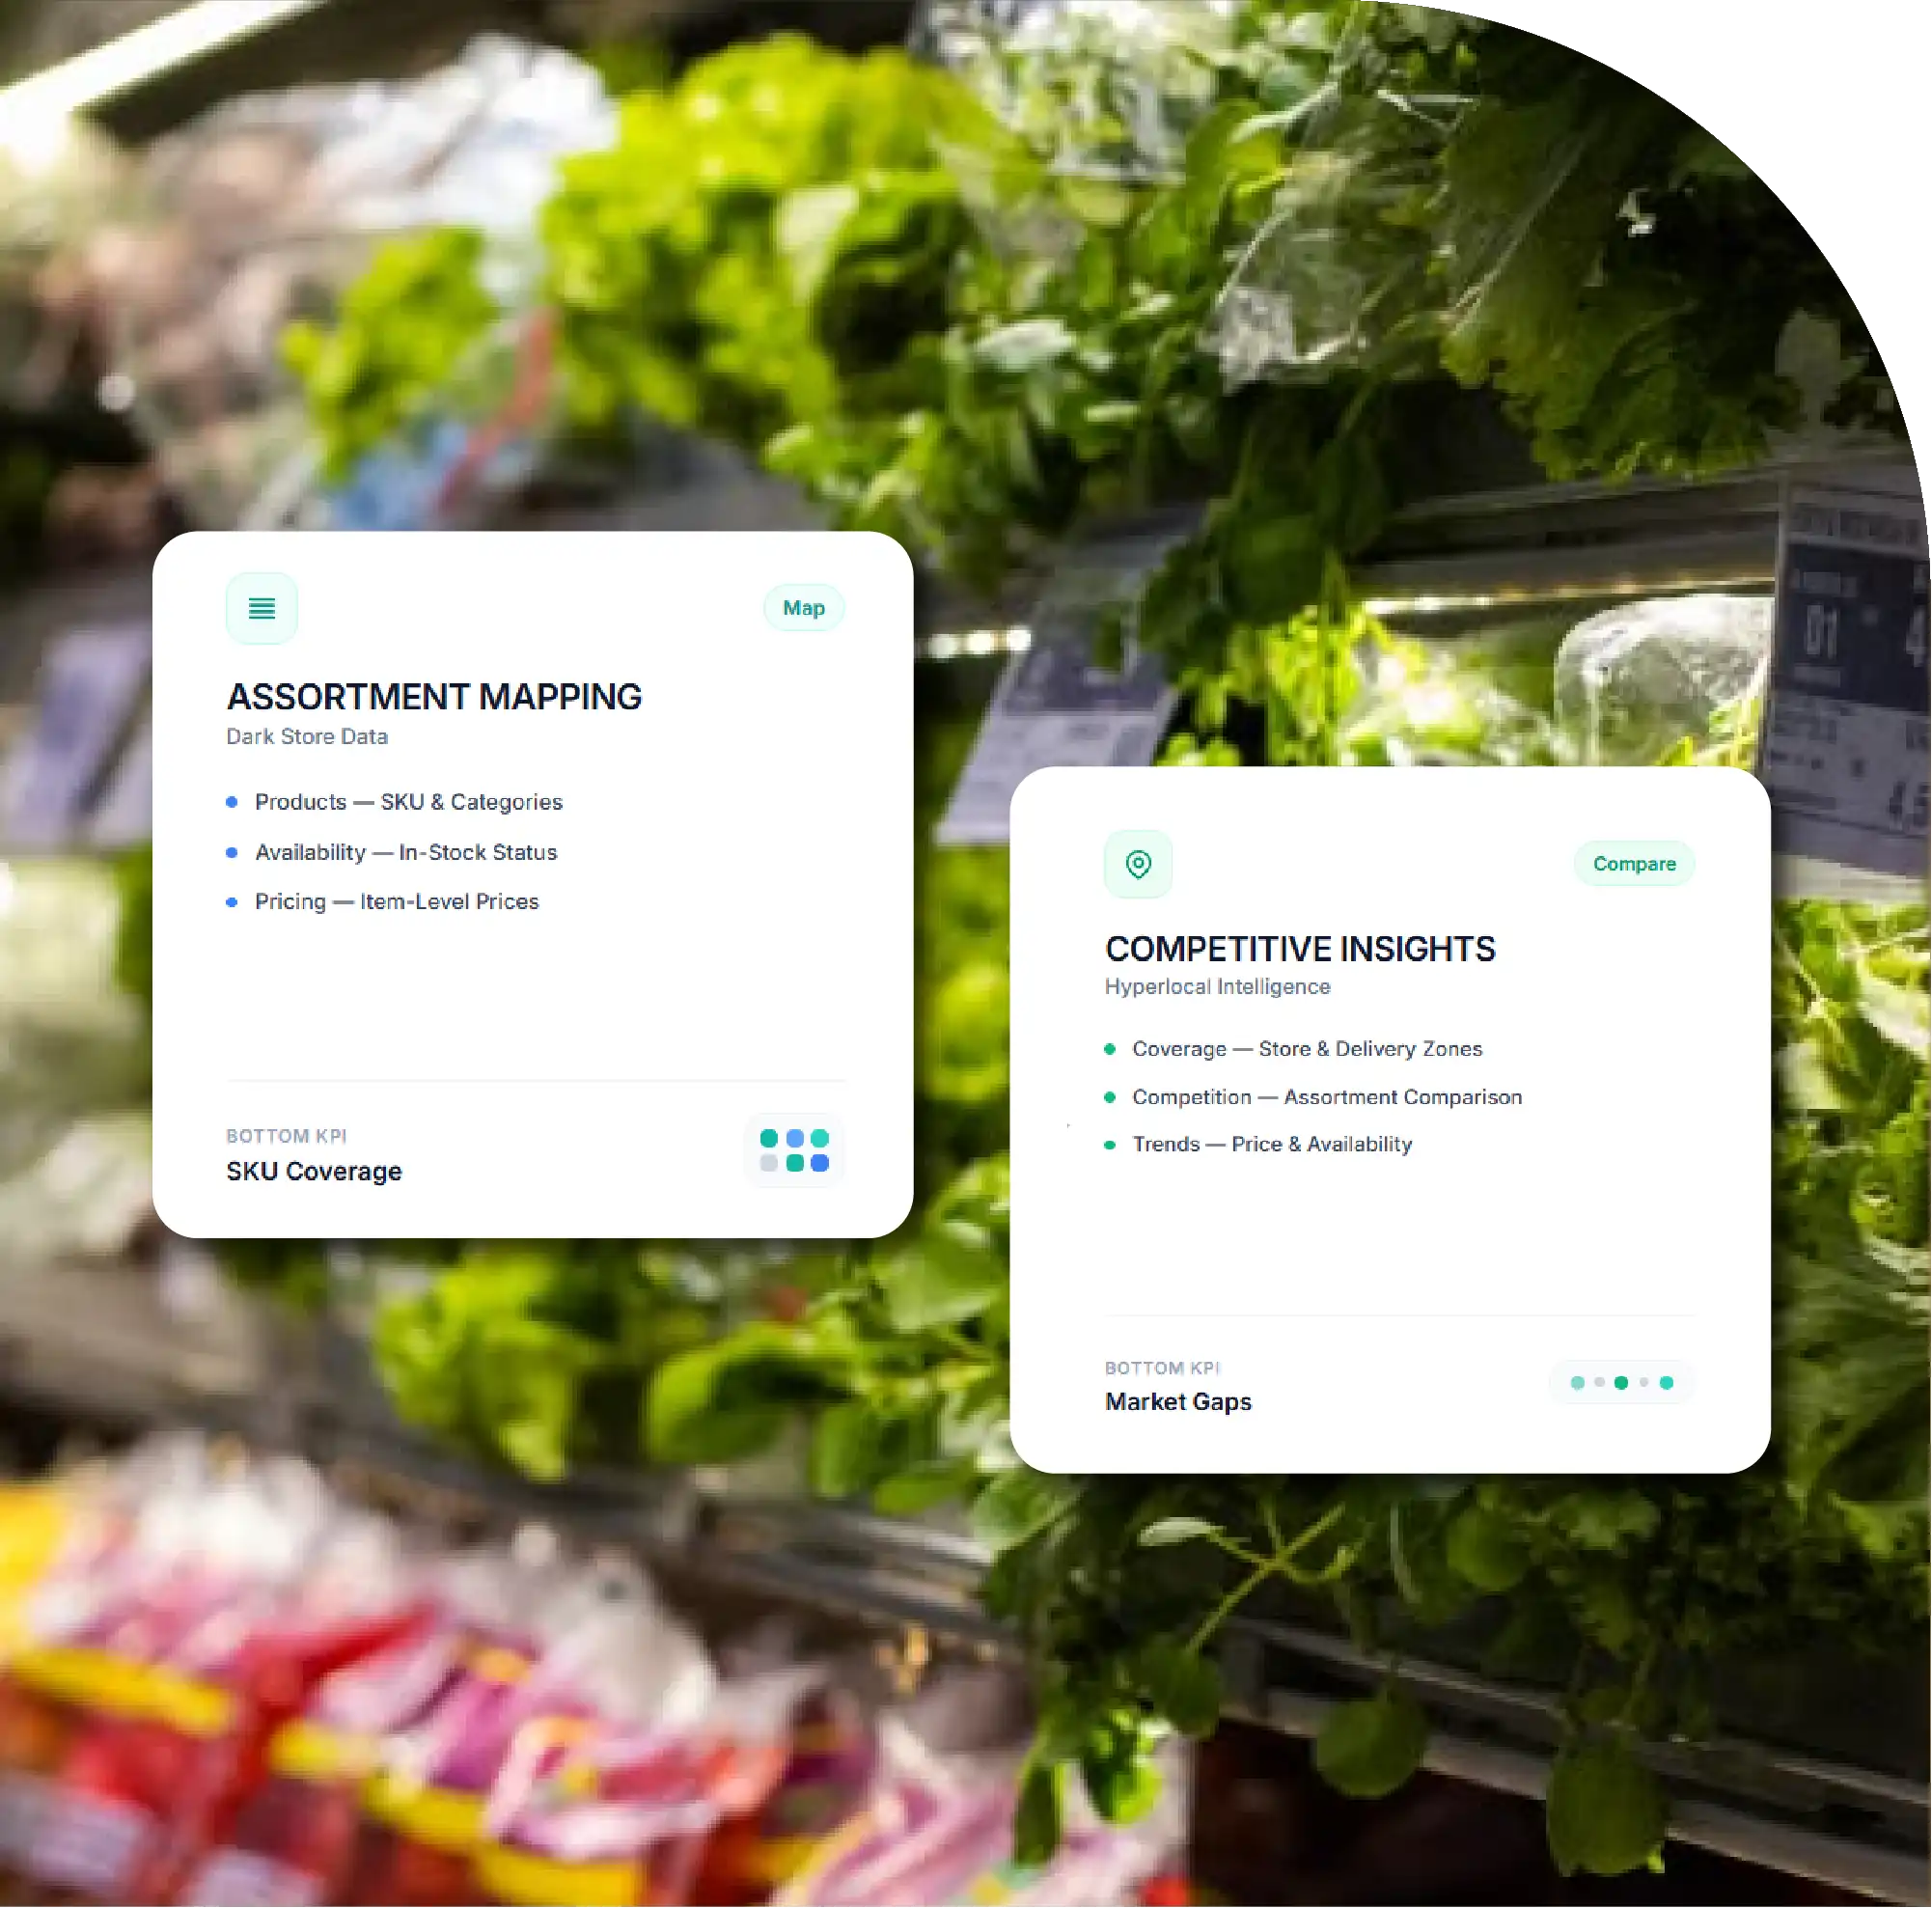
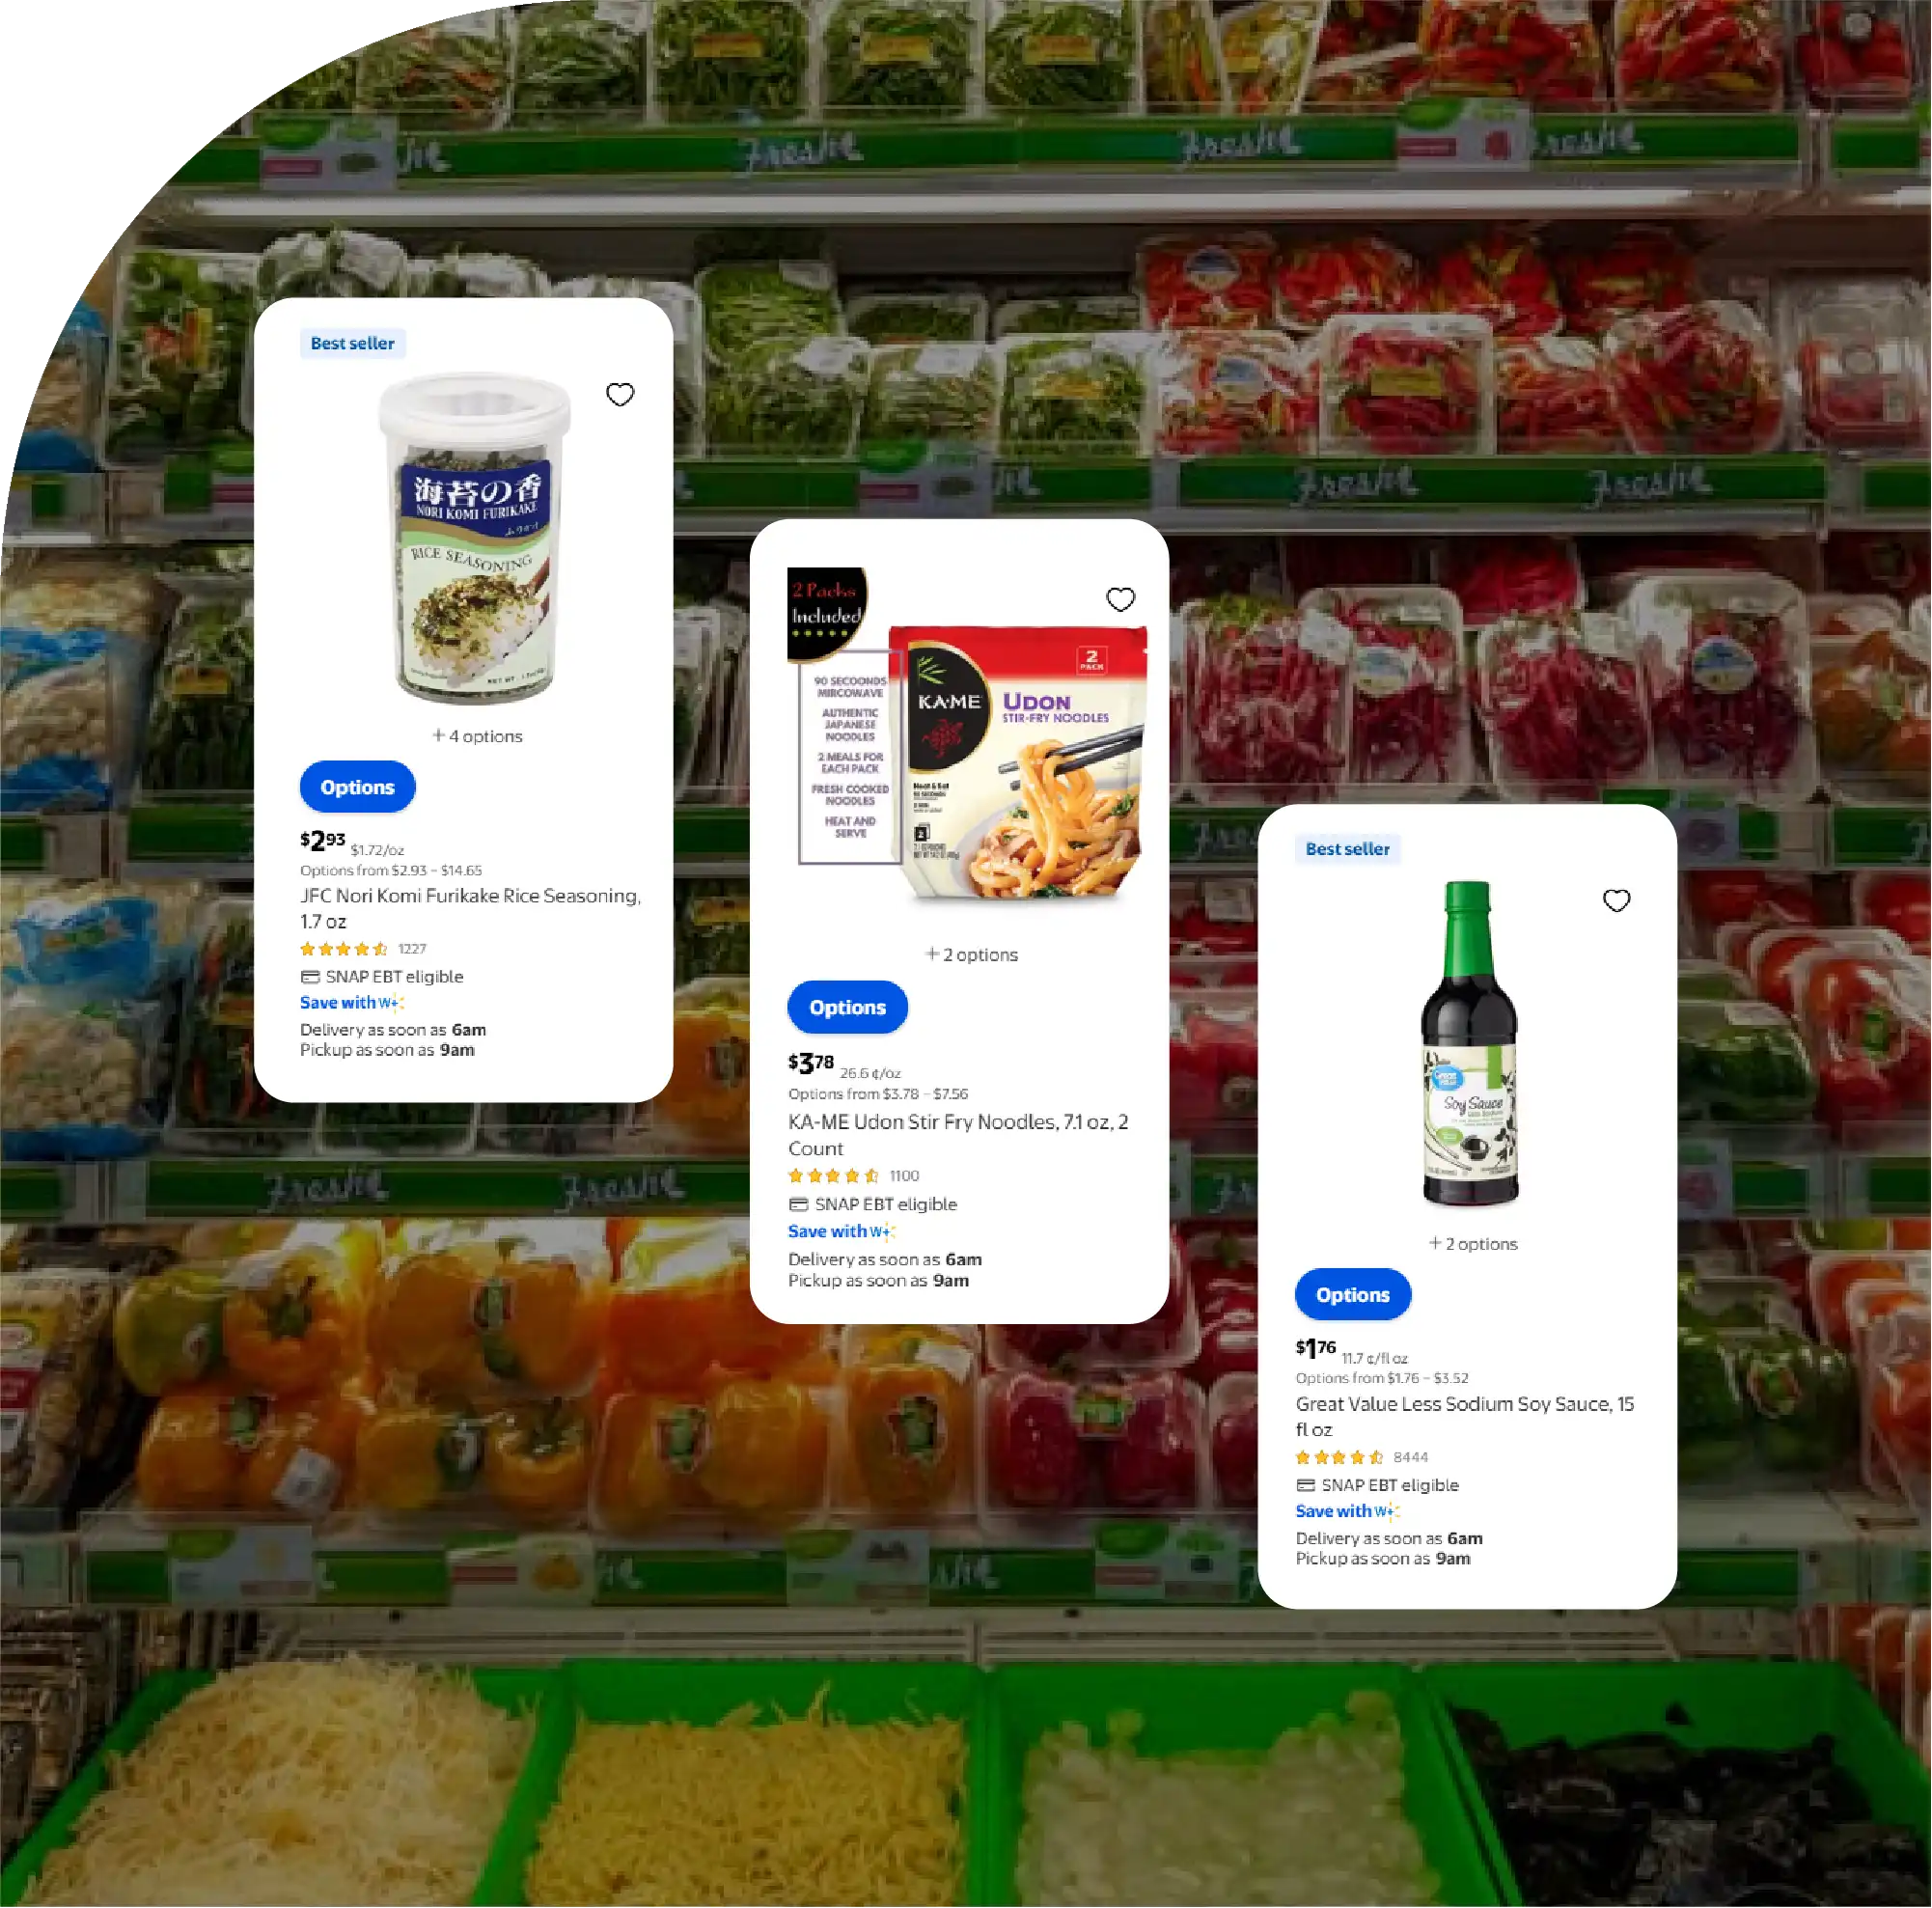
Location-Level Intelligence: Maps SKUs, prices, availability, and assortment differences across individual dark stores and neighborhoods.
Competitive Benchmarking: Measures assortment overlap, unique SKUs, category depth, brand penetration, discounts, and competitor positioning.
Real-Time Availability Tracking: Monitors stock status, recurring stockouts, delivery estimates, and SKU availability changes throughout the day.
Pricing & Promotion Insights: Tracks localized prices, discounts, promotional SKUs, pack sizes, and competitive pricing movements over time.
Strategic Assortment Optimization: Supports demand forecasting, assortment planning, market expansion, inventory allocation, and identification of profitable assortment gaps.

The rapid expansion of quick commerce has transformed how consumers discover, compare, and purchase everyday products. Behind the promise of 10--30 minute delivery is a complex network of dark stores, micro-fulfillment centers, local warehouses, and neighborhood-level inventory systems. Each facility carries a carefully selected assortment designed around local demand, purchasing power, delivery radius, and operational constraints. For brands, retailers, and quick-commerce platforms, understanding this assortment has become a major competitive advantage.
Scrape Dark Store Assortment Mapping to systematically collect product-level information from dark-store catalogs and connect those products with locations, prices, stock status, categories, brands, and promotional activity. Instead of treating every city as one market, businesses can analyze assortment differences at individual dark-store and neighborhood levels.
Scrape dark store SKU availability mapping provides another layer of intelligence by identifying which SKUs are listed, available, unavailable, substituted, or temporarily out of stock across specific fulfillment locations.
Dark store assortment analysis by location helps businesses understand why one neighborhood may carry 8,000 SKUs while another carries 5,500, and which categories explain those differences. This information is increasingly valuable for assortment planning, retail expansion, demand forecasting, competitor benchmarking, and market-entry decisions.
The objective is not simply to collect product catalogs. A well-designed data pipeline creates a continuously refreshed map of assortment, availability, pricing, promotions, brands, pack sizes, and geographic coverage.
Dark-store assortment mapping connects product information with geographic and operational context. A basic product catalog may reveal product names and prices, but a mapped dataset can answer much more valuable questions.
Businesses can determine which SKUs are available at each location, how assortment changes between neighborhoods, which brands dominate particular markets, and how competitors respond to local demand.
Typical data fields include dark-store ID, store name, latitude, longitude, delivery area, SKU ID, product name, brand, category, subcategory, pack size, MRP, selling price, discount, stock status, availability timestamp, promotion, rating, product URL, image URL, and collection timestamp.
The dataset can also capture delivery estimates and assortment visibility. A product appearing in one customer location but not another may indicate localized assortment decisions rather than a platform-wide availability issue.
| Data Category | Key Fields | Typical Volume per 100 Stores | Refresh Frequency | Primary Business Use |
|---|---|---|---|---|
| Store Data | Store ID, name, coordinates, zone | 100-150 records | Weekly | Location mapping |
| SKU Data | SKU ID, product, brand, category | 500,000-900,000 | Daily | Catalog intelligence |
| Pricing Data | MRP, selling price, discount | 500,000-900,000 | 4-12 times/day | Price benchmarking |
| Availability | In stock, out of stock, limited | 500,000-900,000 | 4-24 times/day | Inventory monitoring |
| Category Data | Category, subcategory, segment | 50,000-100,000 | Weekly | Assortment analysis |
| Promotion Data | Offer, coupon, discount | 100,000-250,000 | 4-12 times/day | Promotion tracking |
| Pack Data | Weight, volume, count | 100,000-250,000 | Weekly | Pack-price comparison |
| Brand Data | Brand, manufacturer | 20,000-60,000 | Weekly | Brand benchmarking |
| Delivery Data | ETA, service radius | 100-300 records | Hourly | Service analysis |
| Geographic Data | PIN code, locality, coordinates | 100-500 records | Weekly | Market segmentation |
| Product Images | Image URLs, thumbnails | 500,000-900,000 | Weekly | Visual catalog analysis |
| Timestamp Data | Collection date/time | 500,000-900,000 | Every crawl | Historical intelligence |
Dark store assortment intelligence allows companies to move beyond static competitor catalogs. It creates a time-series view of how product availability and assortment evolve.
For example, a beverage brand may discover that its competitor stocks 18 SKUs in affluent neighborhoods but only seven in lower-volume zones. A grocery retailer may identify that premium organic products are concentrated around selected locations. A consumer brand can determine whether a newly launched SKU is being distributed broadly or selectively.
Assortment intelligence is especially powerful when combined with pricing and availability. A product priced aggressively but consistently out of stock represents a different competitive situation from a product that is both competitively priced and continuously available.
Dark store competitor assortment monitoring helps companies compare competitors at equivalent geographic levels. Instead of comparing one platform's entire catalog with another's, analysts can compare stores serving similar neighborhoods.
This creates more meaningful competitive benchmarks.
For instance, analysts can Scrape Dark Store Stock & Pricing Data and calculate assortment overlap, unique SKU percentage, category depth, brand penetration, premium-SKU share, private-label penetration, and stock availability for every market.
| Metric | Store A | Store B | Store C | Store D | Store E | Market Average |
|---|---|---|---|---|---|---|
| Total SKUs | 8,420 | 7,960 | 9,180 | 6,850 | 8,740 | 8,230 |
| Grocery SKUs | 2,340 | 2,180 | 2,610 | 1,940 | 2,420 | 2,298 |
| Beverage SKUs | 820 | 760 | 910 | 650 | 850 | 798 |
| Personal Care SKUs | 1,020 | 950 | 1,140 | 820 | 1,080 | 1,002 |
| Household SKUs | 1,180 | 1,090 | 1,260 | 970 | 1,210 | 1,142 |
| Fresh Food SKUs | 760 | 680 | 840 | 590 | 790 | 732 |
| Private-Label SKUs | 620 | 540 | 710 | 430 | 650 | 590 |
| Premium SKUs | 1,180 | 1,020 | 1,390 | 850 | 1,250 | 1,138 |
| Average Availability % | 91.6 | 88.4 | 94.2 | 84.7 | 92.8 | 90.3 |
| Average Discount % | 8.7 | 10.2 | 7.9 | 11.6 | 9.1 | 9.5 |
| Assortment Overlap % | 76.2 | 72.8 | 81.5 | 68.9 | 78.6 | 75.6 |
| Unique SKU Share % | 23.8 | 27.2 | 18.5 | 31.1 | 21.4 | 24.4 |
| Average Delivery ETA | 17 min | 21 min | 15 min | 24 min | 18 min | 19 min |
| Promotional SKUs | 940 | 1,060 | 880 | 1,220 | 990 | 1,018 |
| Out-of-Stock Rate % | 8.4 | 11.6 | 5.8 | 15.3 | 7.2 | 9.7 |
These measurements allow businesses to identify assortment leaders, availability weaknesses, price aggressiveness, and geographic differentiation.
Dark store product availability data scrape projects generally begin by defining the geographic footprint. Locations can be organized by city, postal code, neighborhood, delivery zone, latitude-longitude grid, or store radius.
The collection layer then captures product catalogs associated with those locations. Depending on the source architecture, data may be collected through publicly accessible pages, structured endpoints, feeds, or permitted APIs. Each observation should retain a timestamp so that changes can be reconstructed historically.
Normalization is critical because the same product may appear under different names, pack descriptions, or SKU identifiers. Product matching algorithms can standardize brands, categories, sizes, and identifiers before comparison.
A robust pipeline typically follows five stages: location discovery, catalog extraction, product normalization, availability and price tracking, and historical storage.
Competitor assortment analysis becomes substantially more valuable when businesses calculate measurable gaps rather than simply listing products.
Important metrics include assortment overlap, competitor-exclusive products, missing SKUs, category coverage, brand coverage, pack-size coverage, average price differences, availability gaps, and promotional intensity.
A retailer could discover that it carries 82% of a competitor's core grocery assortment but only 48% of its premium beverage assortment. This indicates an opportunity to expand rather than replicate the entire catalog.
Another useful measure is SKU availability consistency. A product available during 95% of observations is operationally stronger than one available only 55% of the time, even if both are technically listed.
Assortment mapping becomes significantly more powerful when pricing is analyzed alongside availability. Historical observations can reveal whether price reductions lead to faster stock depletion, whether promotional SKUs remain consistently available, and whether competitors increase prices when supply becomes constrained.
Businesses can segment products into four groups: high-price/high-availability, low-price/high-availability, high-price/low-availability, and low-price/low-availability. Each segment indicates a different competitive strategy.
Location-level analysis can also reveal localized pricing. A product may have different prices, discounts, or promotions depending on fulfillment location, delivery zone, demand intensity, or inventory conditions.
Dark-store assortment mapping supports several commercial functions. Category managers can identify assortment gaps. Brand managers can monitor distribution. Retailers can benchmark competitors. Investors can evaluate market expansion. Supply-chain teams can detect availability issues.
For new market launches, historical assortment data can identify which categories are consistently present across established locations. This helps determine the minimum viable assortment for a new fulfillment center.
For brands, the dataset can reveal distribution breadth by counting active locations, percentage of stores carrying a SKU, average availability, and geographic concentration.
For platforms, assortment intelligence can help optimize localized catalogs, reduce unnecessary SKU duplication, and improve inventory allocation.
Dark-store data changes rapidly. Products can disappear from catalogs, prices can change several times a day, and stock status can vary within minutes. Therefore, one-time Dark Store Data Scraping provides only a snapshot.
Reliable intelligence requires scheduled collection, location-aware crawling, timestamp preservation, SKU normalization, duplicate removal, and historical comparison.
Geographic consistency is equally important. A dataset should distinguish between a product being genuinely unavailable and a product being unavailable because a specific delivery location is outside its service area.
Data quality checks should monitor sudden SKU-count changes, unusual price movements, duplicate products, missing categories, invalid coordinates, and abnormal availability patterns.
The greatest value comes from converting individual observations into historical intelligence. Once data is stored over weeks or months, businesses can identify seasonal assortment shifts, promotional cycles, new-store expansion, discontinued products, recurring stockouts, and competitive responses.
A 90-day dataset can reveal whether a competitor is steadily expanding premium assortment. A 180-day dataset can identify seasonal category changes. A year-long dataset can expose long-term assortment strategy.
This transforms dark-store monitoring from a data collection exercise into an analytical system supporting strategic decision-making.
Dark stores are becoming increasingly important nodes in modern retail infrastructure, making product-level geographic intelligence essential for competitive decision-making. A comprehensive Dark Store Pricing & Availability Data Scraping program can connect SKU pricing, stock status, promotions, and assortment changes across individual fulfillment locations.
Similarly, Dark Store Location Data Scraping provides the geographic foundation required to understand store coverage, delivery zones, market density, and assortment differences between neighborhoods.
When these datasets are integrated, Dark Store & Quick Commerce Data Insights can help retailers, brands, marketplaces, and analysts understand assortment gaps, competitor behavior, pricing movements, product availability, and market expansion opportunities.
The strategic advantage comes from moving beyond simple catalog collection. By combining location intelligence, SKU-level mapping, price monitoring, availability tracking, and historical analysis, businesses can create a continuously updated view of the quick-commerce landscape. This enables faster assortment decisions, stronger competitive positioning, smarter market expansion, and more precise retail intelligence in an increasingly localized digital marketplace.
Are you in need of high-class scraping services? Food Data Scrape should be your first point of call. We are undoubtedly the best in Food Data Aggregator and Mobile Grocery App Scraping service and we render impeccable data insights and analytics for strategic decision-making. With a legacy of excellence as our backbone, we help companies become data-driven, fueling their development. Please take advantage of our tailored solutions that will add value to your business. Contact us today to unlock the value of your data.



