Introduction
India’s restaurant industry is highly dynamic, with new outlets appearing across metropolitan cities, emerging urban centers, and neighborhood markets every month. For restaurant aggregators, food delivery companies, investors, market researchers, franchise operators, and location intelligence providers, identifying these new establishments early can provide a significant competitive advantage. Scrape Monthly New Restaurant Data to systematically monitor newly appearing restaurants, their locations, cuisines, menus, ratings, delivery availability, and other attributes across major food delivery platforms.
A monthly restaurant database can reveal more than a list of newly launched outlets. When collected consistently, it can become a valuable source for understanding restaurant expansion, consumer preferences, competitive density, cuisine trends, pricing movements, and local food-service growth. Zomato and Swiggy provide extensive restaurant discovery and food delivery information, making them important sources for structured restaurant market analysis.
Why Track New Restaurant Openings Every Month?
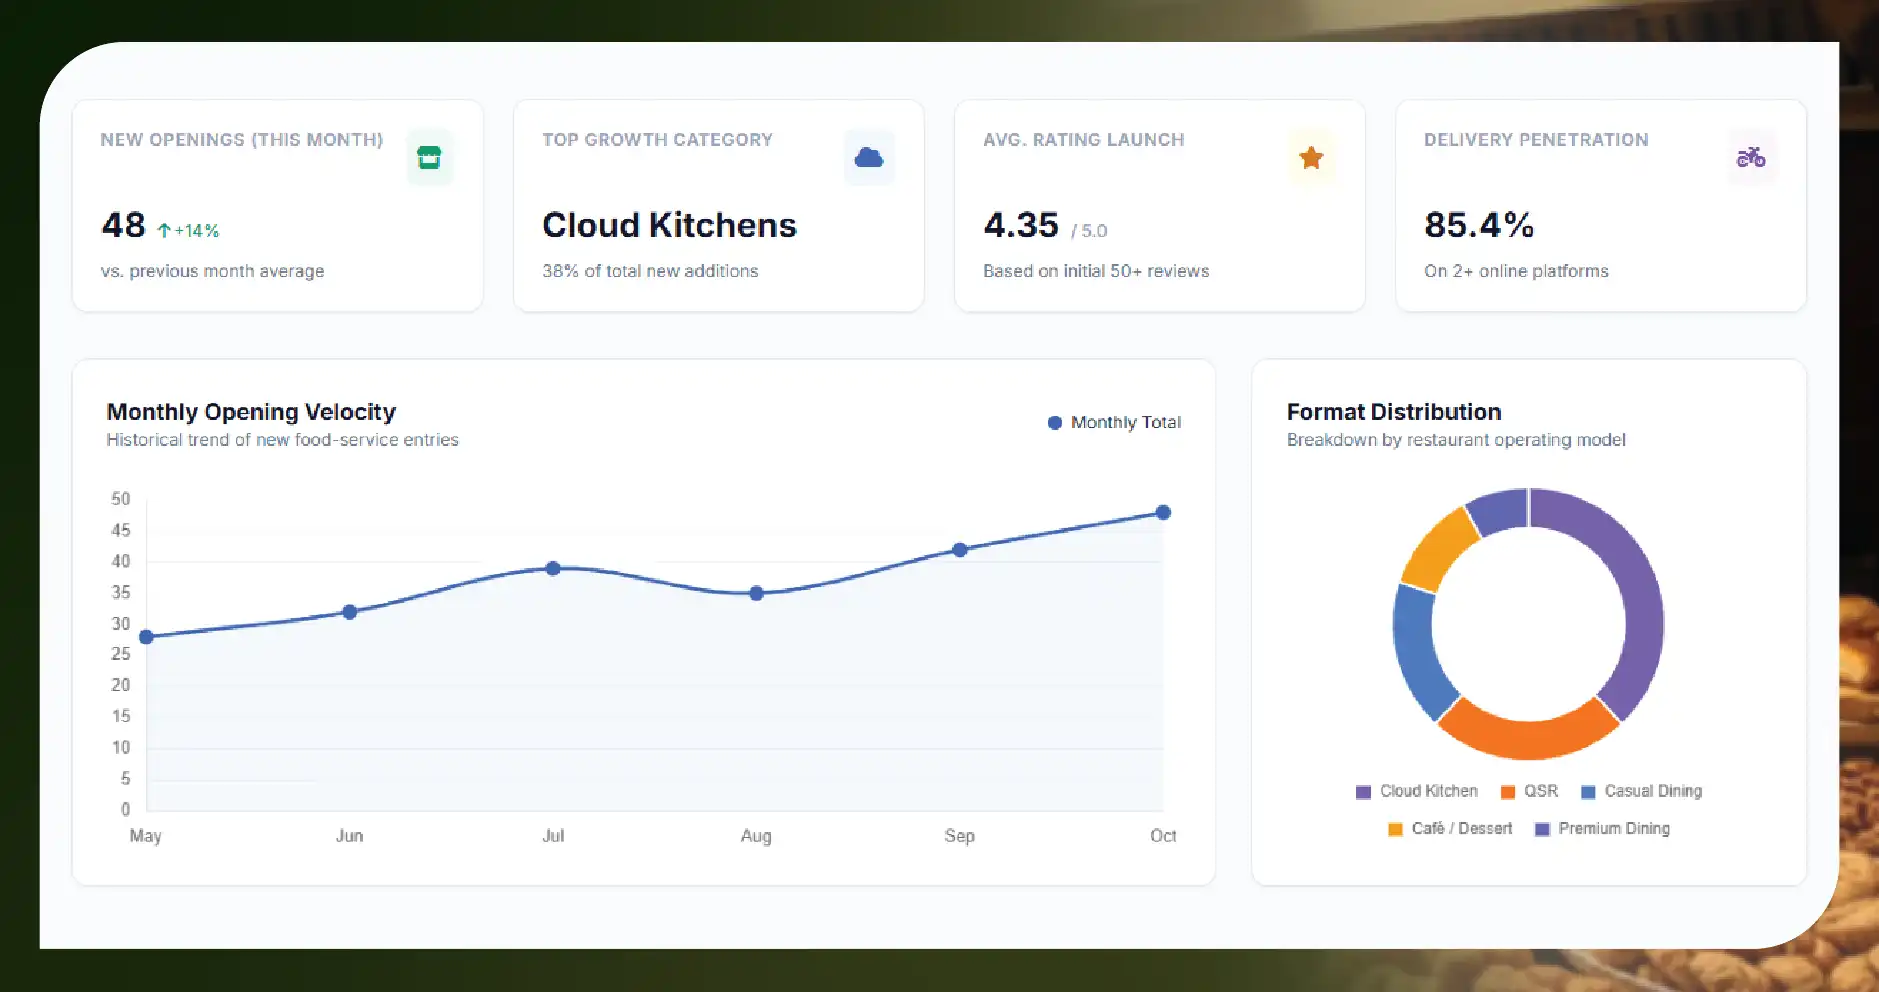
Restaurant openings can change the competitive landscape of a neighborhood very quickly. A locality that previously had only a handful of restaurants may suddenly attract multiple cloud kitchens, QSRs, cafés, dessert brands, or premium dining concepts.
New Restaurant Opening Data Scraping helps businesses build a historical record of these changes rather than relying on occasional manual searches. By collecting data periodically, analysts can compare restaurant counts between months and identify areas experiencing rapid food-service growth.
For example, a monthly database could track:
- Restaurant name and brand
- Outlet address
- City and locality
- Cuisine category
- Restaurant type
- Delivery availability
- Rating and review count
- Price range
- Menu items
- Opening or first-observed date
- Restaurant coordinates where available
- Delivery platform presence
- Operating hours
- Offers and promotional information
The resulting dataset can support both operational decisions and long-term market research.
Tracking Zomato and Swiggy New Restaurants
Zomato and Swiggy have extensive restaurant coverage across Indian cities. However, restaurant availability and listings can change frequently. Restaurants may be newly added, relocated, renamed, temporarily unavailable, or removed from a platform.
Zomato & Swiggy New Restaurant Data Scraping allows organizations to monitor these changes systematically and create monthly snapshots. Instead of asking which restaurants exist today, analysts can answer more valuable questions: Which restaurants appeared this month? Which neighborhoods attracted the most openings? Which cuisines are expanding fastest? Which brands are entering new cities?
A historical database can therefore transform individual restaurant listings into a time-series intelligence resource.
What Information Should a Monthly Restaurant Database Contain?
A useful database should capture standardized fields that allow restaurants and locations to be compared consistently. Simply collecting restaurant names is rarely sufficient for serious analysis.
Important fields may include:
| Data Category | Example Information |
|---|---|
| Restaurant Identity | Name, brand, restaurant ID |
| Location | Address, locality, city, coordinates |
| Cuisine | Indian, Chinese, Italian, Bakery, Café |
| Restaurant Type | QSR, café, cloud kitchen, fine dining |
| Pricing | Average cost, price category |
| Ratings | Rating, review count |
| Menu | Items, categories, prices |
| Delivery | Delivery availability, estimated time |
| Platform | Zomato, Swiggy, or both |
| Status | Newly listed, active, unavailable |
| Observation | First-seen and last-seen date |
Standardization becomes particularly important when the same restaurant appears on multiple platforms under slightly different names.
Building India Restaurant Market Intelligence
Restaurant openings can act as an indicator of local economic and consumer activity. A rising number of new outlets may indicate growing demand, increased residential development, tourism, office activity, or stronger spending power.
India Restaurant Market Intelligence can be developed by analyzing monthly restaurant-opening datasets across cities, neighborhoods, cuisines, and restaurant categories.
For instance, researchers could compare:
- Mumbai versus Bengaluru restaurant openings
- Tier-1 versus Tier-2 city expansion
- QSR versus independent restaurant growth
- Vegetarian versus non-vegetarian concepts
- Café versus cloud-kitchen expansion
- Premium versus value-oriented restaurants
- Local brands versus national chains
Over several months, these comparisons can reveal structural trends that would be difficult to identify from one-time restaurant searches.
Extracting Restaurant Listings from Food Delivery Platforms
Restaurant discovery platforms contain numerous attributes that can contribute to market research. Businesses can organize these attributes into structured records and compare changes over time.
Extract Zomato & Swiggy Restaurant Listings Data to help create a unified database containing restaurant identities, locations, cuisines, pricing, ratings, menus, delivery information, and other relevant attributes.
One major challenge is deduplication. A restaurant may have multiple outlets, while the same brand may operate several locations. A robust database should distinguish between the parent brand and individual outlets.
For example:
Brand: Example FoodsOutlet 1: Bengaluru – KoramangalaOutlet 2: Bengaluru – IndiranagarOutlet 3: Hyderabad – Banjara Hills
This distinction allows analysts to measure both brand growth and outlet-level expansion.
Monthly Comparison Creates a Historical Growth Layer
The real value of a monthly database emerges when current information is compared against historical snapshots.
Suppose a researcher records restaurant listings in January, February, March, and April. The resulting dataset can identify:
- Newly observed restaurants
- Restaurants no longer visible
- Existing restaurants with changed ratings
- Brands opening additional outlets
- Menu price changes
- Cuisine-category growth
- Localities with increasing restaurant density
This makes Zomato and Swiggy data collection more valuable than a single data extraction exercise.
Businesses can calculate monthly opening rates, closure indicators, outlet expansion rates, cuisine growth percentages, and platform penetration.
Identifying Restaurant Hotspots
Restaurant openings are rarely distributed evenly across a city. Certain neighborhoods consistently attract new concepts because of population density, commercial activity, accessibility, income levels, student populations, office clusters, or residential development.
A monthly database can rank neighborhoods according to the number of newly observed outlets.
For example:
| Locality | Previous Restaurants | New Restaurants | Growth Signal |
|---|---|---|---|
| Koramangala | 480 | 32 | High |
| Indiranagar | 420 | 24 | High |
| Whitefield | 365 | 29 | High |
| HSR Layout | 310 | 21 | Moderate |
| Jayanagar | 285 | 12 | Moderate |
Such analysis can help brands identify promising expansion locations while helping investors understand where restaurant activity is accelerating.
Monitoring Brand and Outlet Expansion
Restaurant chains frequently expand through multiple outlets rather than launching a single location. Tracking these openings provides insight into competitive strategies.
Scrape Restaurant Outlet Expansion Data to determine how frequently brands enter new neighborhoods or cities. Analysts can compare national chains, regional brands, franchise operators, and emerging restaurant concepts.
A monthly expansion database could answer questions such as:
- Which brands opened the most outlets?
- Which cities are receiving new outlets?
- Which brands are expanding beyond their home market?
- Which cuisines are associated with the fastest expansion?
- Are brands prioritizing delivery-first locations?
- How quickly does an emerging brand scale?
This information can support franchise research, competitor monitoring, and market-entry strategies.
Restaurant Menu Data Adds Another Layer of Intelligence
New restaurant identification becomes significantly more useful when menu information is connected to the restaurant record.
Restaurant Menu Data Scraping can capture menu categories, item names, prices, descriptions, dietary labels, portion information, and other publicly displayed attributes.
Researchers can then study how newly launched restaurants position themselves. For example, an analyst could identify whether new cafés are introducing premium beverages, whether QSRs are competing through combo pricing, or whether cloud kitchens are specializing in narrow cuisine categories.
Menu information can also be used to monitor pricing trends. Comparing the same or similar dishes across restaurants can help businesses understand local price positioning.
Using AI for Restaurant Intelligence
Large monthly datasets can contain hundreds of thousands of records, making manual analysis inefficient. AI-based analytical systems can help identify patterns across restaurant openings, menus, locations, ratings, and pricing.
AI Restaurant Intelligence can support automated classification and trend discovery. Restaurants can be grouped by cuisine, business model, price segment, brand type, or expansion pattern.
AI models can also help identify anomalies, such as unusually rapid outlet growth, sudden menu-price movements, or neighborhoods experiencing an unexpected increase in new restaurants.
A structured monthly dataset combined with AI can therefore evolve from a basic restaurant directory into a predictive intelligence system.
Applications of a Monthly New-Restaurant Database
A continuously updated database can serve several industries.
Restaurant Brands
Restaurant companies can identify emerging competitors, evaluate potential expansion locations, and monitor local cuisine trends.
Food Delivery Businesses
Delivery platforms and technology providers can understand restaurant supply growth, identify onboarding opportunities, and measure competitive restaurant density.
Investors
Investors can evaluate market activity by city, brand, cuisine, and restaurant format before making expansion or investment decisions.
Franchise Companies
Franchisors can identify high-growth locations and benchmark competing chains.
Market Researchers
Research organizations can create longitudinal datasets showing how India's restaurant ecosystem changes over time.
Real Estate Companies
Restaurant openings can provide an additional signal when evaluating commercial areas and emerging retail corridors.
Challenges in New Restaurant Data Collection
Creating a reliable database requires more than extracting visible listings. Restaurant platforms frequently change their interfaces, data structures, availability, and presentation.
Other challenges include duplicate listings, inconsistent addresses, changing restaurant names, temporary closures, missing menu information, and differences between platform records.
Data normalization is therefore essential. Restaurant names, addresses, cuisines, prices, and outlet identifiers should be standardized before conducting comparisons.
A recurring monthly process also needs quality checks to distinguish genuinely new restaurants from existing restaurants that were simply updated or re-listed.
How Food Data Scrape Can Help You?
1. Build Monthly Restaurant Databases
Food Data Scrape can collect and structure newly observed restaurant listings each month, helping businesses maintain organized historical databases for competitive analysis, expansion planning, and market research.
2. Monitor Restaurant Market Changes
Recurring data collection can identify new openings, closures, outlet additions, cuisine movements, pricing changes, and neighborhood-level growth, creating a clearer picture of evolving restaurant markets.
3. Analyze Competitor Expansion
Businesses can track restaurant brands across cities and localities, comparing outlet counts, cuisine categories, menu positioning, ratings, and expansion patterns to understand competitive movements more effectively.
4. Enrich Restaurant Intelligence
Combining restaurant listings with menus, pricing, ratings, locations, and delivery attributes creates richer datasets that support segmentation, benchmarking, consumer research, and location intelligence initiatives.
5. Support AI-Powered Insights
Clean historical restaurant datasets can feed analytical and AI systems that identify emerging food trends, expansion opportunities, competitive hotspots, pricing patterns, and potential market opportunities.
Conclusion
A monthly new-restaurant database can turn constantly changing food delivery listings into a structured intelligence asset. By tracking restaurant openings across Zomato and Swiggy, businesses can identify emerging locations, monitor brand expansion, compare cuisines, evaluate pricing, and understand how restaurant supply changes over time.
The combination of restaurant listings, menus, ratings, locations, and historical observations creates a powerful foundation for Food Delivery Datasets and restaurant market analysis. Businesses seeking scalable collection can also explore a Zomato Food Delivery Scraping API for structured restaurant intelligence and a Swiggy Food Delivery Scraping API for continuously updated platform data.
When collected consistently and analyzed intelligently, monthly restaurant-opening data can help businesses move beyond static directories toward a dynamic view of India's rapidly evolving food-service ecosystem.
If you are seeking for a reliable data scraping services, Food Data Scrape is at your service. We hold prominence in Food Data Aggregator and Mobile Restaurant App Scraping with impeccable data analysis for strategic decision-making.