

Restaurant coverage and availability mapping have become essential for organizations seeking accurate insights into food service markets across diverse urban regions. This report examines how city-level restaurant data can be collected, standardized, and analyzed to evaluate market penetration, delivery availability, cuisine diversity, competitive density, and geographic expansion opportunities. By combining location intelligence with operational restaurant data, businesses can identify underserved neighborhoods, monitor competitor presence, optimize delivery networks, and improve site selection strategies. The report also explores the role of automated data extraction in maintaining continuously updated restaurant databases that reflect changes in listings, operating hours, delivery zones, ratings, and customer demand. Through detailed numerical analysis and city-wise comparisons, organizations gain actionable intelligence for strategic planning, investment decisions, and operational efficiency. The findings demonstrate how comprehensive restaurant coverage mapping supports restaurant chains, food delivery platforms, investors, real estate developers, and market researchers in making informed, data-driven decisions while adapting to rapidly evolving urban dining ecosystems and consumer preferences.
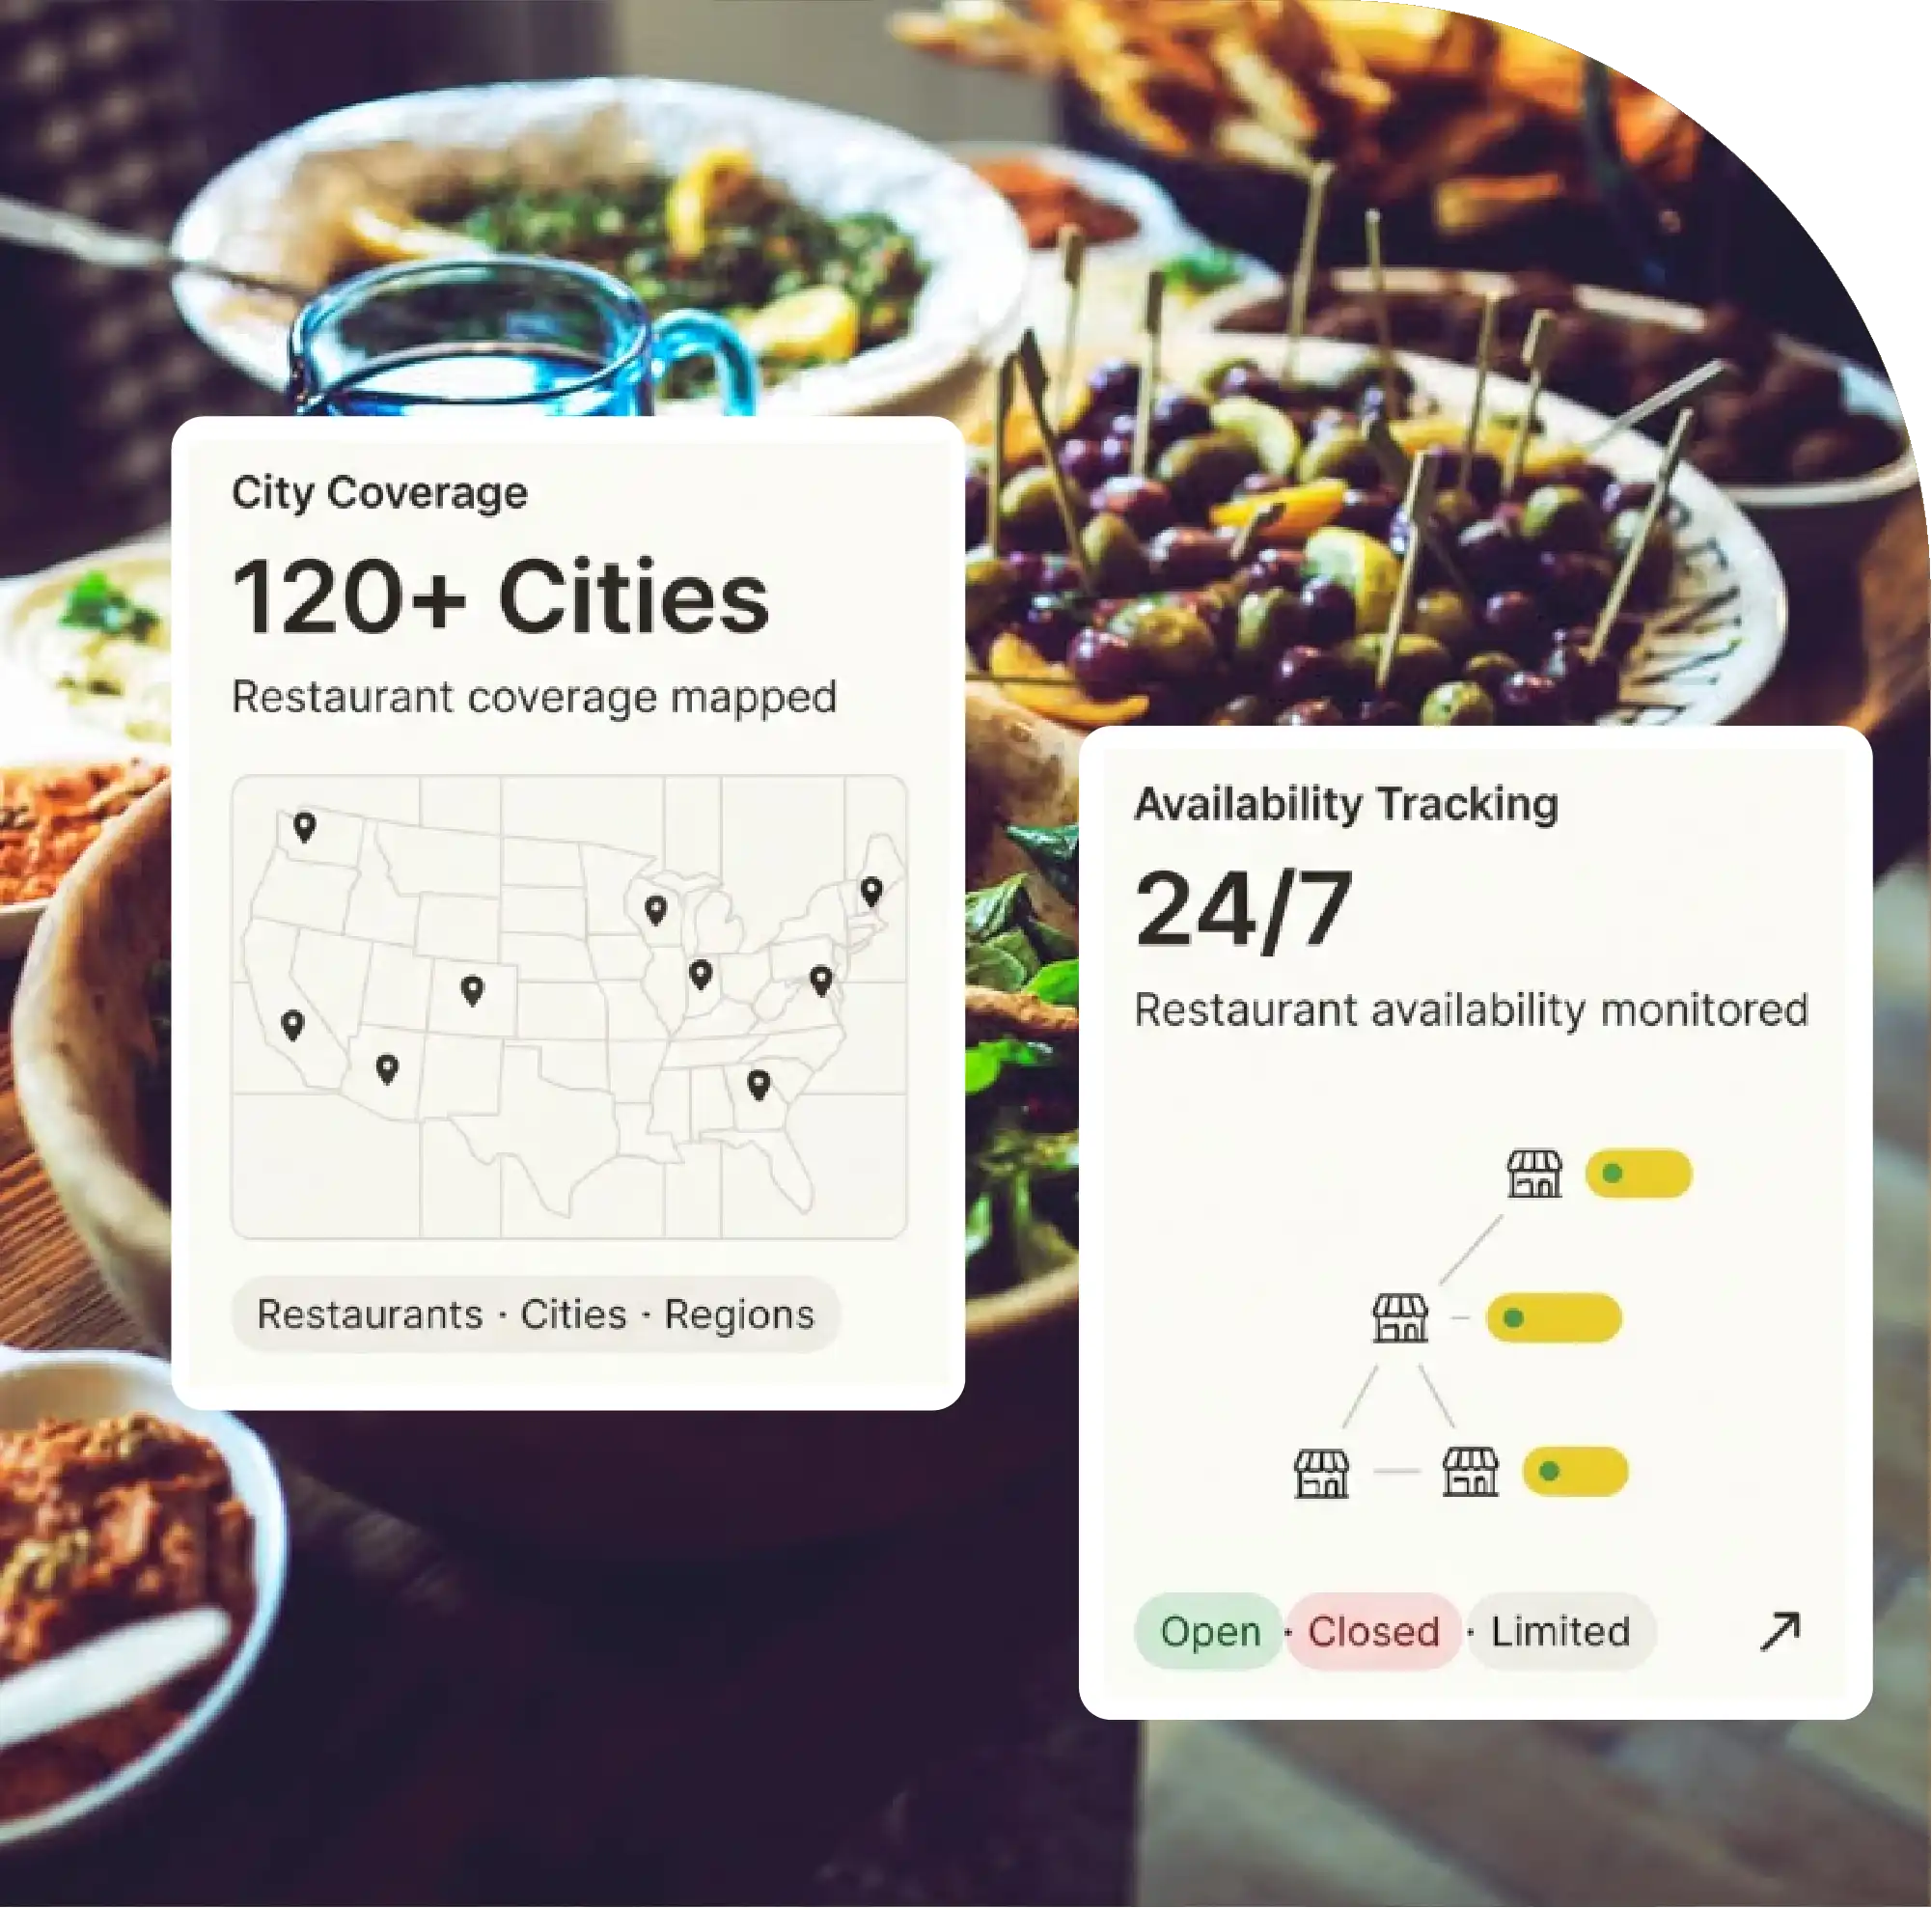
Market Reach:
Evaluates restaurant density across diverse metropolitan regions accurately.
Coverage Insights:
Identifies underserved neighborhoods using comprehensive geographic restaurant datasets.
Delivery Mapping:
Tracks evolving delivery zones for operational optimization strategies.
Competitive Analysis:
Benchmarks restaurant presence against regional market competitors effectively.
Location Intelligence:
Supports evidence-based expansion through geographic performance analytics.

The restaurant industry has become increasingly data-driven as businesses seek accurate market intelligence to improve expansion planning, competitive positioning, and customer engagement. Scrape Restaurant Coverage & Availability Mapping by City to collect structured information about restaurant locations, operational coverage, cuisine distribution, delivery availability, ratings, and service regions across multiple cities. Businesses leverage these insights to compare urban markets, identify underserved neighborhoods, and optimize delivery operations using real-time geographic intelligence. At the same time, city-level restaurant coverage analysis provides measurable visibility into restaurant density, delivery reach, and customer accessibility across metropolitan regions.
Growing food delivery ecosystems generate millions of location-based records daily, creating valuable datasets for investors, restaurant chains, delivery platforms, and market researchers. Modern data collection technologies gather restaurant names, coordinates, delivery zones, operating hours, customer ratings, cuisine categories, pricing levels, and availability patterns. These datasets support restaurant location analytics by city, enabling organizations to understand regional demand, market saturation, and emerging commercial opportunities. With structured restaurant intelligence, companies can improve site selection, monitor competitors, forecast demand, and strengthen operational planning across local and international markets.
Restaurant coverage mapping combines geographic information systems with structured restaurant datasets to visualize the availability of dining establishments across different urban regions. The collected information extends beyond simple restaurant listings by incorporating operational characteristics such as delivery service areas, cuisine specialization, customer reviews, average pricing, and business hours.
Businesses use these insights to determine whether certain neighborhoods remain underserved, identify rapidly growing commercial districts, evaluate delivery efficiency, and understand competitive intensity. Mapping restaurant availability also assists governments, urban planners, and investment firms in evaluating food accessibility across expanding metropolitan regions.
Advanced scraping solutions continuously update restaurant records, ensuring organizations maintain accurate information despite frequent restaurant openings, closures, menu updates, and delivery coverage modifications. Dynamic data collection creates continuously refreshed databases suitable for business intelligence and predictive analytics.
The following table demonstrates representative restaurant coverage statistics collected from multiple metropolitan regions for analytical purposes.
| City | Restaurants Listed | Active Delivery Partners | Average Rating | Average Delivery Radius (km) | Premium Restaurants | Budget Restaurants | Average Monthly Orders (000) |
|---|---|---|---|---|---|---|---|
| New York | 28,450 | 16 | 4.42 | 8.4 | 6,540 | 12,860 | 5,820 |
| Los Angeles | 21,730 | 15 | 4.36 | 9.1 | 5,420 | 9,960 | 4,360 |
| Chicago | 15,620 | 14 | 4.31 | 7.9 | 3,480 | 7,120 | 2,940 |
| Houston | 14,280 | 13 | 4.27 | 9.6 | 2,940 | 6,890 | 2,720 |
| Toronto | 12,540 | 12 | 4.40 | 8.2 | 3,260 | 5,870 | 2,180 |
| London | 24,860 | 18 | 4.45 | 7.4 | 6,180 | 10,450 | 5,340 |
| Sydney | 10,920 | 11 | 4.38 | 8.7 | 2,510 | 5,140 | 1,840 |
| Singapore | 9,480 | 10 | 4.47 | 6.8 | 2,140 | 4,680 | 1,960 |
| Dubai | 13,740 | 12 | 4.44 | 10.1 | 4,120 | 5,380 | 2,640 |
| Mumbai | 19,360 | 14 | 4.29 | 6.7 | 3,520 | 10,860 | 4,920 |
These numerical datasets provide valuable insight into regional restaurant density, delivery infrastructure, and consumer accessibility across different urban markets.
Restaurant availability mapping helps businesses understand where customer demand aligns with restaurant supply. High-density business districts often demonstrate strong competition, while developing suburban markets may present attractive expansion opportunities due to relatively lower restaurant penetration.
Accurate geographic intelligence enables restaurant chains to evaluate nearby competitors before opening new outlets. Delivery platforms can optimize driver allocation based on restaurant clustering, while investors gain measurable indicators regarding commercial food service growth.
Availability mapping also supports marketing campaigns by identifying neighborhoods where promotional activities can generate maximum customer acquisition with reduced advertising expenditure.
Successful restaurant expansion increasingly depends upon geographic data rather than intuition alone. Organizations analyze demographic information together with restaurant density, purchasing power, cuisine diversity, and delivery accessibility to determine optimal expansion locations.
Historical coverage datasets further reveal market evolution over time, showing how restaurant ecosystems respond to residential development, tourism growth, infrastructure improvements, and changing consumer preferences.
This analytical approach significantly reduces investment risks while improving long-term profitability through evidence-based decision-making.
The following operational dataset illustrates numerical performance indicators used during restaurant coverage evaluation across major cities.
| Metric | New York | London | Dubai | Mumbai | Singapore | Sydney | Toronto | Chicago |
|---|---|---|---|---|---|---|---|---|
| Restaurants Mapped | 18,240 | 22,680 | 16,920 | 25,470 | 13,860 | 20,540 | 11,730 | 27,980 |
| Delivery Zones | 4,820 | 5,640 | 3,980 | 6,180 | 3,220 | 5,060 | 2,840 | 6,740 |
| Cuisine Categories | 112 | 126 | 101 | 138 | 94 | 118 | 89 | 145 |
| Average Delivery Time (minutes) | 31 | 29 | 34 | 28 | 36 | 30 | 35 | 27 |
| Active Delivery Fleet | 8,240 | 9,860 | 6,480 | 10,540 | 5,620 | 8,920 | 4,960 | 11,280 |
| Customer Ratings Collected | 5,820,000 | 7,260,000 | 4,980,000 | 8,420,000 | 3,960,000 | 6,180,000 | 3,420,000 | 9,180,000 |
| Monthly Availability Updates | 118,000 | 146,000 | 104,000 | 168,000 | 86,000 | 132,000 | 74,000 | 184,000 |
| New Restaurants Added | 860 | 1,120 | 740 | 1,280 | 620 | 980 | 510 | 1,460 |
These metrics enable organizations to compare operational maturity across different restaurant ecosystems while identifying cities demonstrating rapid commercial growth.
Restaurant datasets support numerous commercial applications across the food service industry. Franchise operators evaluate competitor density before selecting new locations. Food delivery companies optimize delivery networks using neighborhood-level restaurant distribution. Investors compare restaurant growth rates between metropolitan regions before allocating capital.
Hospitality consultants analyze cuisine diversity to identify emerging food trends, while commercial real estate developers evaluate restaurant concentration when planning mixed-use developments. Insurance companies, logistics providers, and payment platforms similarly benefit from reliable restaurant location datasets.
Comprehensive restaurant market coverage analytics allows decision-makers to quantify competitive intensity while identifying geographical opportunities supported by measurable data rather than assumptions.
Accurate restaurant mapping improves multiple operational functions simultaneously. Delivery platforms reduce travel distances by balancing driver allocation according to restaurant concentration. Restaurant chains optimize inventory planning by understanding neighborhood demand patterns.
Marketing teams create hyperlocal campaigns targeting regions with lower customer penetration. Supply chain managers improve distribution planning by clustering restaurant deliveries according to geographic proximity.
Organizations maintaining continuously updated restaurant location intelligence achieve better operational efficiency because business decisions rely upon current geographic conditions rather than outdated market information.
Modern restaurant data collection combines web crawling, API integrations, geographic coordinate extraction, address standardization, machine learning classification, and automated validation. Data pipelines continuously monitor restaurant listings, operational status, delivery availability, pricing information, customer reviews, and business metadata.
Large-scale automation enables organizations to maintain millions of structured restaurant records with minimal manual intervention. Artificial intelligence further improves duplicate detection, address normalization, cuisine categorization, and geographic clustering.
These technologies ensure high-quality restaurant databases capable of supporting enterprise-scale analytics.
Organizations increasingly compare restaurant ecosystems between cities rather than evaluating markets independently. Cross-city benchmarking identifies regions demonstrating above-average restaurant growth, stronger delivery penetration, higher customer ratings, or greater cuisine diversity.
Benchmarking also reveals competitive differences between mature metropolitan markets and rapidly developing urban centers. Companies entering new markets benefit from understanding existing restaurant concentration before investing significant capital.
Comprehensive food delivery restaurant coverage mapping scraping enables analysts to compare restaurant accessibility, delivery density, and operational performance across numerous cities using standardized geographic metrics.
Similarly, automated city-level restaurant coverage scraping creates continuously refreshed datasets that support regional benchmarking, expansion forecasting, investment analysis, and competitive intelligence across global restaurant markets.
Restaurant coverage mapping has evolved into an essential component of modern location intelligence, providing organizations with accurate geographic visibility into restaurant availability, competitive density, and delivery accessibility. By integrating structured datasets with geographic analytics, businesses can make informed decisions regarding expansion, investment, operational optimization, and customer engagement. Comprehensive restaurant intelligence significantly improves strategic planning while reducing uncertainty associated with rapidly changing food service markets.
Organizations increasingly Extract Restaurant Menu Data to create unified intelligence platforms supporting pricing analysis, cuisine benchmarking, and consumer behavior evaluation. Rich Restaurant POI Dataset collections further enhance geographic decision-making by integrating coordinates, operational metadata, and commercial attributes into a single analytical framework. Modern enterprises also leverage method to Scrape Thousands of Google Maps Restaurants Data to strengthen location research, utilize different tools to Scrape Restaurant Data pipelines for continuously updated business intelligence, and incorporate AI Restaurant Intelligence to automate market forecasting, competitive analysis, and city-wide restaurant ecosystem monitoring.
If you are seeking for a reliable data scraping services, Food Data Scrape is at your service. We hold prominence in Food Data Aggregator and Mobile Restaurant App Scraping with impeccable data analysis for strategic decision-making.



