

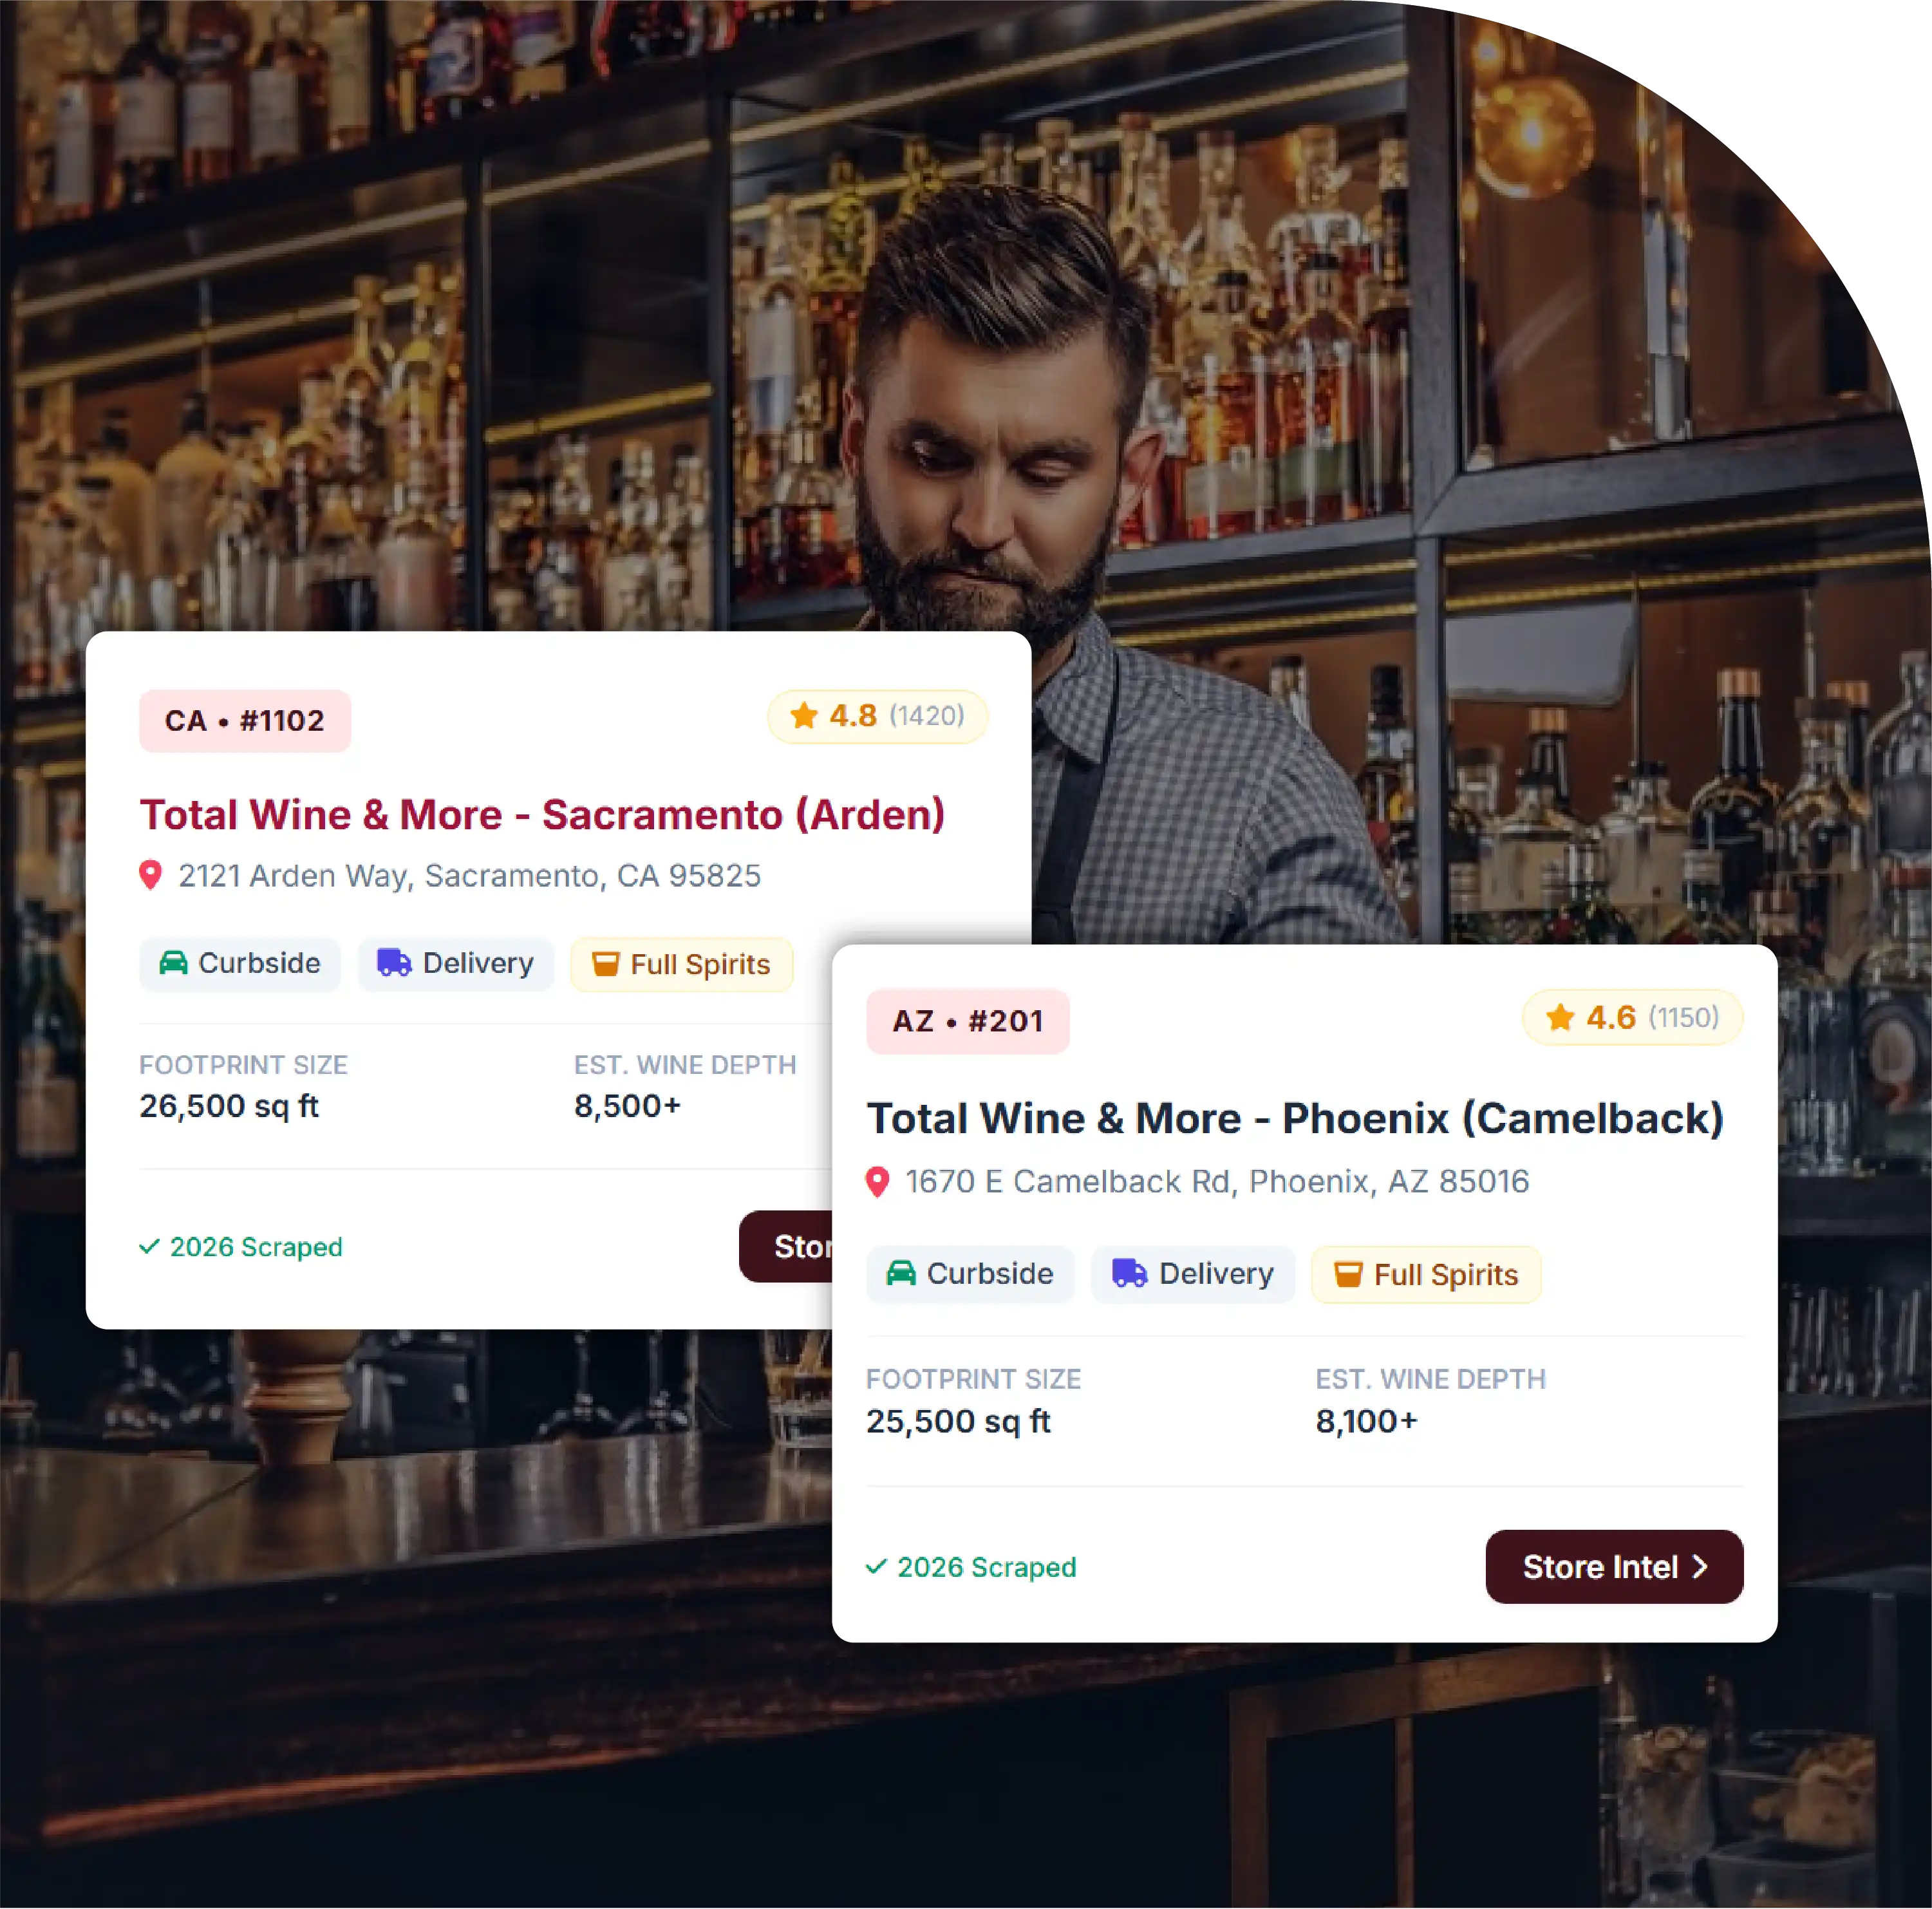
National Store Network: 303 Total Wine & More stores operate across 245 U.S. cities.
Leading State: California leads nationwide with 49 Total Wine & More stores.
Top Three Markets: California, Florida, and Texas collectively account for 138 stores.
Leading City: Houston records the highest identified city count with six stores.
Geographic Intelligence: Location data supports competitive analysis, mapping, expansion, and territory planning.

The United States liquor retail market continues to evolve through geographic expansion, changing consumer preferences, broader product assortments, and increasing demand for convenient access to wine, beer, and spirits. Within this competitive environment, Total Wine & More maintains a substantial physical retail footprint across major U.S. markets. As of August 12, 2026, the analyzed dataset identifies 303 Total Wine & More stores operating across the United States, spanning 245 cities and multiple states and territories.
Businesses conducting method to Scrape Total Wine & More Store Locations Data In USA 2026 can use structured location intelligence to understand geographic coverage, market concentration, city-level presence, and opportunities for expansion. Location-level information can also support territory planning, competitor mapping, retail benchmarking, and investment analysis.
The dataset further demonstrates the importance of Total Wine & More Store Locations Data Scraping for organizations seeking regularly refreshed information about retail networks. Address details, telephone numbers, geographic coordinates, state distribution, city coverage, and update dates can be organized into structured datasets for analytical applications.
Another important use case is to Scrape Total Wine Store Data In USA, allowing analysts to evaluate the retailer's footprint at both national and local levels. The available figures show that California, Florida, and Texas collectively account for 138 locations, representing approximately 46% of the identified U.S. store network.
The Total Wine & More Store Count in the US stands at 303 locations as of August 12, 2026. California leads the state-level distribution with 49 stores, followed closely by Florida with 47 and Texas with 42.
Together, these three states account for nearly half of the retailer's identified U.S. locations. California represents approximately 16% of the network, Florida another 16%, and Texas approximately 14%.
Virginia follows with 20 locations, while North Carolina has 15. Arizona and Washington each have 14 stores. Minnesota records 11 locations, Missouri has 9, and Massachusetts has 8.
This concentration indicates that Total Wine & More has established particularly significant retail coverage across selected high-population and high-consumption markets. However, store density varies considerably between states because population size, retail regulations, urban concentration, and local market characteristics differ.
Population-per-store figures provide another way to interpret the network. Florida has approximately 499,213 people per Total Wine & More location based on the supplied population figures, compared with approximately 803,163 in California and 755,000 in Texas.
Virginia records approximately 444,000 people per store, making its location density comparatively high within the listed markets. Massachusetts, by contrast, has approximately 894,250 people per store despite having eight identified locations.
These differences demonstrate why simply counting stores does not provide a complete picture of retail penetration. Analysts can combine store counts with population, household demographics, income, competitor presence, and geographic accessibility to evaluate market opportunity.
The retailer's network covers a broad collection of metropolitan areas. Houston has the highest number of identified Total Wine & More locations among individual cities, with six stores. Orlando and Miami each have four.
Dallas, Raleigh, Seattle, Charlotte, Plano, Kansas City, and Las Vegas each have three identified locations.
Urban clustering is important because cities with multiple stores can provide stronger market visibility, greater customer accessibility, and potentially more extensive local assortment coverage. For competitors, these markets may warrant deeper analysis of pricing, promotions, product availability, store formats, and customer demand.
From a Total Wine & More Competitive Intelligence perspective, store-level geographic data can be combined with competitor locations to identify areas of direct retail overlap. Analysts can map competing liquor retailers by ZIP code, calculate distances between stores, identify underserved territories, and examine concentration across metropolitan markets.
The following table organizes the leading markets using the supplied store counts, population estimates, percentage contribution, and population-per-store measurements.
| Rank | State / Territory | Stores | Share of U.S. Stores (%) | Population (M) | Population / Store | Estimated Stores per 1M People | Cumulative Stores | Cumulative Share (%) |
|---|---|---|---|---|---|---|---|---|
| 1 | California | 49 | 16 | 39.35 | 803,163 | 1.25 | 49 | 16 |
| 2 | Florida | 47 | 16 | 23.46 | 499,213 | 2.00 | 96 | 32 |
| 3 | Texas | 42 | 14 | 31.71 | 755,000 | 1.32 | 138 | 46 |
| 4 | Virginia | 20 | 7 | 8.88 | 444,000 | 2.25 | 158 | 53 |
| 5 | North Carolina | 15 | 5 | 11.20 | 746,533 | 1.34 | 173 | 58 |
| 6 | Arizona | 14 | 5 | 7.62 | 544,571 | 1.84 | 187 | 63 |
| 7 | Washington | 14 | 5 | 8.00 | 571,500 | 1.75 | 201 | 68 |
| 8 | Minnesota | 11 | 4 | 5.83 | 530,000 | 1.89 | 212 | 72 |
| 9 | Missouri | 9 | 3 | 6.27 | 696,778 | 1.43 | 221 | 75 |
| 10 | Massachusetts | 8 | 3 | 7.15 | 894,250 | 1.12 | 229 | 78 |
| 11 | Other covered markets | 74 | 22 | --- | --- | --- | 303 | 100 |
The top ten listed states account for 229 stores, or approximately 78% of the total 303-location network. This illustrates a highly concentrated retail footprint, with a relatively large portion of the network positioned in a limited number of states.
The city-level distribution provides another perspective on the retailer's physical presence. Houston leads the identified cities with six locations. Orlando and Miami follow with four stores each.
Dallas, Raleigh, Seattle, Charlotte, Plano, Kansas City, and Las Vegas each have three stores. These markets can represent important areas for competitor monitoring because multiple locations create opportunities to compare assortment, pricing, promotional activity, customer accessibility, and store-level positioning.
For organizations undertaking US Liquor Store Location Data Scraping, city-level records are particularly valuable because state-level totals can hide substantial differences between metropolitan areas. A retailer may have a strong presence in one city while having limited coverage elsewhere within the same state.
| Rank | City | State | Locations | Share of Total (%) | Estimated Store Density per 1M* | Market Position | Cumulative Locations | Cumulative Share (%) |
|---|---|---|---|---|---|---|---|---|
| 1 | Houston | Texas | 6 | 1.98 | --- | Highest identified city count | 6 | 1.98 |
| 2 | Orlando | Florida | 4 | 1.32 | --- | Major multi-store market | 10 | 3.30 |
| 3 | Miami | Florida | 4 | 1.32 | --- | Major multi-store market | 14 | 4.62 |
| 4 | Dallas | Texas | 3 | 0.99 | --- | Multi-store market | 17 | 5.61 |
| 5 | Raleigh | North Carolina | 3 | 0.99 | --- | Multi-store market | 20 | 6.60 |
| 6 | Seattle | Washington | 3 | 0.99 | --- | Multi-store market | 23 | 7.59 |
| 7 | Charlotte | North Carolina | 3 | 0.99 | --- | Multi-store market | 26 | 8.58 |
| 8 | Plano | Texas | 3 | 0.99 | --- | Multi-store market | 29 | 9.57 |
| 9 | Kansas City | Missouri | 3 | 0.99 | --- | Multi-store market | 32 | 10.56 |
| 10 | Las Vegas | Nevada | 3 | 0.99 | --- | Multi-store market | 35 | 11.55 |
| 11 | Other identified cities | U.S. | 210 | 69.31 | --- | Remaining locations | 245* | --- |
*City-level population figures were not supplied, so population-based density is not calculated. The supplied dataset identifies 245 cities; city counts in the table are based on the provided leading-city information.
A structured Total Wine & More Location Dataset can include fields such as store name, street address, city, state, ZIP code, telephone number, latitude, longitude, complete address, country, and last updated date.
For example, the supplied records include locations in Novi and Lansing, Michigan; Daly City, San Diego, Laguna Hills, Long Beach, Valencia, and San Jose, California; Orlando, Florida; and Kennesaw, Georgia.
Geographic coordinates are especially useful for mapping and spatial analysis. Latitude and longitude can help businesses calculate distances, create store heat maps, measure market overlap, identify geographic gaps, and connect retail locations with demographic or economic datasets.
The presence of a standardized last-updated date also supports data freshness monitoring. In the supplied records, the example locations were updated on August 12, 2026, providing a common reference date for the analysis.
The supplied analysis identifies numerous states and territories without Total Wine & More stores, including Idaho, New Hampshire, Puerto Rico, Hawaii, Alaska, South Dakota, Ohio, Arkansas, Vermont, Alabama, Utah, Iowa, Mississippi, West Virginia, Wyoming, American Samoa, Oregon, Guam, Maine, Rhode Island, Montana, U.S. Virgin Islands, Northern Mariana Islands, Pennsylvania, and North Dakota.
The absence of locations in these markets can be useful for geographic gap analysis. However, an absence of stores does not by itself indicate an expansion opportunity. Businesses should combine location gaps with regulatory requirements, consumer demand, competition, logistics, operating costs, and market economics before drawing conclusions.
Location intelligence can support several analytical workflows. Retailers can benchmark geographic expansion, distributors can identify areas requiring additional coverage, and market researchers can measure competitor concentration.
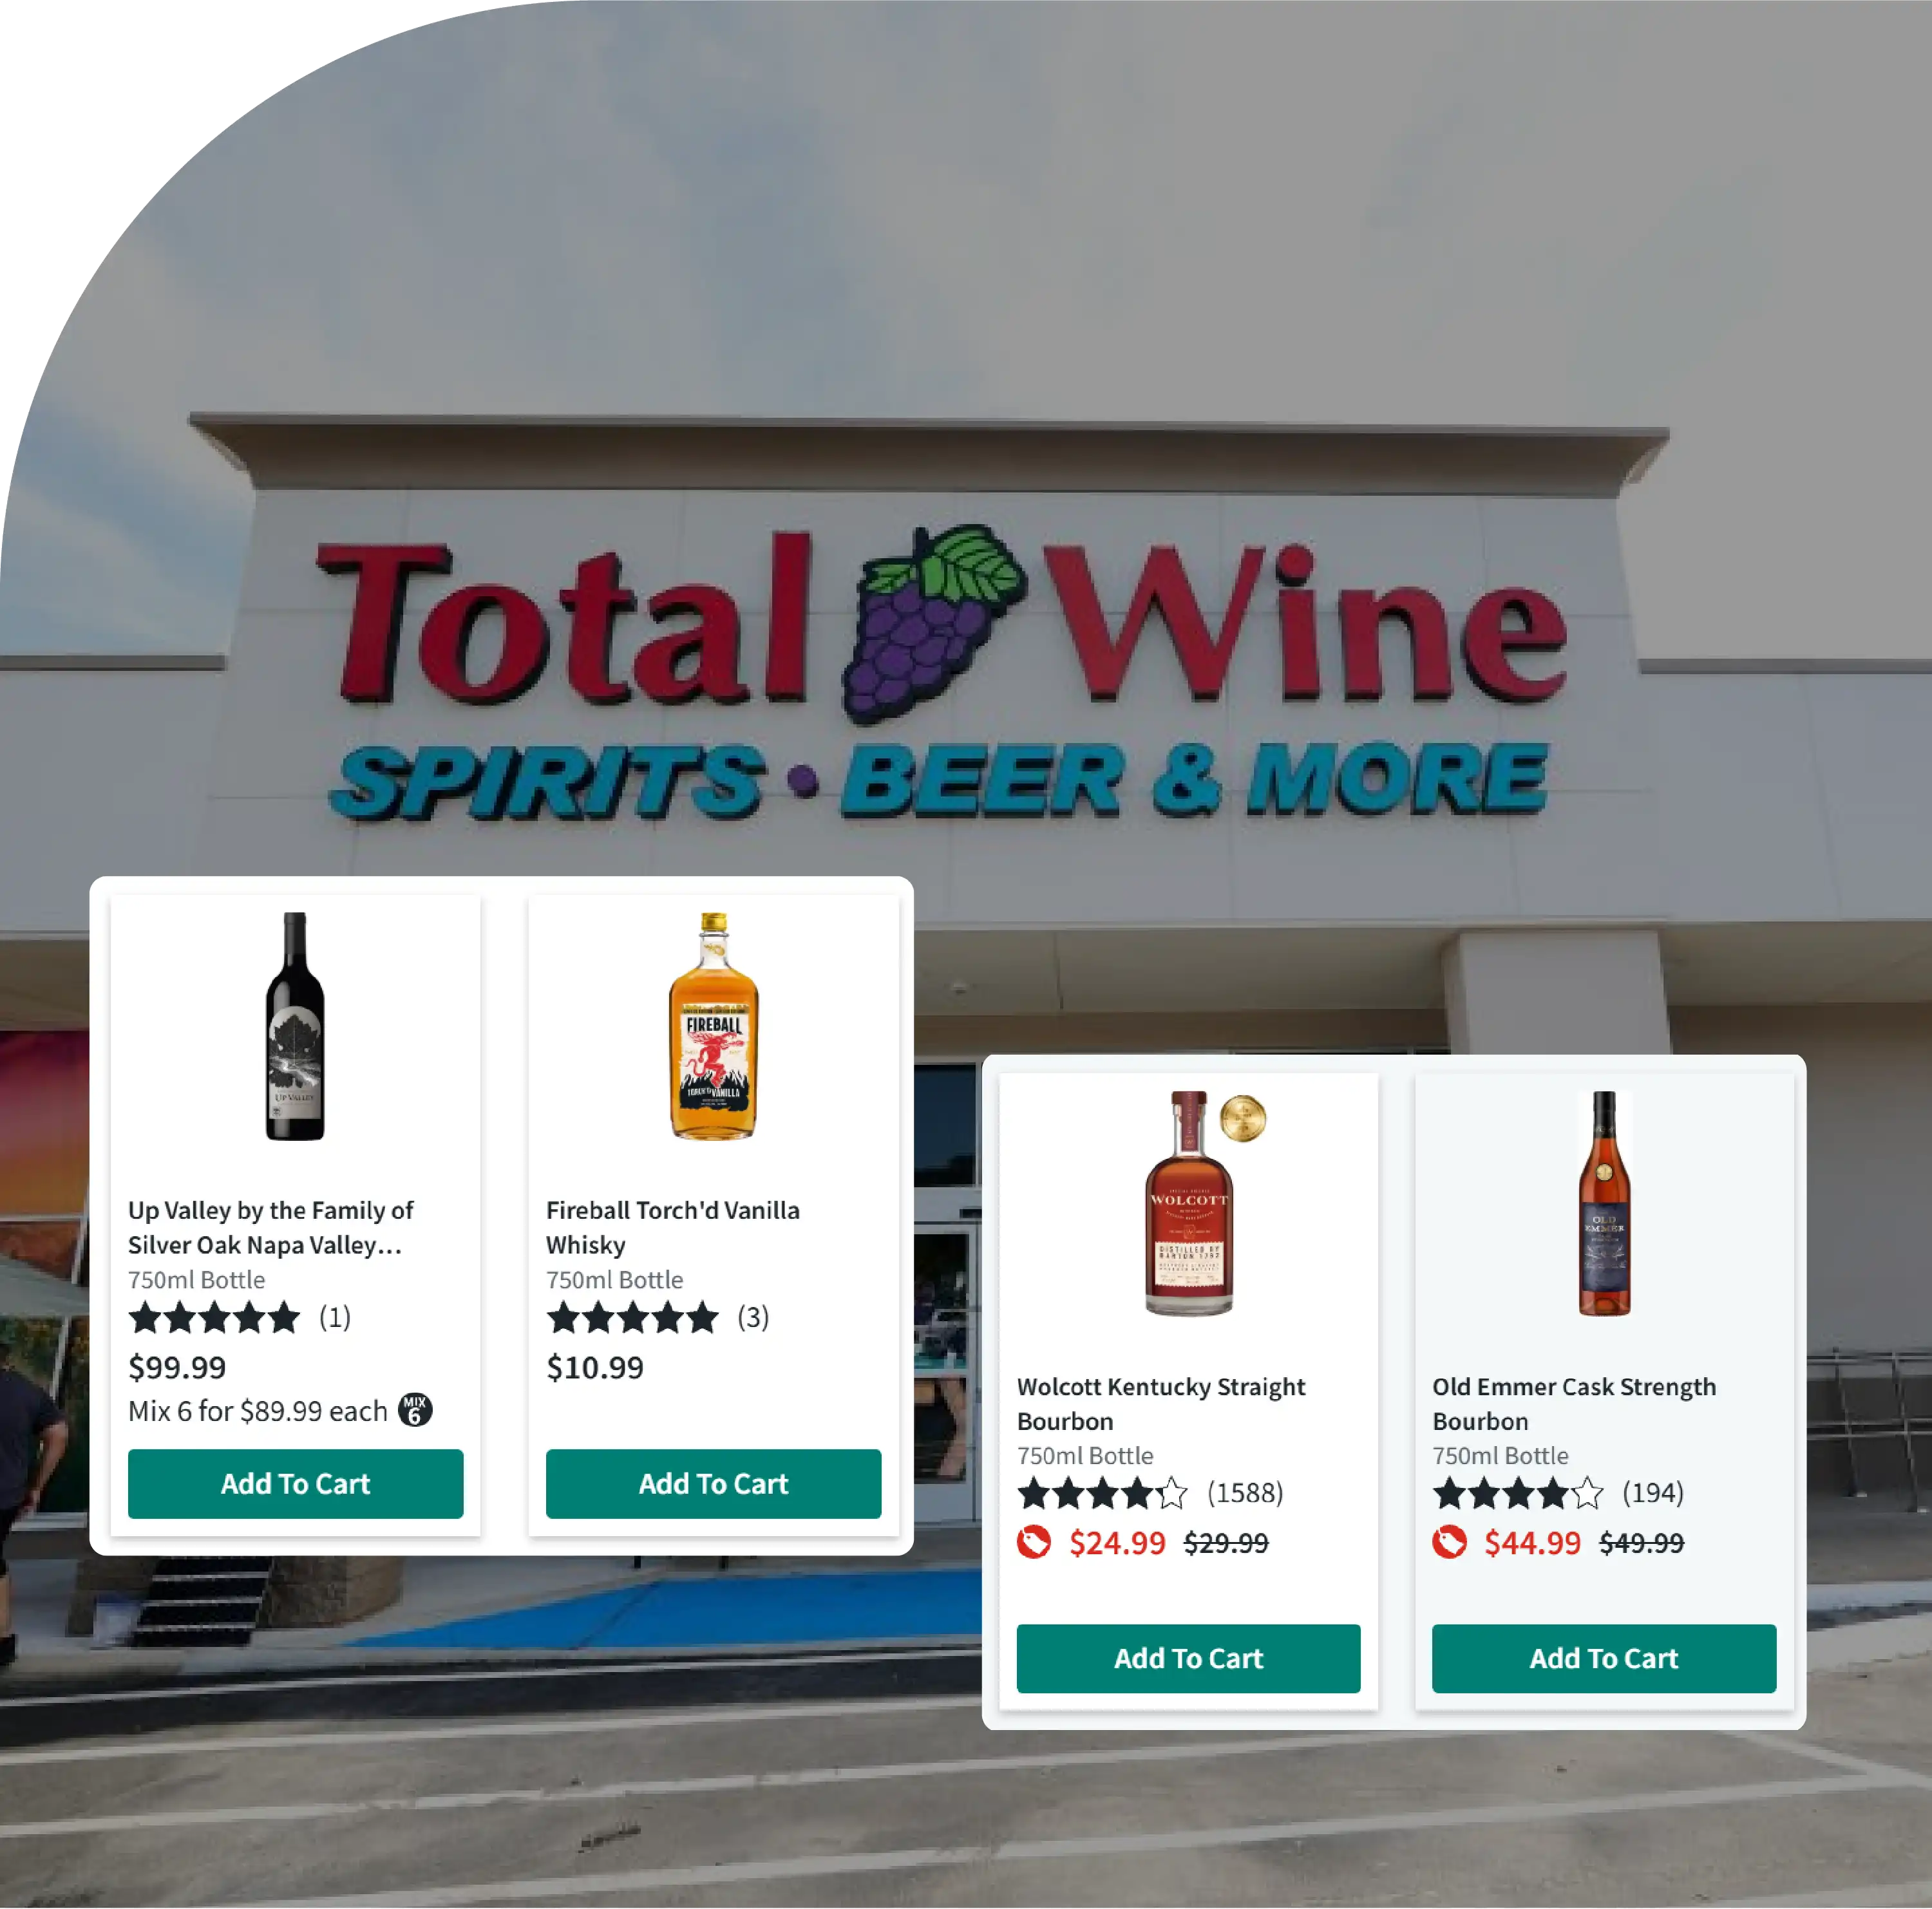
Businesses performing Liquor Data Scraping in the USA can combine store locations with menu or product catalogs, pricing, promotions, ratings, operating hours, and availability information. This creates a broader view of retail market conditions rather than relying solely on store counts.
Similarly, Total Wine Data Scraping for USA can help construct recurring datasets for geographic benchmarking, territory analysis, retail intelligence, and market monitoring. When collected consistently, historical snapshots can reveal store openings, closures, relocations, changing market concentration, and evolving geographic footprints.
The August 12, 2026 analysis identifies 303 Total Wine & More stores across 245 U.S. cities, with California leading at 49 locations, followed by Florida at 47 and Texas at 42. These three states collectively represent approximately 46% of the identified network.
The distribution demonstrates that Total Wine & More's physical presence is concentrated in selected states and metropolitan markets. Houston leads the identified cities with six locations, while Orlando and Miami each have four.
For businesses analyzing liquor retail markets, a structured Total Wine Dataset can provide a foundation for store mapping, competitor benchmarking, territory analysis, and market expansion research. Combining location intelligence with product, pricing, promotional, and availability information can create a more comprehensive retail intelligence framework.
Organizations can also integrate Liquor Price Data Scraping Services with location datasets to examine price differences across cities, states, stores, and competing retailers. A recurring data collection process can further support historical price tracking and promotional analysis.
Finally, a Liquor Price Web Scraping API can make structured retail information available to dashboards, analytics platforms, business intelligence systems, and internal applications. Together, location and pricing intelligence can help organizations monitor the rapidly changing U.S. liquor retail landscape using consistent, structured, and refreshable data.
Are you in need of high-class scraping services? Food Data Scrape should be your first point of call. We are undoubtedly the best in Food Data Aggregator and Mobile Grocery App Scraping service and we render impeccable data insights and analytics for strategic decision-making. With a legacy of excellence as our backbone, we help companies become data-driven, fueling their development. Please take advantage of our tailored solutions that will add value to your business. Contact us today to unlock the value of your data.



