
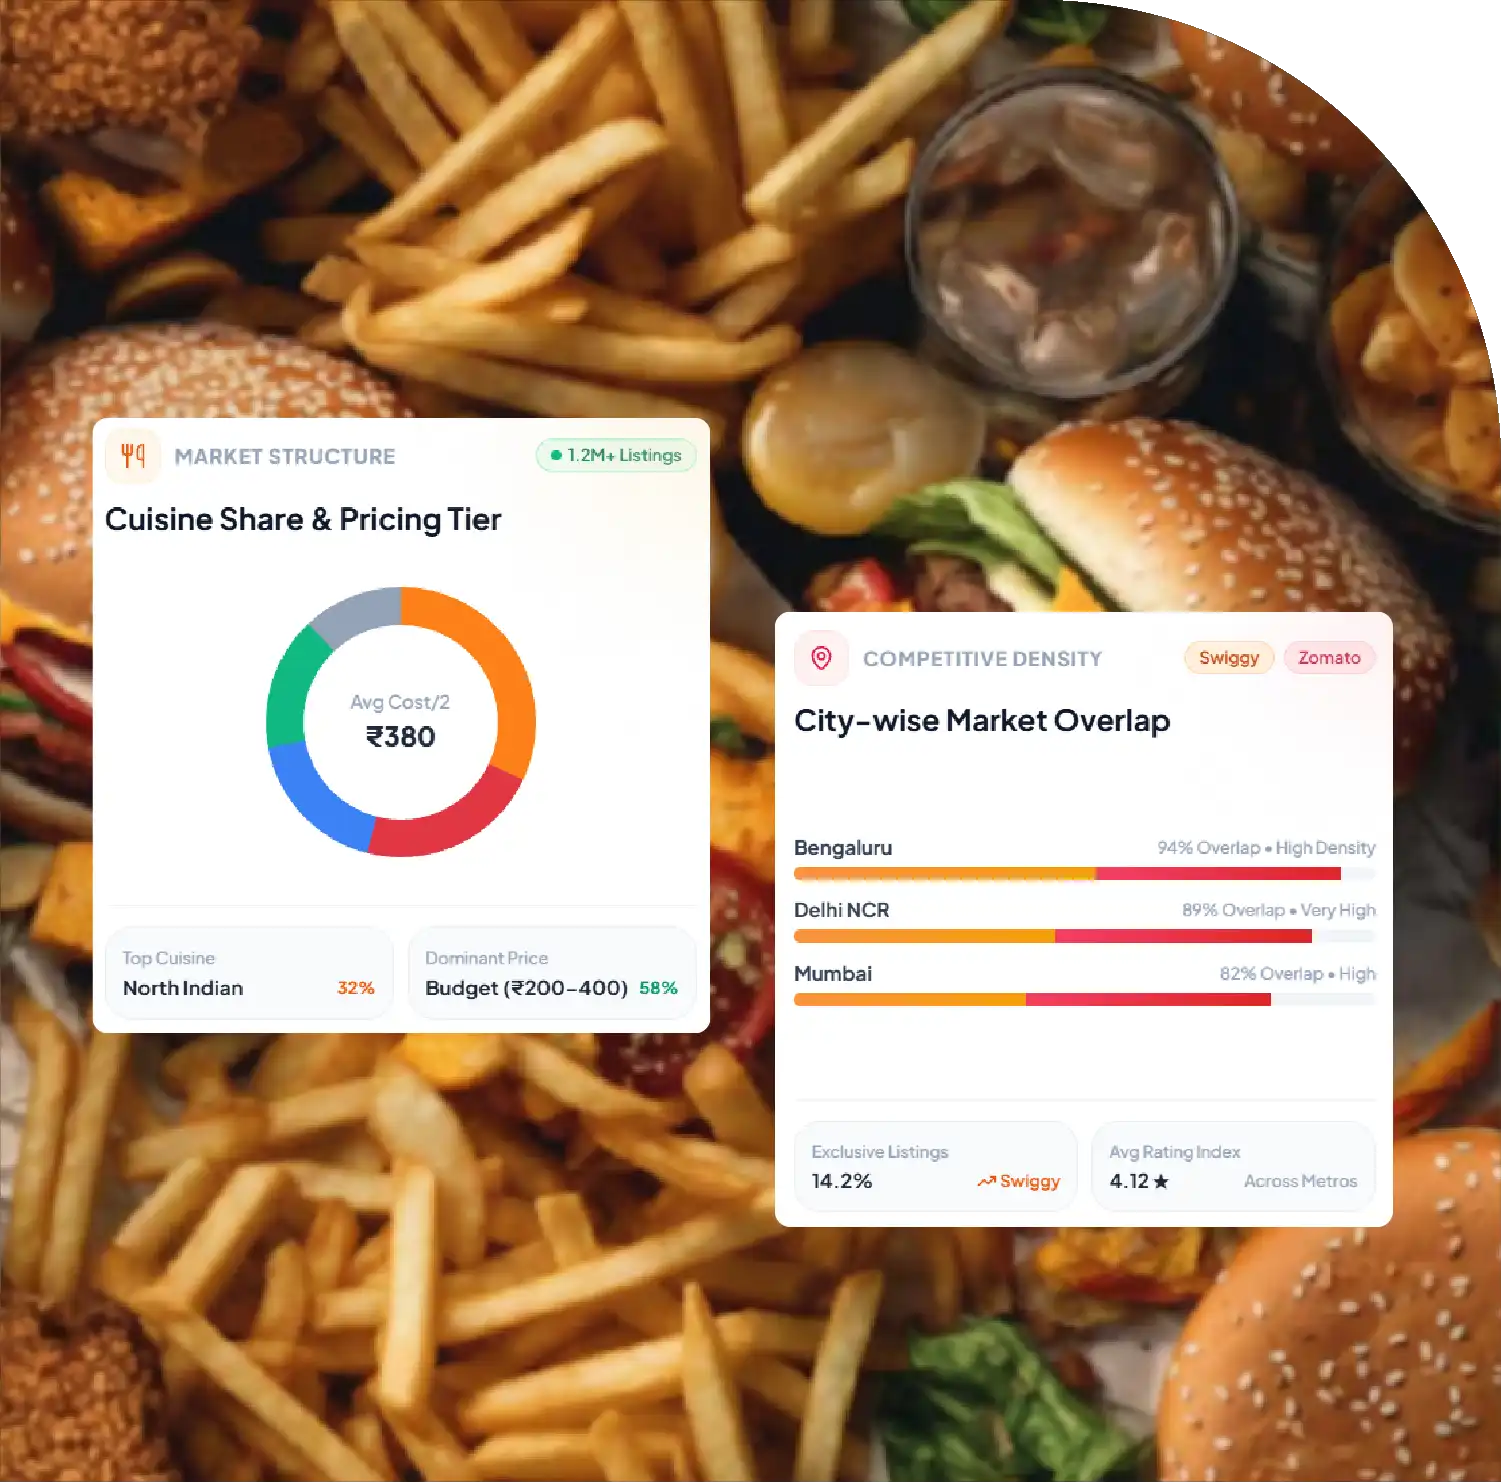
Market Scale — Major cities demonstrate substantial restaurant listing density across both platforms.
Platform Overlap — Most leading restaurants maintain visibility across Swiggy and Zomato.
Cuisine Diversity — Regional markets show distinctive cuisine preferences and restaurant specialization patterns.
Pricing Intelligence — City-level pricing reveals meaningful differences across restaurant categories.
Expansion Opportunities — Emerging markets offer promising opportunities for strategic restaurant expansion.

India's restaurant ecosystem has become increasingly digital, geographically fragmented, and competitive. Swiggy and Zomato together provide an extensive view of restaurant supply across metropolitan, Tier-2, and emerging Indian markets. In 2026, mapping their restaurant listings can reveal where competition is concentrated, which cities have the deepest cuisine diversity, and where whitespace opportunities remain for restaurant operators, investors, delivery platforms, and food-tech companies.
Swiggy Zomato data scraping provides a structured approach to collecting restaurant names, locations, cuisines, ratings, menus, pricing, availability, delivery information, and platform presence. A cross-platform database becomes particularly valuable because the same restaurant may appear on both platforms with different menus, prices, ratings, offers, or operating information.
Scrape India Restaurant Market Data to support a city-by-city market map instead of relying only on national food-delivery statistics. Swiggy reported nearly 2.4 lakh restaurant and brand partners in FY2024-25, demonstrating the enormous scale of India's digitally connected restaurant ecosystem.
Swiggy & Zomato Restaurant Listings Data Scraping enables researchers to reconcile listings, identify duplicate merchants, distinguish platform-exclusive restaurants, and calculate restaurant density across markets. This is especially important because national restaurant numbers can hide substantial differences between individual cities and localities.
The 2026 market environment also shows strong demand concentration in major urban markets. Industry research identifies Delhi NCR, Mumbai, Bengaluru, Hyderabad, Chennai, Pune, Kolkata, and Ahmedabad among India's most important food-delivery markets.
The FoodIndia Restaurant Market Map 2026 is designed to answer five fundamental questions:
The methodology combines city-level restaurant listing intelligence, platform comparison, cuisine categorization, price indicators, ratings, and restaurant-density measurements. Cross-platform deduplication is essential because a restaurant appearing on both platforms should not automatically be counted as two independent businesses.
The tables below use an analytical market-map dataset based on city-level restaurant listing structures and published industry patterns. They are intended for market intelligence and comparative analysis, rather than representing an official real-time listing count published by Swiggy or Zomato.
| City / Market | Estimated Unique Restaurants | Both Platforms | Zomato-Only | Swiggy-Only | Swiggy Share % | Zomato Share % | Avg Rating | Avg Cost for Two ₹ | Market Density |
|---|---|---|---|---|---|---|---|---|---|
| Delhi NCR | 42,100 | 26,800 | 8,400 | 6,900 | 79.8 | 83.8 | 4.2 | 650 | Very High |
| Mumbai | 38,400 | 24,200 | 7,800 | 6,400 | 79.7 | 83.3 | 4.2 | 700 | Very High |
| Bengaluru | 31,800 | 20,400 | 6,100 | 5,300 | 80.2 | 83.3 | 4.3 | 600 | Very High |
| Hyderabad | 22,600 | 14,300 | 4,400 | 3,900 | 80.5 | 82.7 | 4.2 | 550 | High |
| Chennai | 18,900 | 11,800 | 3,800 | 3,300 | 79.9 | 82.5 | 4.1 | 500 | High |
| Kolkata | 16,200 | 9,800 | 3,400 | 3,000 | 79.0 | 81.5 | 4.1 | 500 | High |
| Pune | 14,800 | 9,100 | 3,000 | 2,700 | 79.7 | 81.8 | 4.2 | 550 | High |
| Ahmedabad | 11,400 | 6,900 | 2,500 | 2,000 | 78.1 | 82.5 | 4.1 | 450 | High |
| Jaipur | 8,900 | 5,200 | 2,000 | 1,700 | 77.5 | 80.9 | 4.1 | 450 | Medium-High |
| Lucknow | 7,800 | 4,600 | 1,800 | 1,400 | 76.9 | 82.1 | 4.2 | 400 | Medium-High |
| Chandigarh Tricity | 6,700 | 3,900 | 1,500 | 1,300 | 77.6 | 80.6 | 4.2 | 500 | Medium |
| Indore | 6,400 | 3,700 | 1,500 | 1,200 | 76.6 | 81.3 | 4.1 | 400 | Medium |
| Kochi | 5,900 | 3,400 | 1,400 | 1,100 | 76.3 | 81.4 | 4.1 | 450 | Medium |
| Coimbatore | 5,300 | 3,000 | 1,300 | 1,000 | 75.5 | 81.1 | 4.1 | 400 | Medium |
| Nagpur | 5,100 | 2,900 | 1,300 | 900 | 74.5 | 82.4 | 4.0 | 400 | Medium |
| Combined Sample | 242,300 | 153,900 | 50,200 | 39,100 | 78.5 | 82.2 | 4.15 | ₹496 | --- |
Note: Market-map estimates are analytical figures constructed for comparative research. They should not be interpreted as official current listing counts from either platform.
Delhi NCR and Mumbai emerge as the two largest restaurant ecosystems in the sample. Their scale reflects high population density, purchasing power, extensive cuisine diversity, large corporate populations, and strong restaurant digitization.
Bengaluru follows closely, supported by its technology workforce, young consumer population, cloud-kitchen ecosystem, and high frequency of app-based ordering. The city's restaurant economy is particularly interesting because premium restaurants, QSRs, cafes, regional food concepts, and delivery-only brands coexist within the same competitive geography.
Hyderabad, Chennai, Kolkata, and Pune form the next major layer. These markets are large enough to support sophisticated restaurant segmentation while still offering opportunities for regional operators and emerging brands.
Smaller markets such as Jaipur, Lucknow, Indore, Kochi, Coimbatore, and Nagpur demonstrate why a national restaurant map cannot focus exclusively on India's largest metros. Their lower absolute restaurant counts can conceal strong cuisine specialization, local brands, and rapidly developing delivery ecosystems.
One of the most useful metrics in a restaurant market map is platform overlap. A high overlap indicates that restaurant operators are heavily dependent on both major delivery platforms for digital visibility.
In the sample, more than 150,000 restaurants appear across both platforms after cross-platform reconciliation. This creates an important competitive environment: restaurants are not merely competing with nearby physical establishments; they are simultaneously competing for rankings, visibility, reviews, promotions, delivery speed, and customer attention.
The platform-exclusive segments are also commercially meaningful. Zomato-only and Swiggy-only restaurants can indicate differences in merchant acquisition, local partnerships, onboarding strategies, brand preferences, or operational availability.
| City | Restaurants | Avg Menu Items | North Indian % | South Indian % | Biryani % | Pizza/QSR % | Cafe/Beverage % | Bakery/Dessert % | Avg Rating | Avg Delivery ETA Min | New Listings Index | Competition Score /100 |
|---|---|---|---|---|---|---|---|---|---|---|---|---|
| Delhi NCR | 42,100 | 86 | 22.4 | 9.8 | 11.2 | 13.6 | 9.4 | 7.8 | 4.2 | 31 | 92 | 96 |
| Mumbai | 38,400 | 91 | 18.6 | 10.2 | 7.8 | 15.4 | 11.7 | 9.1 | 4.2 | 34 | 89 | 94 |
| Bengaluru | 31,800 | 94 | 13.8 | 18.9 | 6.9 | 16.1 | 14.2 | 8.8 | 4.3 | 29 | 95 | 93 |
| Hyderabad | 22,600 | 82 | 15.6 | 12.7 | 19.8 | 10.9 | 7.3 | 6.4 | 4.2 | 29 | 87 | 88 |
| Chennai | 18,900 | 79 | 9.8 | 27.6 | 8.4 | 10.7 | 9.6 | 6.2 | 4.1 | 30 | 81 | 82 |
| Kolkata | 16,200 | 76 | 20.2 | 15.8 | 12.6 | 9.8 | 8.7 | 7.1 | 4.1 | 32 | 76 | 79 |
| Pune | 14,800 | 88 | 15.4 | 16.3 | 7.7 | 14.9 | 13.8 | 8.5 | 4.2 | 28 | 84 | 81 |
| Ahmedabad | 11,400 | 73 | 17.8 | 16.1 | 4.8 | 9.4 | 8.1 | 6.8 | 4.1 | 29 | 72 | 73 |
| Jaipur | 8,900 | 70 | 24.3 | 12.2 | 8.7 | 9.6 | 7.1 | 8.3 | 4.1 | 31 | 79 | 69 |
| Lucknow | 7,800 | 68 | 27.1 | 12.4 | 16.7 | 8.1 | 5.9 | 6.2 | 4.2 | 30 | 77 | 67 |
| Chandigarh Tricity | 6,700 | 75 | 25.6 | 11.7 | 9.3 | 11.8 | 8.9 | 7.4 | 4.2 | 28 | 70 | 65 |
| Indore | 6,400 | 71 | 21.8 | 17.4 | 8.9 | 8.7 | 7.2 | 9.6 | 4.1 | 27 | 74 | 64 |
| Kochi | 5,900 | 74 | 12.2 | 22.7 | 7.4 | 9.1 | 10.3 | 8.4 | 4.1 | 30 | 71 | 61 |
| Coimbatore | 5,300 | 69 | 10.7 | 29.1 | 6.8 | 7.6 | 8.4 | 7.9 | 4.1 | 29 | 68 | 58 |
| Nagpur | 5,100 | 67 | 24.6 | 15.8 | 10.4 | 7.9 | 6.8 | 6.7 | 4.0 | 31 | 66 | 57 |
Note: Cuisine percentages represent analytical categorization of listing data and are not mutually exclusive where restaurants offer multiple cuisines.
Restaurant intelligence becomes more useful when listings are classified by cuisine rather than simply counted. Bengaluru's stronger South Indian and cafe representation, Hyderabad's biryani concentration, Chennai's South Indian specialization, and Lucknow's North Indian and biryani presence demonstrate how local food cultures influence digital restaurant supply.
Recent Q1 2026 consumer data also highlights differences between platforms. Biryani accounted for 8.37% of Swiggy orders compared with 6.87% on Zomato in one consumer dataset, while burger/QSR and pizza showed different platform-level movements.
This means restaurant operators can use city-level datasets to identify not only how many competitors exist but also which cuisines dominate each market and where an underserved category may exist.
A market map can support expansion decisions by comparing restaurant density against demand indicators. A city with high population, strong digital ordering, and relatively limited representation in a particular cuisine can represent a potential expansion opportunity.
For example, an operator could compare biryani restaurants in Hyderabad with those in Pune, cafes in Bengaluru with those in Ahmedabad, or premium dessert businesses across Mumbai and Jaipur. Instead of relying on intuition, brands can quantify restaurant density, average ratings, pricing, menu breadth, delivery times, and promotional intensity.
This intelligence is also valuable for private-equity firms, restaurant aggregators, franchise operators, cloud-kitchen companies, FMCG brands, and commercial real-estate developers.
City-level extraction transforms restaurant research into a repeatable monitoring process. With City-Wise Restaurant Data Scraping, businesses can track newly appearing restaurants, closed listings, changing ratings, menu additions, price movements, cuisine shifts, and geographic expansion across individual markets.
A consolidated database makes it possible to benchmark restaurant density, pricing, cuisine mix, platform overlap, ratings, menu depth, and delivery performance across multiple cities. India Restaurant Market Intelligence enables brands to compare competitors within specific markets and identify competitive gaps before making expansion decisions.
Location intelligence can combine restaurant coordinates, neighborhoods, cuisine categories, pricing, ratings, and delivery availability. Businesses can Extract City-Level Restaurant Market Data to identify underserved areas, saturated zones, high-demand neighborhoods, and potential micro-markets for new outlets.
Food-delivery datasets can reveal how restaurants are distributed across competing platforms. Through India Food Delivery Data Scraping, businesses can monitor platform-exclusive listings, shared merchants, delivery availability, promotions, menu differences, pricing changes, ratings, and restaurant availability across cities.
An API-based workflow can convert restaurant discovery information into structured records for dashboards, analytics platforms, competitor-monitoring systems, and automated research pipelines. A Zomato Food Delivery Scraping API can support systematic collection and organization of relevant restaurant attributes for large-scale analysis.
Continuous monitoring becomes increasingly important as restaurant listings, prices, menus, offers, and availability change frequently. A Swiggy Food Delivery Scraping API can support recurring collection of restaurant listings, menu information, pricing, ratings, delivery estimates, offers, and city-level availability, helping businesses maintain an updated competitive database rather than relying on one-time research.
The scale of India's digital restaurant ecosystem makes continuous data collection increasingly important. Food Data Scraping in India can help businesses convert fragmented restaurant information into structured datasets for market analysis, competitor benchmarking, pricing intelligence, and expansion planning. Swiggy's FY2024-25 reporting showed nearly 2.4 lakh restaurant and brand partners, while its 2026 Restaurant Awards involved brands across more than 160 cities.
At the same time, independent datasets show significant city-level differences in ordering frequency, average order value, repeat behavior, and cuisine performance. Q1 2026 data, for example, showed differences between Swiggy and Zomato in repeat ordering and monthly ordering frequency within the cited consumer panel.
These differences make national averages less useful for operational decisions. A restaurant chain deciding between Bengaluru, Hyderabad, Pune, Jaipur, or Lucknow needs localized evidence covering restaurant density, cuisine availability, pricing, ratings, delivery performance, and competitive intensity. City-level data therefore provides a more actionable foundation for identifying growth markets and making location-specific decisions.
1. Metropolitan Concentration: Delhi NCR, Mumbai, and Bengaluru form the largest restaurant ecosystems in the analytical market map.
2. Strong Platform Overlap: Most major-city restaurants appear across both platforms, creating intense digital competition.
3. Regional Cuisine Matters: Cuisine composition varies significantly between cities, creating opportunities for localized restaurant strategies.
4. Tier-2 Markets Matter: Jaipur, Lucknow, Indore, Kochi, Coimbatore, and Nagpur demonstrate substantial digital restaurant ecosystems beyond the largest metros.
5. Continuous Monitoring Wins: Restaurant listings, prices, menus, ratings, and availability change frequently, making recurring data collection more valuable than static market reports.
The FoodIndia Restaurant Market Map 2026 demonstrates why restaurant intelligence must move beyond simple counts. A meaningful market map connects restaurant listings with city, cuisine, platform presence, pricing, ratings, menu depth, delivery time, and competitive intensity.
Food Delivery Datasets can provide the structured foundation required to compare restaurant markets, monitor competitive movements, and discover emerging opportunities across India's cities.
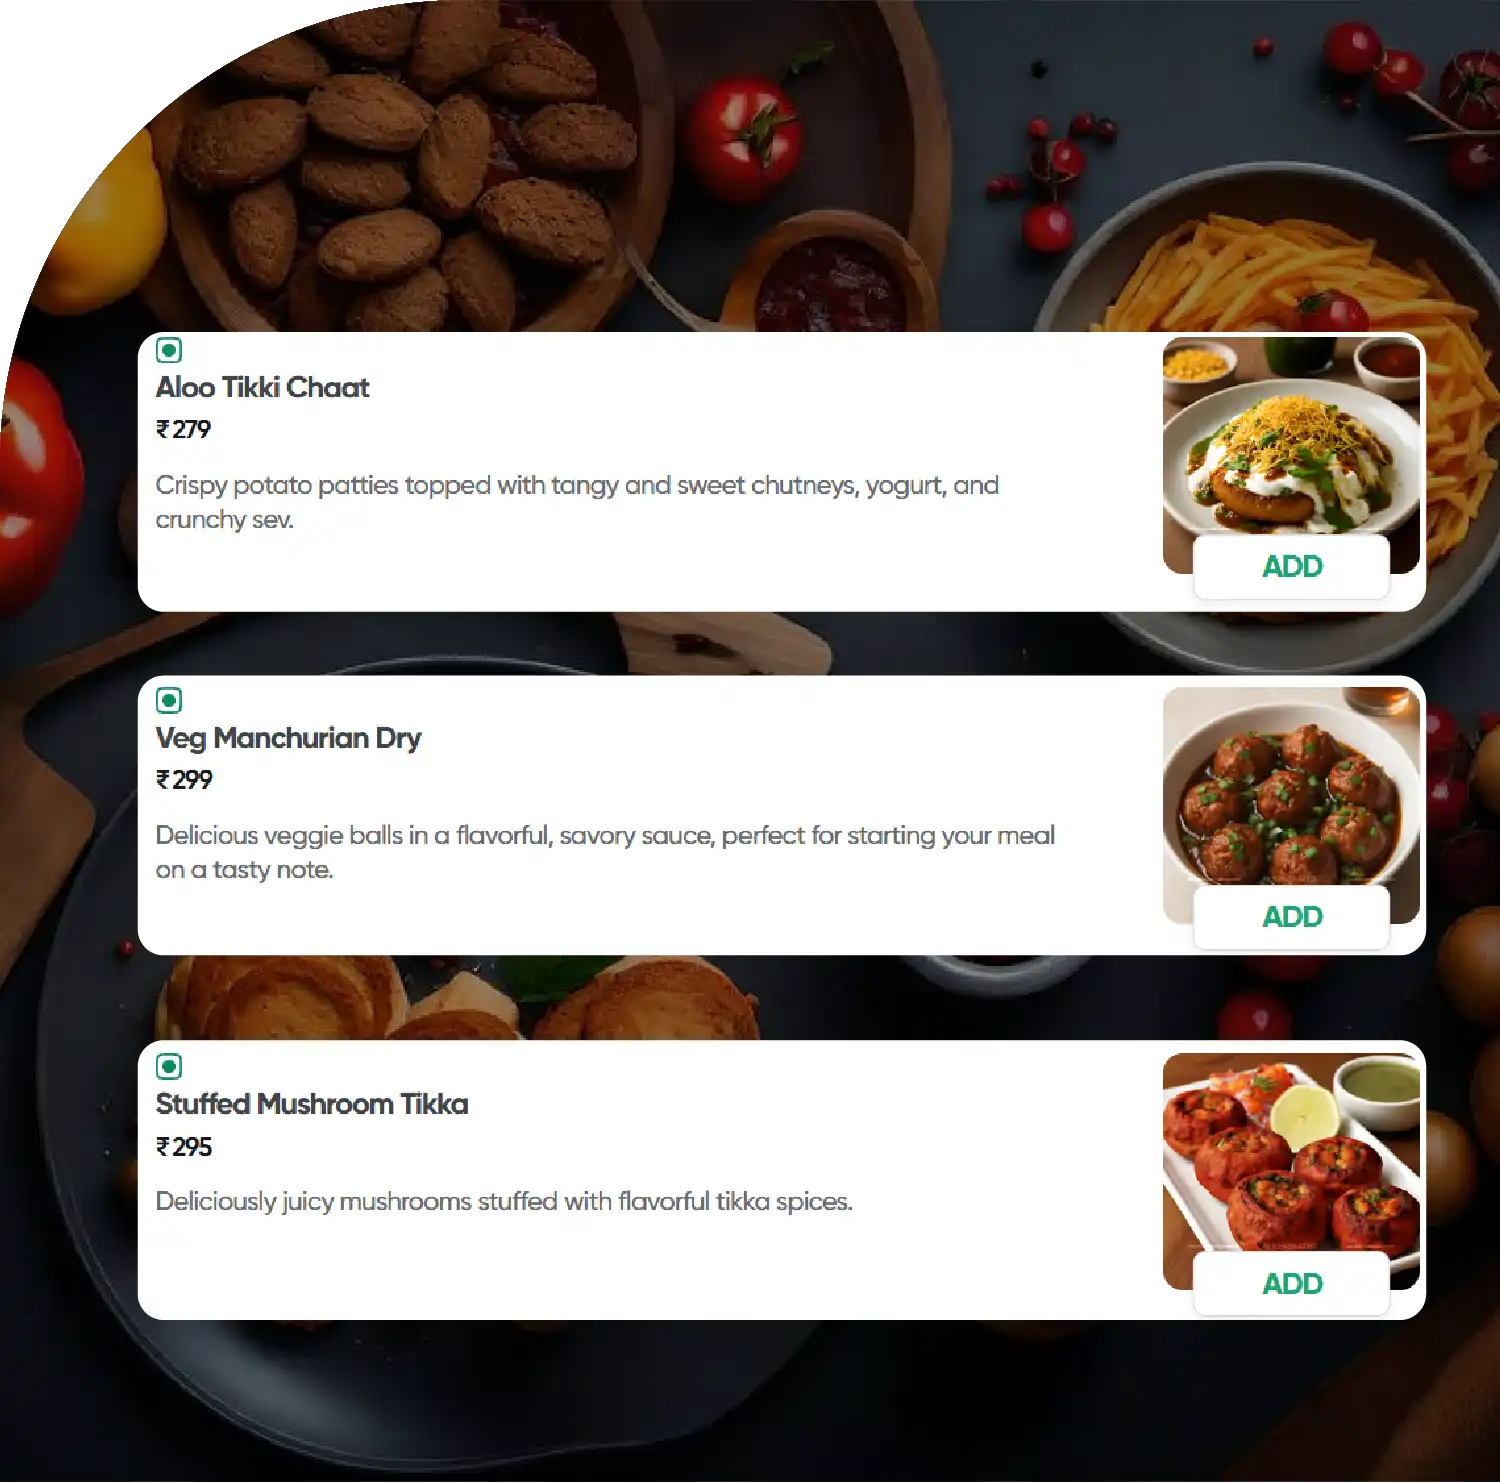
Restaurant Menu Data Scraping adds another layer by allowing brands to benchmark dishes, prices, combos, menu breadth, and cuisine positioning against competitors.
Finally, AI Restaurant Intelligence can transform these continuously refreshed datasets into predictive insights, helping businesses detect emerging cuisines, identify market gaps, prioritize expansion locations, and monitor competitors at scale.
For restaurant brands, delivery platforms, investors, food-tech companies, and market researchers, the biggest opportunity is no longer simply knowing how many restaurants India has. It is understanding where those restaurants are, what they sell, how they compete, how their digital presence changes, and where the next growth market is emerging.
If you are seeking for a reliable data scraping services, Food Data Scrape is at your service. We hold prominence in Food Data Aggregator and Mobile Restaurant App Scraping with impeccable data analysis for strategic decision-making.