
India's Food-Service Market Growth: India's food-service market is projected to reach ₹7.76 lakh crore by FY28, highlighting the scale of opportunity for restaurant brands and suppliers.
Organised Food-Service Expansion: Organised food-service businesses are growing faster than the overall market, with a projected 13.2% CAGR through FY28 compared with 8.1% overall.
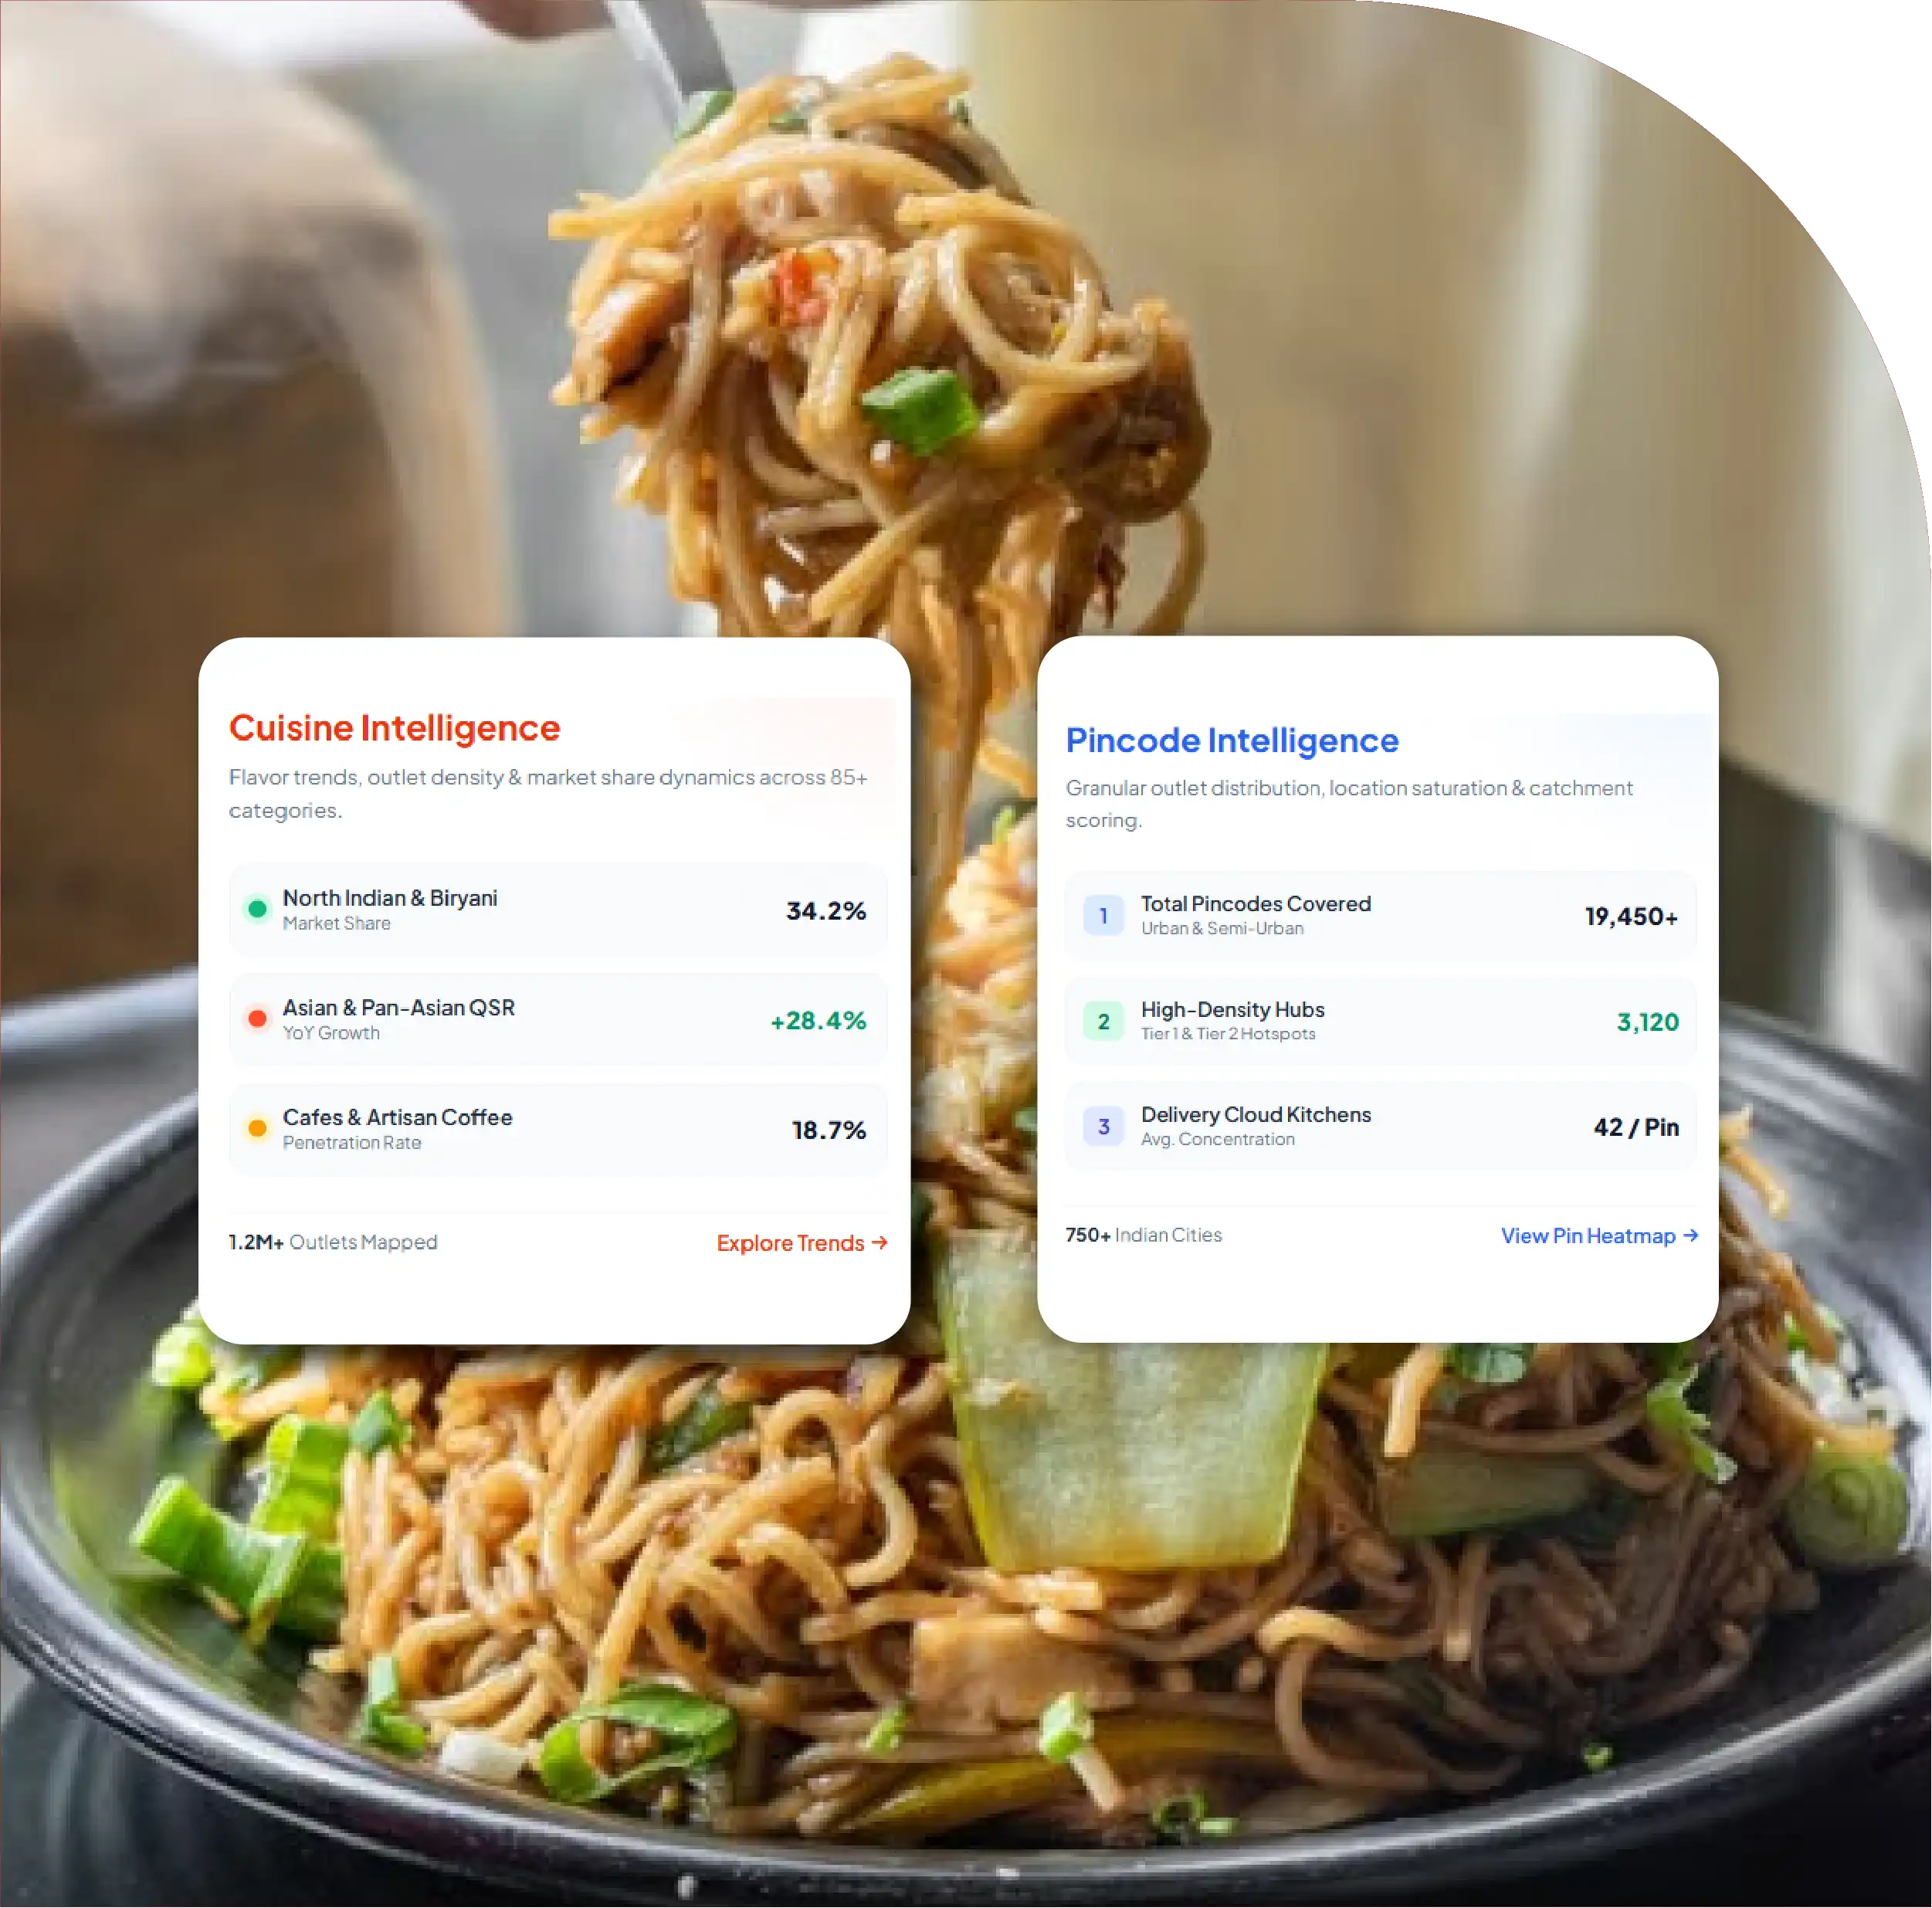
Cuisine and Pincode Mapping: Cuisine and pincode mapping reveals local market gaps, helping identify areas with high outlet density and underserved locations.
Multi-Source Restaurant Data: Restaurant data combines multiple public sources, including Zomato, Swiggy, Google Maps and chain store locators, to improve outlet coverage.

Restaurant outlet data for India is a structured list of food-service outlets with name, cuisine, address, pincode, coordinates, chain flag, price band and ratings. Brands, distributors and QSR teams use it to count outlets by cuisine in every pincode, spot gaps and plan sales routes. Most of it is built from public listings, then cleaned and de-duplicated.
India's food-service market is large and still mostly informal. The National Restaurant Association of India (NRAI) values it at Rs 5,69,487 crore in FY24 and expects Rs 7,76,511 crore by FY28 NRAI IFSR 2024, via Restaurant India:. Yet no public register tells you how many South Indian outlets or bakeries sit in one pincode. That gap is why teams buy or build restaurant outlet data.
This report explains how the market is structured, how outlet records are built from Zomato, Swiggy, Google Maps and chain store locators, and how to read cuisine, price-band, veg/non-veg and rating signals at pincode level. Every market figure is cited. Where we show outlet numbers, they are either published platform figures or clearly marked indicative estimates, not counts from a live Food Data Scrape dataset.
India's eating-out market has grown fast, but its shape has changed slowly. The 2019 edition of the NRAI India Food Services Report put the organised segment at only 35% of a Rs 4.23 lakh crore market in 2018-19 via Packaging South Asia: Most outlets were, and still are, standalone dhabas, tea stalls, sweet shops and family restaurants.
The organised side is catching up. NRAI's 2024 report expects the organised segment to grow at a 13.2% CAGR to FY28, against 8.1% for the market overall . The Swiggy and Kearney 'How India Eats' study says the organised segment will drive over 60% of growth to 2030 via Outlook Business:
For anyone selling to restaurants, this mix shapes how restaurant outlet data must be built. A chain store locator covers a few thousand branded outlets. The long tail of independents only shows up in delivery apps, map listings and local directories. Good restaurant outlet data has to join both worlds.
| Year | Indian food-service market (sourced) | Organised share or growth | Source |
|---|---|---|---|
| FY2018-19 | Rs 4.23 lakh crore | Organised 35% of market | NRAI IFSR 2019 |
| 2019 | USD 49 billion | – | Swiggy–Kearney |
| FY24 | Rs 5,69,487 crore | Organised 43.8% of market, projected 52.9% by 2028 | NRAI IFSR 2024 ; organised share via MediaBrief: |
| 2025 (estimate) | USD 78 billion | Organised to drive over 60% of growth to 2030 | Swiggy–Kearney |
| FY28 (projection) | Rs 7,76,511 crore | Organised CAGR 13.2% vs 8.1% overall | NRAI IFSR 2024 |
| Q1 FY27 (Apr-Jun 2026) | Swiggy: 265.8 thousand average monthly transacting restaurant partners, up from 255.4 thousand in Q1 FY26 | Delivery-active outlets on one platform, not the full outlet universe | Swiggy Q1 FY2027 shareholder letter |
Note: the NRAI and Kearney figures use different methods and currencies, so read them as separate estimates, not one time series.
Restaurant outlet data starts with a clear unit: one physical outlet at one address. A single kitchen can appear as a dine-in listing, two delivery-app listings and a map pin. A brand can run a cloud kitchen under five virtual names. Without rules, you count the same outlet many times.
Useful restaurant outlet data separates the business from the place. The brand or legal name sits in one field, the outlet's address and pincode in another, and its coordinates in a third. Outlet type, such as QSR, casual dining, cafe, bakery, sweet shop, bar or cloud kitchen, is a separate tag from cuisine.
Delivery platforms show how many outlets are active online. Swiggy reports 265.8 thousand average monthly transacting restaurant partners in Q1 FY27, up from 255.4 thousand a year earlier, and 59 thousand monthly active Dineout restaurants (Swiggy Q1 FY2027 shareholder letter: . Zomato's comparable figures appear in Eternal's quarterly shareholder letters . Those are platform partners, not the total universe, because many outlets are offline-only. Restaurant outlet data has to add map listings and locators to reach them.
| Restaurant outlet data field | What it holds | Typical public source |
|---|---|---|
| outlet_id | Internal ID after de-duplication | Created during matching |
| outlet_name / brand_name | Listing name and parent brand | Delivery apps, map listings, store locators |
| outlet_type | QSR, casual dining, cafe, bakery, bar, cloud kitchen | Listing category, menu signals |
| cuisines | One or more cuisine tags | Delivery apps, map categories |
| address, locality, city | Full street address and locality | All listing sources |
| pincode | Six-digit India Post PIN code | Listing address or reverse geocoding |
| latitude, longitude | Outlet coordinates | Map listings, store locators |
| chain_flag, outlet_count_brand | Whether the brand runs more than one outlet | Derived from brand matching |
| price_band, veg_flag | Cost-for-two band, pure-veg indicator | Delivery and dining apps |
| rating, review_count | Average public rating and number of reviews | Apps and map listings |
Restaurant outlet data in India is usually assembled from four kinds of public source. Each adds something the others miss, so the work is in combining them carefully.
De-duplication then links records that describe the same outlet. Matching uses a cleaned name, distance between coordinates, phone-free address tokens and brand rules. A listing called 'XYZ Biryani – Koramangala' on one app and 'XYZ Biryani House' 40 metres away on a map is likely one outlet; a review of borderline matches keeps error rates visible.
Pincode assignment uses the address first. If the pin is missing or does not match the locality, the coordinates are checked against pincode boundaries or the nearest post office area. Mismatches are flagged instead of being silently fixed. Collection of restaurant outlet data follows each site's robots.txt, terms of service and rate limits, staying at public business-listing level.
| Restaurant outlet data step | What happens | Quality check | What the client receives |
|---|---|---|---|
| 1. Collect | Pull public listings per city and source | Coverage by city vs prior run | Record counts by city and source, reported per run |
| 2. Normalise | Clean names, addresses, cuisine labels | Share of records with valid pincode | Pincode validity rate, reported per delivery |
| 3. Match | Link same outlet across sources | Manual review sample of match pairs | Match-review notes for borderline pairs |
| 4. Geocode | Assign pincode and coordinates | Address vs coordinate pincode agreement | Address vs coordinate agreement rate, flagged rows |
| 5. Enrich | Add chain flag, outlet type, price band | Chain list checked against store locators | Chain list and outlet-type tags |
| 6. Deliver | CSV, JSON, API or dashboard | Record count and field fill rates | Field dictionary and fill rates with each file |
Cuisine tags are the messiest part of restaurant outlet data. One app may say 'North Indian, Mughlai, Chinese' while a map listing just says 'Restaurant'. A fixed taxonomy maps raw labels to a short, stable list so that counts by pincode can be compared over time.
Demand is shifting inside that list. The Swiggy–Kearney study reports hyper-regional cuisines such as Goan, Bihari and Pahari growing two to eight times faster than mainstream cuisines, and Korean food showing a 17x growth index . A taxonomy needs room for these sub-cuisines without breaking the top-level view.
Price band, veg/non-veg and ratings add depth to restaurant outlet data. Cost for two separates a Rs 300 dosa place from a Rs 2,000 bar. A pure-veg flag matters for dairy, oil and meat suppliers. Review count works as a rough activity signal, though it is not a sales figure.
| Top-level cuisine group | Example raw labels mapped | Why suppliers care | Public signal or how it is counted |
|---|---|---|---|
| North Indian | Punjabi, Mughlai, tandoor | Dairy, ghee, flour, tandoor gas | Counted per pincode in each run; often the most common tag in metros |
| South Indian | Dosa, idli, Chettinad, Andhra | Rice, batter, filter coffee | Counted per pincode; dense in southern cities |
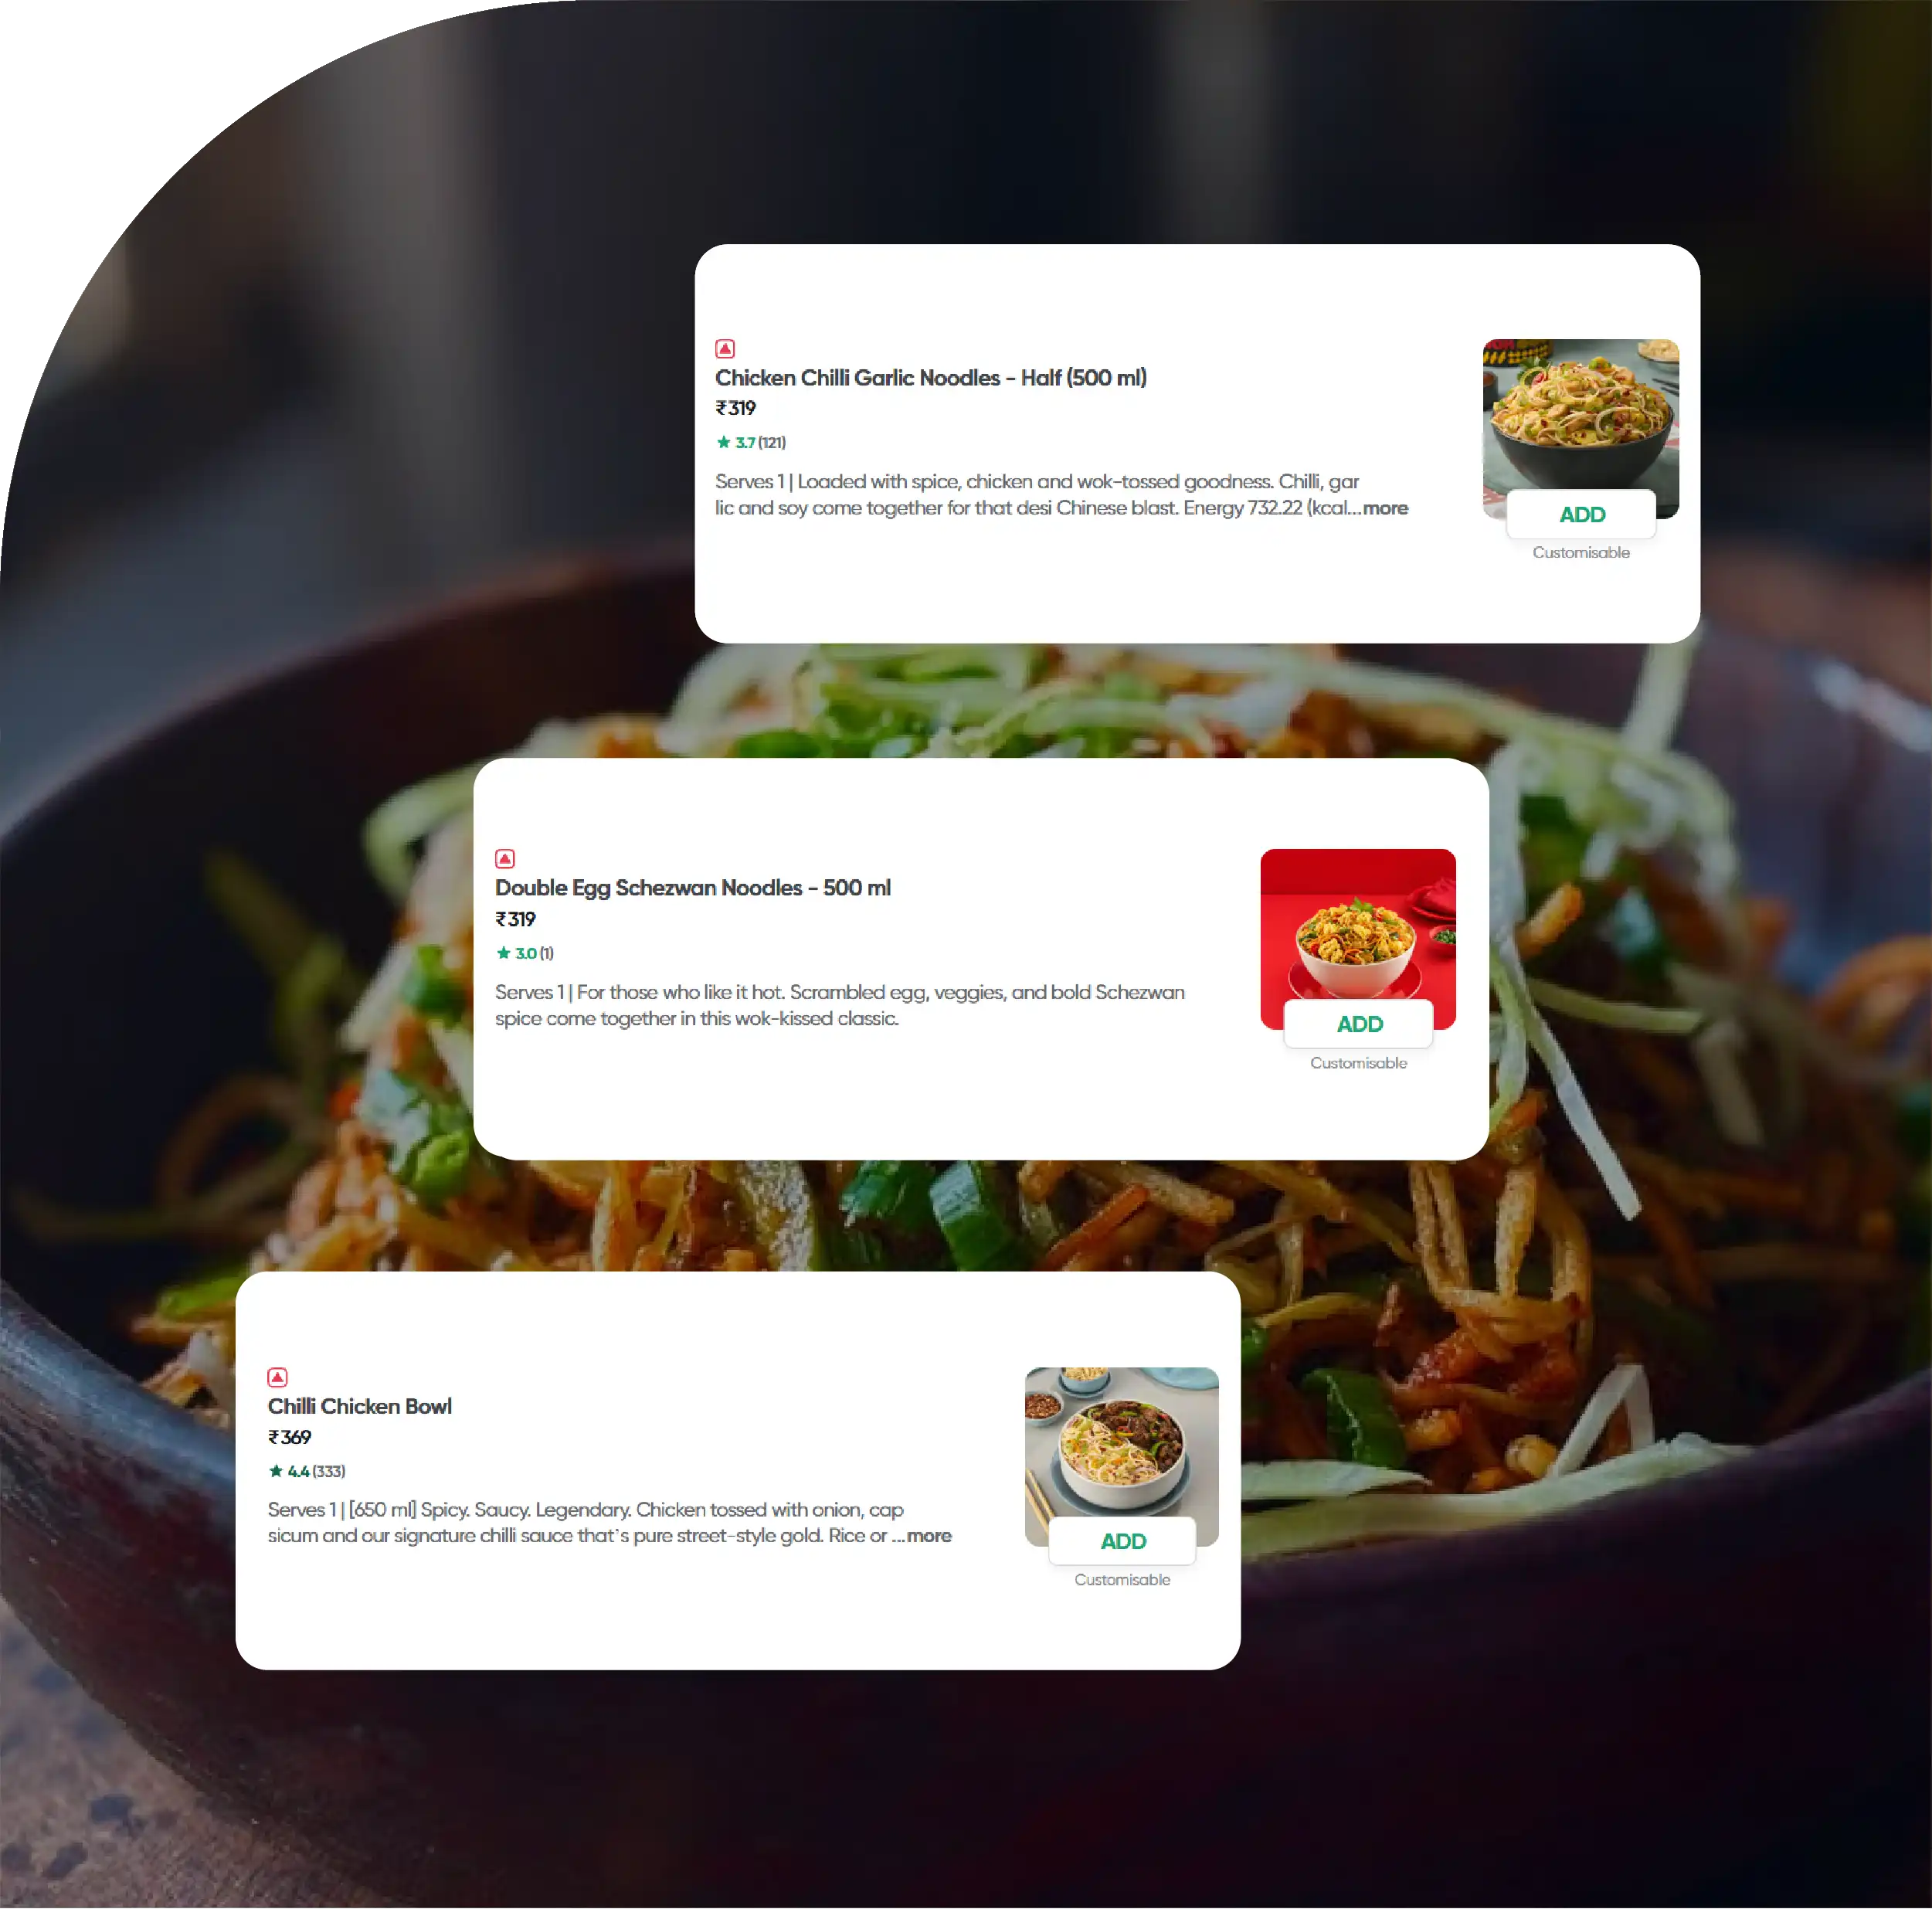
| Indo-Chinese | Chinese, momos, noodles | Sauces, noodles, frozen snacks | Counted per pincode; frequently a secondary tag |
| Biryani | Hyderabadi, Lucknowi, Kolkata biryani | Basmati rice, meat, packaging | Swiggy: over 2.6 lakh restaurants offered biryani and over 28,000 specialised in it (July 2023) |
| Cafes & beverages | Cafe, coffee, tea, bubble tea | Milk, coffee, syrups, machines | Counted per pincode; chain cafes checked against locators |
| Bakery & desserts | Bakery, cakes, sweets, ice cream | Flour, chocolate, dairy, chillers | Counted per pincode; includes sweet shops |
| QSR burger & pizza | Burger, pizza, fried chicken, wraps | Cheese, buns, fryers, beverages | Counted per pincode; chain share usually high |
| Hyper-regional | Goan, Bihari, Pahari, Kerala | Regional spices, seafood | Counted per pincode; small but fast-growing |
The biryani figure is from Swiggy as reported by Restaurant India . Other rows describe how outlet counts are built; no public source we found today gives a reliable national split of outlets by cuisine, so we do not show one.
Outlet density varies sharply between and within cities. NRAI's 2019 report sized the organised market at Rs 40,880 crore in Mumbai, Rs 31,132 crore in Delhi and Rs 20,014 crore in Bengaluru . Inside each city, restaurant outlet data usually shows a few dense pincodes holding a large share of outlets.
Growth is moving outward. Swiggy–Kearney says dining-out growth outside the top eight cities is twice that of the top eight . A Grant Thornton Bharat and NRAI survey found nearly 94% of operators plan to expand in Tier-II and Tier-III markets .
White-space analysis compares restaurant outlet data with a demand proxy such as population or households per pincode. A pincode with many offices but few cafes, or a growing suburb with no chain QSR, becomes a lead for expansion or a new distributor route.
| City tier | Example cities | Share of food-service market (sourced) | Delivery-active outlets on Swiggy, est. | Chain share and top cuisine |
|---|---|---|---|---|
| Metros and large Tier-I | Mumbai, Delhi NCR, Bengaluru, Chennai, Hyderabad, Kolkata, Pune, Ahmedabad | ~68% (balance of the Tier-II/III share, 2023) | ~180,000 est. | Measured per pincode in each run |
| Tier-II and Tier-III | Jaipur, Lucknow, Indore, Coimbatore, Kochi, Nagpur, Bhubaneswar, district towns | 32% in 2023, up from 21% in 2016 | ~85,000 est. | Measured per pincode in each run |
| Single-city reference | Hyderabad | Rs 10,161 crore organised market, ranked 6th of 21 cities | 74,807 restaurants, organised and unorganised (NRAI count, not an estimate) | Not published |
Figures marked est. are indicative estimates calculated by applying the NRAI Tier-II/III share of food-service market value (32% in 2023, cited in a D&B industry report: to Swiggy's 265.8 thousand average monthly transacting restaurant partners in Q1 FY27 , rounded. They are not counts from a live Food Data Scrape dataset. Value share is not the same as outlet share, so smaller cities are probably understated. The Hyderabad count is from NRAI IFSR 2024 via MediaBrief .
Chains and independents compete differently. Chains publish store locators, so their footprint can be tracked outlet by outlet. Independents dominate counts but change faster: they open, rename and close without notice.
Restaurant outlet data at pincode level shows where a chain is strong, where rivals cluster and where cloud kitchens fill the gap. Delivery-only brands often run from one kitchen, so a delivery-only flag stops them from inflating dine-in counts. Refreshing restaurant outlet data monthly or quarterly turns a static list into an openings and closures tracker.
Ratings and review counts by pincode help rank competition. A pincode with many 4.0+ rated biryani outlets is a harder launch than one with a few low-rated options. Treat these parts of restaurant outlet data as signals to test with field visits, not as final answers.
| Pincode metric from restaurant outlet data | How it is calculated | Use | Reported as |
|---|---|---|---|
| Outlet count by cuisine | Distinct matched outlets per cuisine group | Supplier targeting, white space | Count per cuisine group per pincode |
| Chain share | Chain outlets divided by all outlets | QSR expansion, competitor watch | Percentage of outlets |
| Delivery-only share | Outlets with no dine-in listing | Cloud kitchen mapping | Percentage of outlets |
| Median price band | Median cost for two | Premium vs value positioning | Rupees, cost for two |
| Pure-veg share | Outlets flagged pure veg | Dairy, meat and oil suppliers | Percentage of outlets |
| Rated 4.0+ share | Outlets at or above 4.0 average rating | Competitive intensity | Percentage of rated outlets |
| Net openings | New minus closed outlets since last run | Market momentum | Net count since last run |
1. Outlet universe by city: Food Data Scrape builds restaurant outlet data from public listings across Zomato, Swiggy, Google Maps and chain store locators, joined into one record per outlet. See the India Restaurant Database.
2. Cuisine and pincode counts: we map raw labels to a fixed cuisine taxonomy and assign India Post pincodes, so you get outlet counts by cuisine for every pincode you cover. Related: cuisine-wise menu data.
3. Chain and cloud kitchen flags: chain locations are checked against store locators, and delivery-only kitchens are tagged.
4. Refresh and change tracking: monthly or quarterly runs show openings, closures and rating shifts. Cadence, cities and coverage are agreed per project – ask for the current list.
5. Delivery your way: CSV, Excel, JSON, API or dashboard, with POI coordinates. Data stays at public business-listing level, with no personal contacts.
India's food-service market is growing towards an NRAI-projected Rs 7.76 lakh crore by FY28, and more of that growth is coming from organised chains, cloud kitchens and smaller cities. Yet most outlets are still independent and hard to count. Restaurant outlet data mapped by cuisine and pincode closes that gap for suppliers, distributors and QSR planners.
The value comes from method: clear outlet rules, careful de-duplication, pincode checks and a stable cuisine taxonomy. Download the full report using the form on this page, or talk to our data team about a sample for your cities:
Questions
No single official count exists. Swiggy alone reports 265.8 thousand average monthly transacting restaurant partners in Q1 FY27, and NRAI counts 74,807 restaurants in Hyderabad alone. Many outlets are offline-only, so the full total is higher.
Yes. Outlets are matched across sources, tagged with a cuisine group and assigned a pincode, so counts can be grouped by cuisine, outlet type and city tier.
Public listings on delivery apps such as Zomato and Swiggy, Google Maps listings, chain store locators and the India Post pincode directory, collected within each site's terms and rate limits.
In restaurant outlet data, records are linked using cleaned names, address tokens, coordinate distance and brand rules, with a manual review sample for borderline matches.
No. Our dataset stays at public business-listing level: outlet name, type, address, pincode, coordinates, cuisine, price band and ratings. Personal contacts are not collected.
Projects usually run monthly or quarterly so you can track openings and closures. The cadence is agreed per project.